
Introduction to QGIS
Introduction
Section titled “Introduction”This module provides an introduction to the QGIS software including its interface and the nuances that make it unique and powerful among other GIS.
By the end of the module, you should: be familiar with the QGIS interface, know how to download plugins, be able to change settings and create user profiles, and generally be more comfortable with using QGIS.
What you should already know
Section titled “What you should already know”Since this is a beginner module, no previous knowledge of GIS or QGIS is required.
About QGIS
Section titled “About QGIS”QGIS, known as Quantum GIS prior to its 2.X release, is a mature, cross-platform, free and open source Geospatial Information System (GIS).
It is a best-in-class, enterprise ready GIS that has features for collecting, storing, analyzing, presenting, and managing spatial & non-spatial data. It also integrates well with other existing geospatial technologies and serves as an integral part of any FOSS4G (Free and Open Source Software for Geospatial) stack.
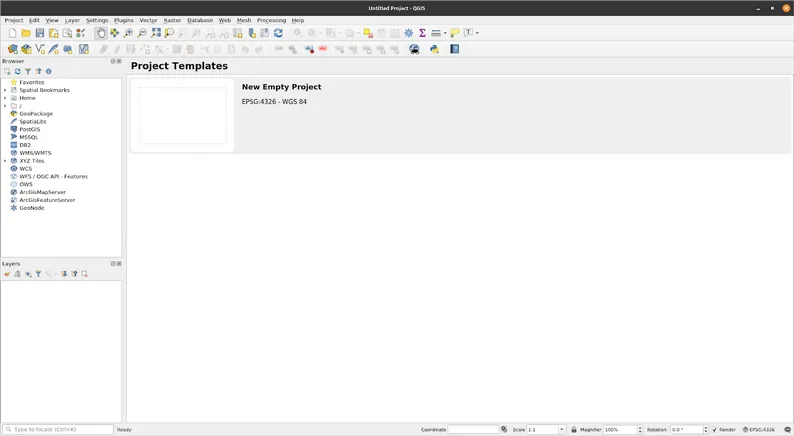
Being cross-platform, QGIS runs on GNU/Linux, macOS, Windows, and even Android.

![]()
Free software
Section titled “Free software”Free as in freedom not just free food.
Free software are software that adhere to the Four Essential Freedoms of Free Software, which are:
- The freedom to run the program as you wish, for any purpose (freedom 0).
- The freedom to study how the program works, and change it so it does your computing as you wish (freedom 1). Access to the source code is a precondition for this.
- The freedom to redistribute copies so you can help others (freedom 2).
- The freedom to distribute copies of your modified versions to others (freedom 3). By doing this you can give the whole community a chance to benefit from your changes. Access to the source code is a precondition for this.
Open source
Section titled “Open source”QGIS is also open source. Anyone is free to see, study, and download the source code for QGIS at https://github.com/QGIS/qgis/. Anyone is also free to build, modify, and share the source code and QGIS application.
QGIS is released under the GNU Public License (GPL) Version 2 or above. Developing QGIS under this license means that you can (if you want to) inspect and modify the source code and guarantees that the user will always have access to a GIS program that is free of cost and can be freely modified.
This open-source model provides several advantages over proprietary software, such as the flexibility to customize and adapt the software to specific needs and the ability to avoid expensive licensing fees. Moreover, open-source software has a community-driven development model that allows users to share ideas and collaborate, which often results in more innovative and user-friendly software.
Mature, reliable, and constantly improving
Section titled “Mature, reliable, and constantly improving”QGIS is an official project of the Open Source Geospatial Foundation and has been continuously improved over the last 20 years through collaborative development. The fact that QGIS is developed under an open source license means that users and developers have the freedom to access, inspect, modify, and share the software’s source code. This allows the QGIS community to work together to quickly identify and fix bugs, as well as develop and add new features to the software.
Being open source, QGIS fosters a community of users and developers who work together to create a more robust and versatile GIS tool, which ultimately benefits everyone who uses it. Additionally, being open source allows for greater transparency and accountability in the software’s development, and it eliminates the need for expensive licensing fees that are often associated with proprietary software.
The community of QGIS is not limited to just developers. Everyone can participate in improving QGIS. There are several ways to contribute to QGIS and get involved with the community. You can report bugs, participate in support channels, translate and document QGIS, develop plugins and new features, or even financially support the project as a sustaining member or donor.
There are also several avenues to find support for QGIS. There is the documentation on the QGIS site, free blogs and articles on the web, stackoverflow, the QGIS mailing lists, and organizations that provide paid technical support.
QGIS versions and release cycle
Section titled “QGIS versions and release cycle”QGIS releases and development follow a time-based release schedule/roadmap.
Some nuances of the QGIS release cycle are:
- Release versions are marked with even numbers (e.g. 3.22, 3.24, 3.32, etc.)
- Development versions are marked with odd numbers (e.g. 3.21, 3.23, 3.31, etc.)
- There is a new release every four (4) months.
- For each release cycle, the first three months are used for development. Afterwhich, a feature freeze (i.e. no further development) is invoked and the fourth month is used for testing, bug-fixing, translation, and release preparations.
- Every third release is a Long-Term Release that is maintained until the next Long-Term Release occurs.
- The first release of the the new LTR (X.Y.0) is assigned as a Release Candidate (RC).
For example, for QGIS version 3.34.3 - Prizren:
- 3 - main version
- 34 - release version (1 every 4 months)
- 3 - point release of the release version (1 per month)
- Prizren - release name
In the development phase, developers work on adding new features for the next release. Users who want to use or test these new features can download or install QGIS from the development branch (i.e. odd numbered versions). In the feature freeze phase, new features are not allowed in anymore and the focus of everyone moves from enhancing QGIS to stabilizing it.
There have been discussions in the community to lower the number of releases and lengthen the time that the Long Term Release is supported.
Learn more at: https://bnhr.xyz/2020/10/26/about-qgis-versions-release-cycle-filipino.html
Due to the speed of development and release of QGIS versions, beginners usually find it confusing to choose which version to download and install. There are three branches (or releases) that users can choose from when installing QGIS — the Long Term Release (LTR), Latest Release (LR), and Development (Nightly).
Long Term Release (LTR)
Section titled “Long Term Release (LTR)”- receives bug-fixes until the next LTR is released (usually 1 year or 3 LRs)
- normally doesn’t receive new features or backports unless these are very important features -> stable set of features for the duration of the LTR
- a Point Release (PR) is released every month containing the bug-fixes
Latest Release (LR)
Section titled “Latest Release (LR)”- contains the most recent features
- every third LR is designated as the new LTR
- a Point Release (PR) is released every month containing the bug-fixes and new features
Development (Nightly)
Section titled “Development (Nightly)”- based on the most recent version of the source code (hence the name nightly build)
- contains bleeding-edge and in-development features
- might also contain bugs
- great for testing
- not recommended for use in production or stable environments
Installing QGIS
Section titled “Installing QGIS”QGIS is cross-platform and works on Linux, Windows, and macOS. Being open source, you can build and install QGIS from its source code available at https://github.com/qgis/QGIS/.
Installers and installation instructions are also available at https://qgis.org/download/ or https://qgis.org/resources/installation-guide/.
For Linux (or GNU/Linux), QGIS is usually available from your distribution’s package manager. For Debian/Ubuntu users, QGIS has repositories for the LR, LTR, and Development branches as well as versions of QGIS with dependencies from the ubuntugis-unstable PPA. QGIS is also available as a Flatpak package or in Conda.
For Windows, users can choose between the OSGeo4W Network Installer or the Standalone installers. There’s one Standalone installer for the LTR and LR version.
The offline standalone installers (.msi) are the easiest to install and are recommended for beginners. Multiple versions of QGIS can be installed in your computer at once. This means that you can have both the LR and LTR versions installed.
The OSGeo4W Network Installer is a bit more advanced and complex than the standalone installers but it also gives you the ability to update and upgrade your QGIS version in-place which means that you won’t need to uninstall an older version if you want to install a newer one.
In some cases, you would need administrator rights to install QGIS so if you are installing it on a computer where your user does not have administrator rights, you might need to ask your IT or office administrator to install QGIS for you.
The installation in Windows also comes with QGIS with GRASS (another Free and Open Source GIS).
Note that since QGIS 3.20, QGIS has removed 32-bit support for Windows so it is best to install QGIS on a computer that runs a 64-bit operating system.
For macOS, there are binary packages and MacPorts.
QGIS Interface
Section titled “QGIS Interface”One of the great strengths of QGIS is its highly customizable user interface. You can personalize your workspace by rearranging toolbars, creating new menus, and adding or removing buttons to better suit their needs. The user interface is also designed to be intuitive and user-friendly, with features such as drag-and-drop functionality and tooltips to help you quickly learn and understand the various tools and functions. Additionally, you can choose from a variety of themes to customize the appearance of the user interface. This flexibility allows QGIS to cater to your needs and preferences as well as to those of a wide range of users, making it a versatile and powerful tool for geospatial analysis and visualization.
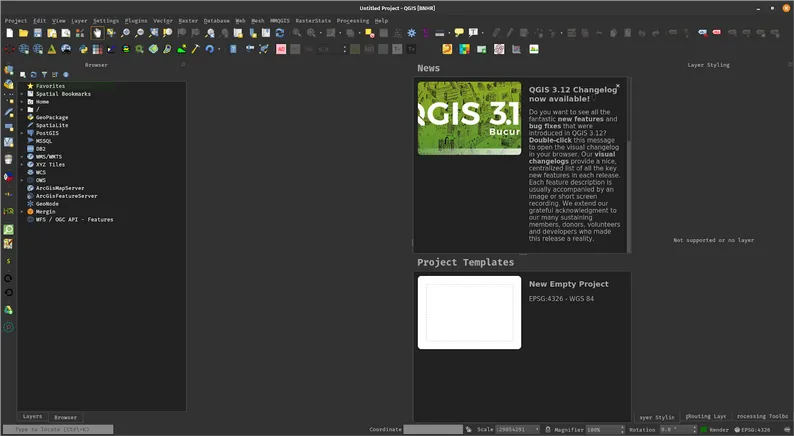
Upon staring QGIS, you will see the QGIS User Interface (UI) on your computer screen. It’s where you’ll be able to view and work with your maps and data. At the top of the interface, you’ll find a menu bar with different options for managing your project, editing data, and more. On the left side of the interface, you’ll usually find a panel with different tools for adding and manipulating data, selecting features, and changing styles. The main part of the interface is the map canvas at the center where your map will be displayed. You can use your mouse to zoom in and out of the map and pan around to see different areas. All around the map canvas are panels and toolbars which can be positioned around the canvas. Panels can also be docked on top of each other to create a multi-tab Panel.
By editing the settings and utilizing user profiles—topics that will be discussed later in this module—the “look and feel” of the QGIS user interface can be changed on a per-user basis.
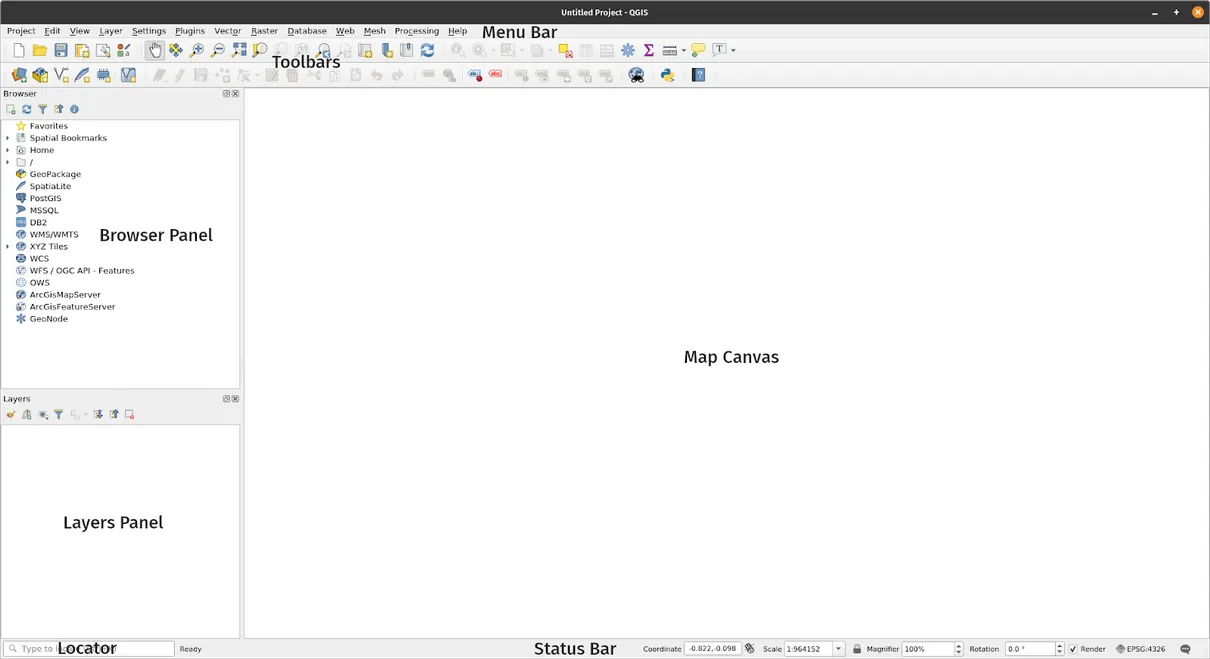
For now, let’s look at the standard parts of the QGIS interface that beginners need to be familiar with. These are:
Menu Bar
Section titled “Menu Bar”Menu Bar - the Menu bar is a simple hierarchical menu that provides access to QGIS functions and commands. These menus are organized by category, such as File, Edit, View, and Plugins. Users can use the menu bar to perform a variety of tasks, including opening and saving projects, editing layers, and configuring the application’s settings. It is usually located at the top of the UI.
Map Canvas
Section titled “Map Canvas”Map Canvas - the Map Canvas is where layers loaded in QGIS are shown. This is also where filters, selects, and symbologies created by the user are reflected. You can zoom, pan, and even rotate the map canvas or use it to show 3D data. You can also use the map canvas to measure distances and areas, add annotations, and perform various analysis functions. More than one map canvas can be present at any time. You can add a map canvas under View ‣ New Map View (CTRL+M).
Toolbars
Section titled “Toolbars”Toolbars - toolbars show click-and-run buttons. They allow easy access to QGIS commands, features, plugins, etc. They can be moved and docked around the Map Canvas. They can be customized to show or hide specific tools, and users can create their own custom toolbars. The list of toolbars can be found, activated, and deactivated from the Menu bar under View ‣ Toolbars. Examples include the Standard toolbar, which contains tools for navigating the map and editing features, and the Advanced Digitizing toolbar, which contains tools for creating and editing new features.
Panels
Section titled “Panels”Panels - panels are similar to toolbars but instead of buttons, they provide an interface to more complex functions and features. Similar to toolbars, they can be moved and docked around the Map Canvas. The list of panels can be found, activated, and deactivated from the Menu bar under View ‣ Panels. Examples include the Layers panel, which displays the layers in a project and allows users to manage them, and the Processing Toolbox, which provides access to a wide range of geoprocessing tools.
Status Bar
Section titled “Status Bar”Status Bar - the Status Bar is located at the bottom of the UI and shows relevant information about the current state of the QGIS instance such as the current map scale, coordinates of the mouse cursor, and any messages or warnings generated by the application. Users can also use the status bar to change the snapping settings and toggle various options, such as the full-screen mode.
Locator Bar
Section titled “Locator Bar”Locator Bar - the Locator bar is found on the bottom left corner of the QGIS interface. It allows you to easily access layers, fields, processing algorithms, and other things in QGIS. This is one of the most powerful features of QGIS. You can enter search terms, such as place names or feature IDs, and the locator bar will highlight matching features on the map canvas. The locator bar can also be used to zoom to specific areas of the map, set the map extent, or run processing algorithms.
There are other parts of the User Interface such as the Python Interface and the Print Layout. These two interfaces are discussed in more detail in the advanced courses.
Python interface
Section titled “Python interface”Python interface - the Python interface in QGIS can be accessed via Plugins ‣ Python Console (CTRL+ALT+P), which is a built-in interpreter that allows users to run Python scripts directly within QGIS. This provides a convenient way to interact with QGIS data and tools programmatically, without the need for external scripting environments. Additionally, the QGIS Python API has an extensive set of modules that can be used to perform a wide range of geospatial tasks, such as reading and writing vector and raster data, processing spatial analyses, and creating cartographic outputs.
Print Layout
Section titled “Print Layout”Print Layout - the Print Layout interface in QGIS, which can be accessed via Project ‣ New Print Layout (CTRL+P), is a tool for creating high-quality maps and print-ready layouts. This interface provides an interactive environment where users can add map items, such as maps, labels, legends, and images, as well as arrange and style them to create a visually appealing and informative map. The interface offers various functionalities such as rulers, grids, guides, and snapping to help users align and arrange items precisely and also allows users to export the layout as a high-quality PDF, image file, or print directly to a printer.
Exercise 2.1. Editing the QGIS User Interface layout
Section titled “Exercise 2.1. Editing the QGIS User Interface layout”- Open QGIS
- Click the View menu
- Observe the Toolbars menu
- Observe the Panels menu
- Select the Toolbars and Panels you want to show in the user interface
- Move the Toolbars and Panels to the positions that make the most sense for you
QGIS Plugins
Section titled “QGIS Plugins”The ability to add, create, and extend QGIS’ functionality is one of its most powerful features. One of the ways this is done is through the use of plugins. QGIS plugins are additional tools that can be added to QGIS to enhance its functionality. They are developed by the QGIS community and can be easily installed from the QGIS Plugin Manager. Once a plugin is installed, it can be accessed from the QGIS interface and used like any other tool within the software.
Plugins can be used to perform a wide variety of tasks, such as geocoding addresses, creating animations, exporting data to specific formats, and much more. By using plugins, QGIS users can customize their workflows and perform tasks that may not be possible with QGIS’ default features.
There are many different types of plugins available, ranging from simple tools to complex algorithms and data processing workflows to mundane tasks such as adding hats to the QGIS logo. As of QGIS 3.28.3, there are more than 1,500 plugins that you can download, use, and even modify.
QGIS plugins can be classified as:
- Core plugins - built-in to your version of QGIS, cannot be uninstalled
- External plugins - manually installed by fetching from an external repository (i.e. QGIS Official Plugin Repository) or via the source code.
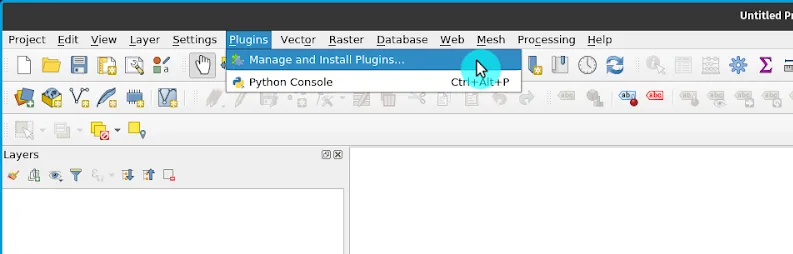
Plugins are managed using the Manage and Install Plugins dialog accessible using Plugins ‣ Manage and install plugins from the menu bar.
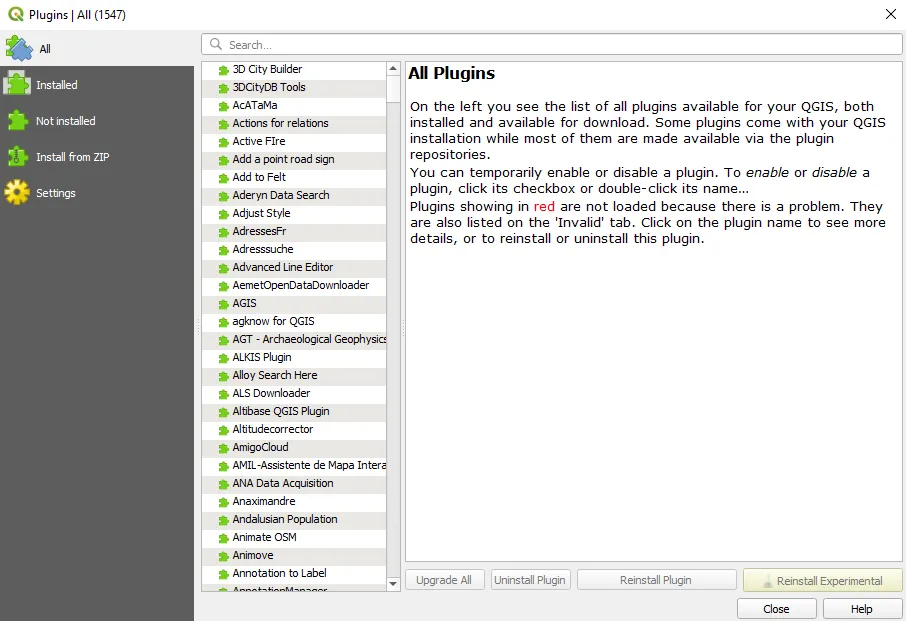
The Manage and Install Plugins Dialog connects to the QGIS Official Plugin repository (or any repository that you indicate in the Settings Tab) to fetch plugins available for your version of QGIS. It has 5 Tabs:
- All Tab – shows ALL the plugins available for your QGIS version including those that are already installed on your machine
- Installed Tab – shows only the plugins installed on your machine
- Not installed Tab – shows the plugins that are not installed on your machine
- Install from ZIP – allows you to install plugins from a ZIP file
- Settings Tab – gives you options on when to check for plugin updates, whether or not to include experimental and deprecated plugins, or add/change the repository to fetch plugins from.
The Search Bar allows you to search for plugins found in the plugin repository/ies that you are connected to.
Plugins can be installed in three (3) ways:
- Via the Manage and Install Plugins Dialog (Plugins ‣ Manage and Install Plugins)
- Installing from ZIP which can be accessed under the Install from ZIP tab in the Manage and Install Plugins dialog.
- Manually adding the source code in your QGIS profile’s plugins folder. This folder can usually be found at:
- Linux: .local/share/QGIS/QGIS3/profiles/default/python/plugins
- Mac OS X: Library/Application/Support/QGIS/QGIS3/profiles/default/python/plugins
- Windows: C:\\Users<User>\AppData\Roaming\QGIS\QGIS3\profiles\default\python\plugins
Making your own plugin
Section titled “Making your own plugin”What if there’s no plugin that does what you want? Well, you can always make one yourself!
The Plugin Builder is a plugin that creates a template that can serve as the starting point for QGIS plugin development so you won’t have to create one from scratch. You can install it from the Manage and Install Plugins Dialog.
Of course, you can always create a plugin from scratch. If you are interested in creating your own plugin, you can check the Official QGIS documentation. For Python plugins, it’s a good idea to check out the PyQGIS Developer Cookbook.
For more information, see: https://bnhr.xyz/2018/10/08/qgis-plugins-3.0.html
Using Python and making QGIS plugins is a topic of discussion in the QGIS: Extending with Python and PyQGIS coures.
Exercise 2.2. Installing plugins
Section titled “Exercise 2.2. Installing plugins”- Open the Manage and Install Plugins dialog.
- Go to the All Tab and search for the Memory Layer Saver plugin.
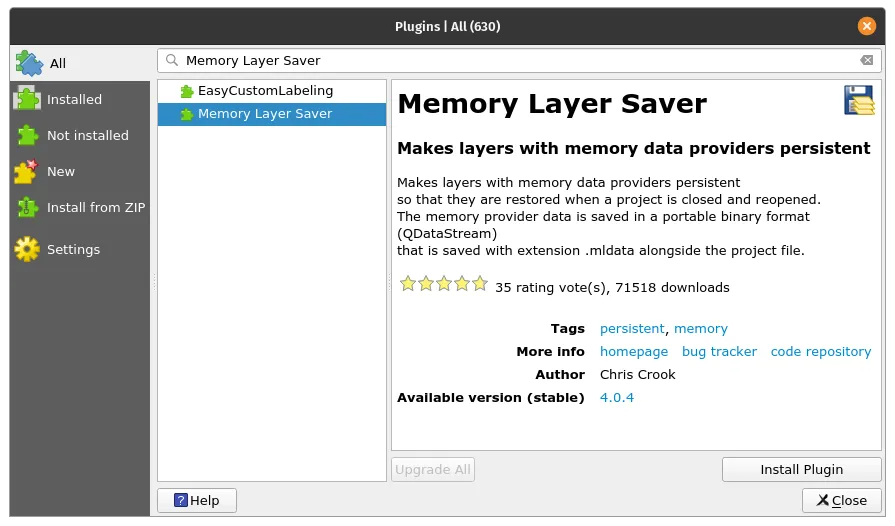
- Install the plugin by clicking Install Plugin at the bottom right corner of the Manage and Install Plugins dialog.
- Try to Install the following plugins as well:
- QuickOSM
- Spreadsheet Layers
- SRTM Downloader
- OpenHazardsPH
- QuickMapServices
- OpenTopography DEM Downloader
- QGIS GeoNode
- Did you manage to install all the plugins?
QGIS Settings
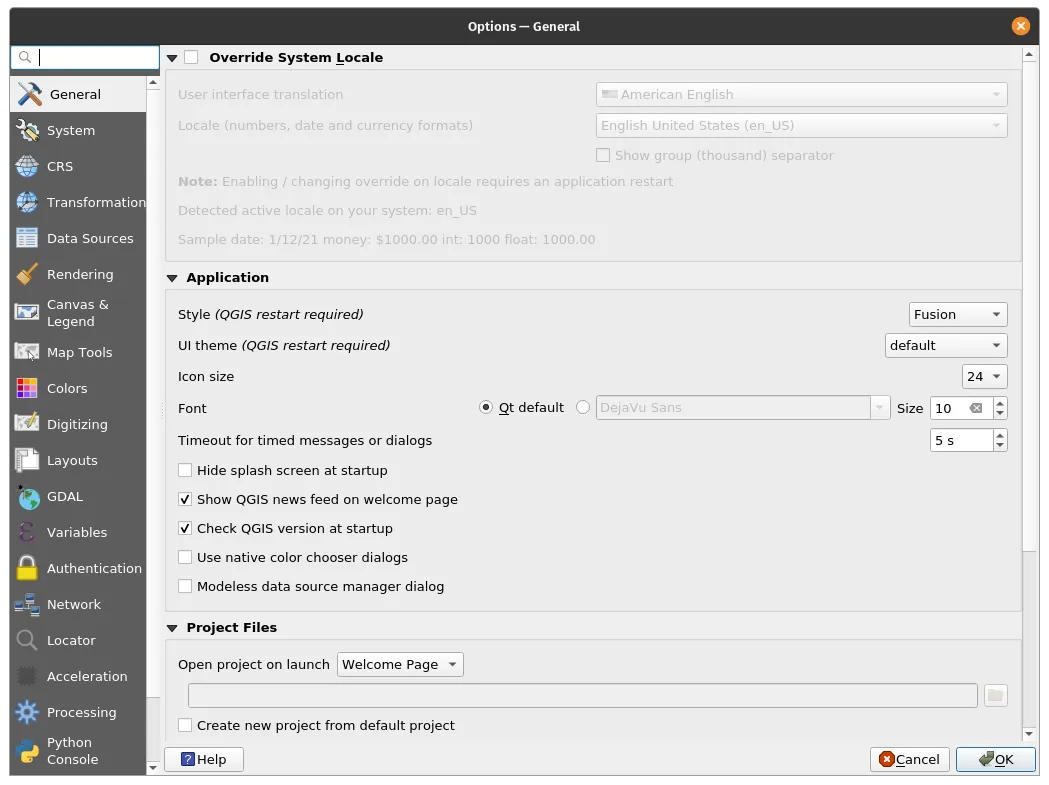
Section titled “QGIS Settings”QGIS has a wide range of settings that can be adjusted to customize the software to your specific needs. You can access the settings by clicking on the Settings ‣ Options. Under this menu, you can manage User Profiles, Styles, Projections or Coordinate Reference Systems, Keyboard Shortcuts, the User Interface, and others.
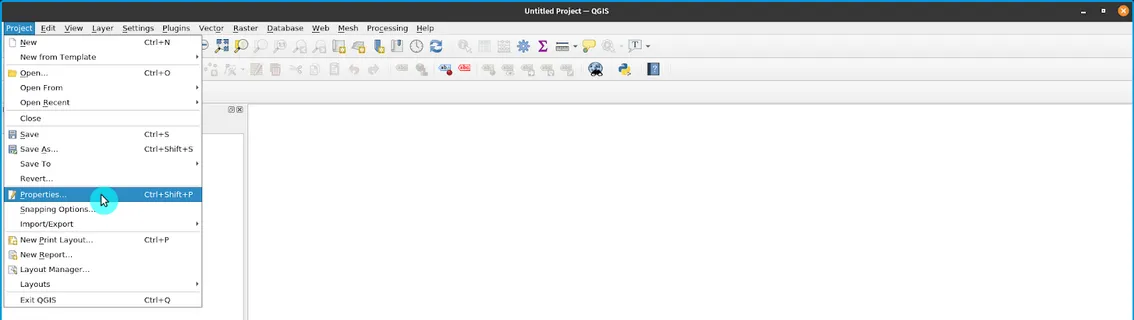
The settings found in the Settings menu are the default settings used by QGIS unless they are overridden by a Project’s settings. Project Settings can be found in Project ‣ Properties and pertain to settings or properties for the current project. These values override the system defaults.
The settings dialog is composed of several tabs. In the General tab, you can set options for the user interface, project defaults, and feature attributes. In the Data Sources tab, you can configure settings related to data providers such as WMS, WFS, and PostGIS. The Processing tab allows you to manage processing options and algorithms while the Network tab has settings for proxy servers and authentication.
There are also settings for various plugins that can be installed in QGIS, including options for the processing toolbox, WhiteBoxTools, OrfeoToolbox, and many others. Each plugin will have its own set of settings that can be configured.
Exercise 2.3. Changing the UI theme
Section titled “Exercise 2.3. Changing the UI theme”- You can change the look-and-feel of QGIS under Settings ‣ Options ‣ General Tab.
- Choose between three themes—default, Blend of Gray, and Night Mapping.
- Try to also change the size of the icons, the font used by QGIS, and other system defaults.
For some settings in QGIS, you might need to restart the application for them to take effect.
Bonus 2.3.1. Adding a custom splash screen in QGIS
Section titled “Bonus 2.3.1. Adding a custom splash screen in QGIS”One of the coolest ways that QGIS allows its users to customize their experience is by allowing them to use a custom splash screen that shows when QGIS starts up. Yes, with just a few steps, you can have QGIS running a custom splash.
Try it out at: https://bnhr.xyz/2020/09/05/custom-splash-screen-qgis.html
QGIS User Profiles
Section titled “QGIS User Profiles”QGIS 3.X introduced the concept of QGIS User Profiles.
A User Profile is a collection of settings for plugins installed, toolbars enabled, arrangement of the User Interface, and other settings. QGIS comes with a default User Profile named default.
User profiles allow the user to have multiple profiles with their own customized QGIS environment on a single computer or QGIS installation. Each profile has its own set of plugins, settings, toolbars, and preferences that are separate from other profiles in the same computer. This feature is particularly useful for organizations with multiple users sharing the same computer, such as in a classroom or office setting. This is also relevant for single users who want to maintain specific profiles for specific functions—e.g. a profile for cartography and visualization, one for water resource management, one for remote sensing, etc.
Users can easily switch between their own profiles, which eliminates the need to constantly adjust settings each time they use QGIS. Furthermore, User Profiles can be backed up and transferred to other computers, which makes it easier to maintain a consistent QGIS environment across different machines.
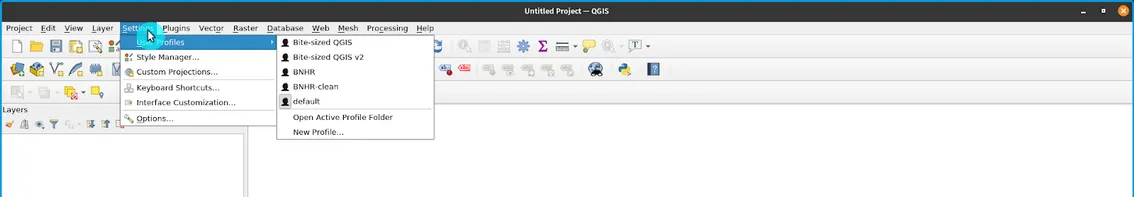
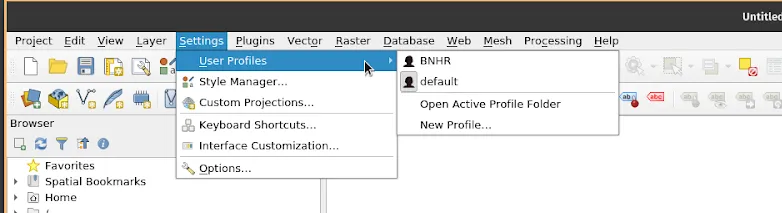
User Profiles can be created and accessed from the menu bar under: Settings ‣ User Profiles.
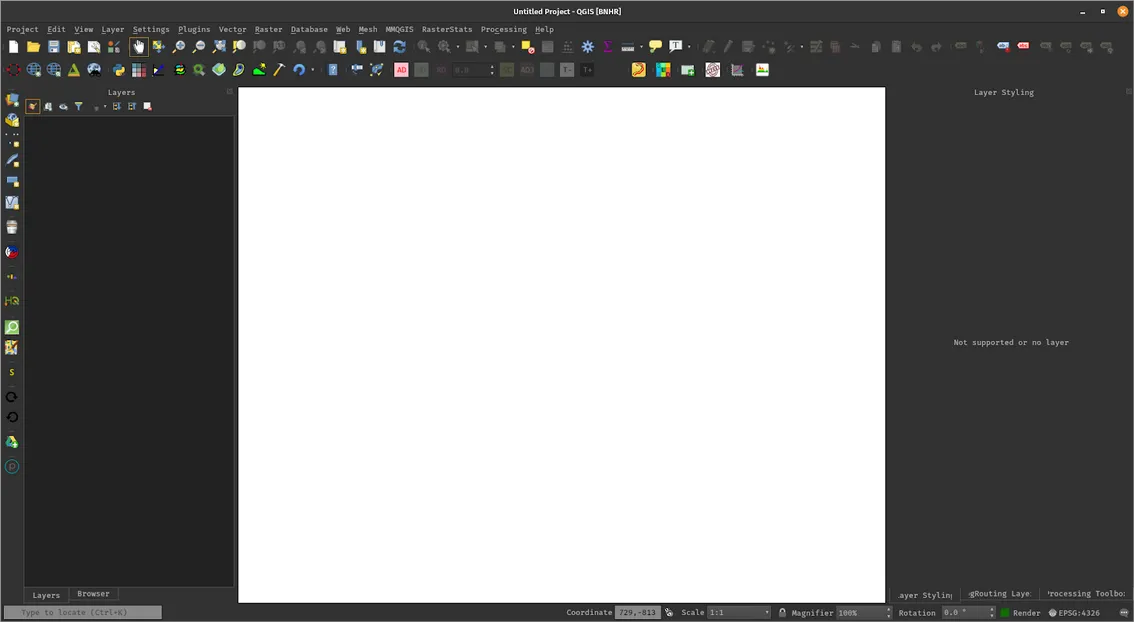
The active user profile is shown with [User Profile] in the title bar.
Exercise 2.4. Creating a user profile
Section titled “Exercise 2.4. Creating a user profile”- Go to Settings ‣ User Profiles ‣ New Profile…
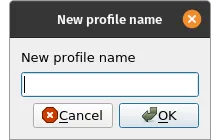
- Give your new user profile a name.
- A new QGIS window should open with your new user profile. Notice that your profile name is shown in the QGIS title bar.
- Do you notice any difference in the new user profile? Check the user interface, plugins, and settings of the old profile and the new profile you created.
QGIS File Formats
Section titled “QGIS File Formats”QGIS Project File (QGS/QGZ)
Section titled “QGIS Project File (QGS/QGZ)”QGIS Projects are to QGIS as .mxd files are to ArcMap. These files come either as QGS (.qgs) or QGZ (.qgz). The main difference between the two is that the QGZ format is a compressed (zip) archive containing a QGS file and a QGD file. The QGS format is an XML format for storing QGIS projects. The QGD file is the associated sqlite database of the qgis project that contains auxiliary data for the project. If there are no auxiliary data, the QGD file will be empty. A QGIS Project File contains everything that is needed for storing a QGIS project, including:
- project title and CRS
- the layer tree
- relations
- the map canvas extent
- project models
- legend
- mapview docks (2D and 3D)
- the layers with links to the underlying datasets (data sources) and other layer properties including extent, SRS, joins, styles, renderer, blend mode, opacity and more.
- project properties
QGIS Layer Definition (QLR)
Section titled “QGIS Layer Definition (QLR)”A QGIS Layer Definition file (QLR) is an XML file that contains a pointer to the layer data source in addition to QGIS style information for the layer. Currently, a QLR file corresponds to a single layer only.
The use case for this file is simple: To have a single file for opening a data source and bringing in all the related style information. QLR files also allow you to mask the underlying datasource in an easy to open file.
An example of QLR usage is for opening a layer from a PostGIS database. Instead of connecting to the database, finding the layer, and applying a filter, you can just open a .qlr file that points to the correct PostGIS layer with its corresponding style and filter.
QGIS Style File (QML)
Section titled “QGIS Style File (QML)”QML is an XML format for storing layer styling. A QML file (.qml) contains all the information that tells QGIS how to render feature geometries which includes symbol definitions, sizes and rotations, labelling, opacity, blend mode, and more.
A .qml file should have the same name as the data source it corresponds to. When it is found in the same directory or folder as the data source, loading the data source will also automatically load its style as defined in the .qml file.
For example, if you have a GeoJSON named regions.geojson and a QML file named regions.qml, loading regions.geojson in QGIS will apply the styles defined in regions.qml in the loaded layer.
When using GeoPackages (.gpkg), a .qml file is oftentimes not needed since you can save a layer’s style directly in the geopackage.
Quiz and discussion questions
Section titled “Quiz and discussion questions”QGIS INTERFACE
-
You can have multiple map canvases in a single instance of QGIS. a. TRUE
b. FALSE
-
What Menu will allow you to show or hide Toolbars and Panels? a. Project
b. View
c. Layer
d. Settings
QGIS PLUGINS
-
You can remove or uninstall Core plugins. a. TRUE
b. FALSE
USER PROFILES
-
What Menu will allow you to create or change User Profiles? a. Project
b. View
c. Layer
d. Settings
-
You can only have one user profile in QGIS. a. TRUE
b. FALSE
-
How can user profiles make your workflow more efficient?
QGIS SETTINGS
-
You can’t override the system settings and properties. a. TRUE
b. FALSE
QGIS FILE FORMATS
-
When you save a QGIS project, in what file format is it saved? a. .shp
b. .qml
c. .qsave/.qsv
d. .qgs/.qgz
Certification and support
Section titled “Certification and support”Contact us or sign-up to our courses if you are interested in having this as an instructor-led or self-paced course.