
BONUS: Web mapping, publishing, and visualizations
Web maps and QGIS
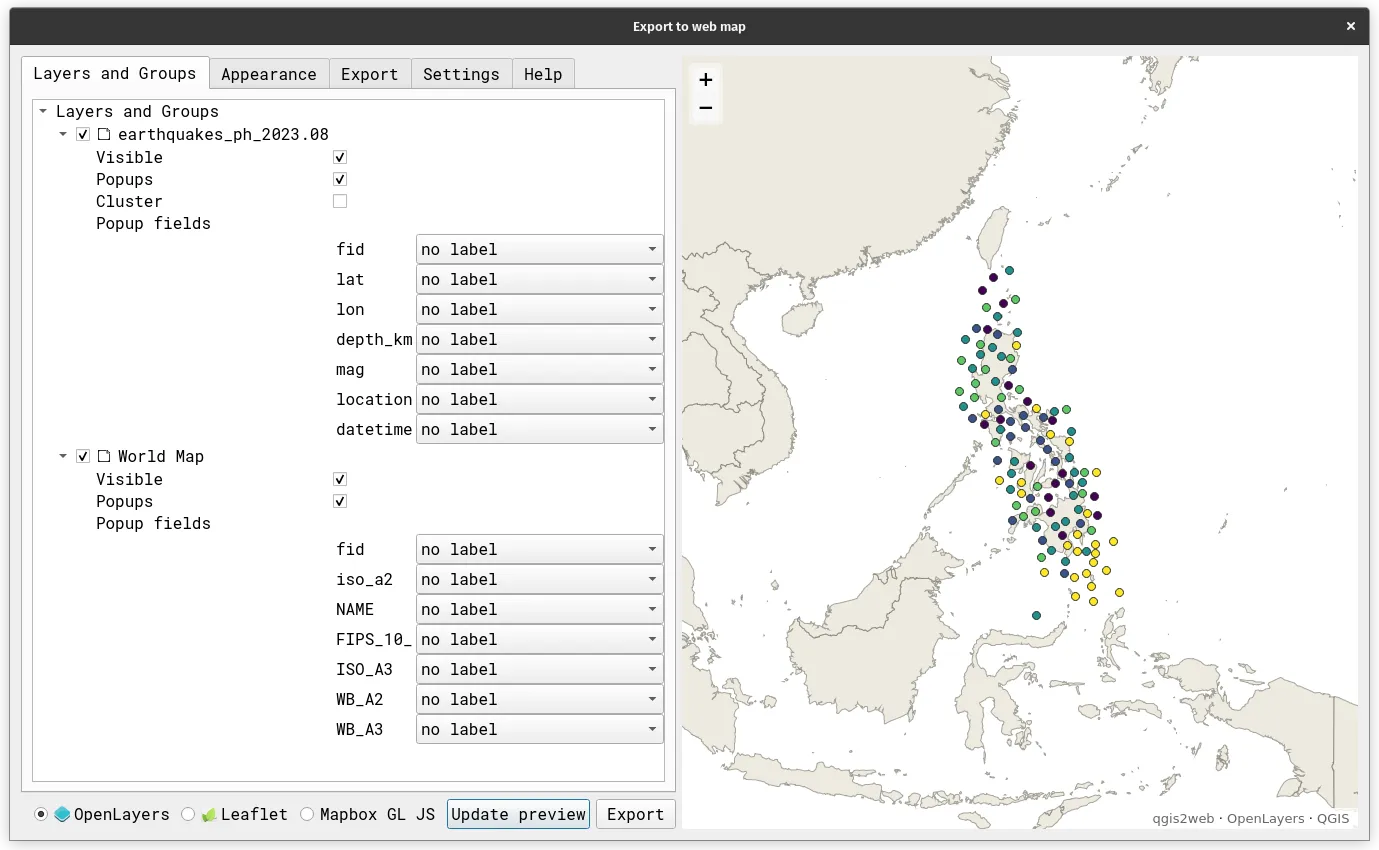
Section titled “Web maps and QGIS”qgis2web plugin
Section titled “qgis2web plugin”One of the easiest ways to create an easy-to-deploy webmap in QGIS is by using the qgis2web (https://plugins.qgis.org/plugins/qgis2web/) plugin. The plugin generates a web map from your current QGIS project, either as OpenLayers, Leaflet, or Mapbox GL JS. It tries to replicate as many aspects of the project as it can. The output can then be stored in any web-enabled location (e.g. GitHub pages) for online access.
Add to Felt plugin
Section titled “Add to Felt plugin”The Add to Felt plugin allows you to export export QGIS projects to new maps in Felt.com for easier sharing and collaboration with colleagues via the web.
Felt is a web SaaS that allows you to easily build shareable maps.
Bonus 01: Other web mapping and visualization tools
Section titled “Bonus 01: Other web mapping and visualization tools”If you require more advanced, custom, or fine-tuned web maps, you may want to take a look at thes web mapping and visualization libraries. Most of the time, knowledge of JavaScript and similar web technologies are needed to utilize these
- Leaflet (https://leafletjs.com/): Leaflet is an open-source JavaScript library for interactive maps. It’s lightweight, versatile, and widely used for creating customizable maps on websites. Leaflet provides various mapping features and works seamlessly across different platforms and devices.
- MapLibre (https://maplibre.org/): The MapLibre GL JS is an open source TypeScript library for publishing web maps. It started as as an open-source derivative of mapbox-gl-js with the first version of MapLibre GL JS maintaining complete compatibility with Mapbox GL JS v1 in order to simplify the transition from existing Mapbox v1 solutions to MapLibre. With MapLibre GL JS v2, compatibility with Mapbox GL JS v1 is not guaranteed anymore.
- Protomaps (https://protomaps.com/): Protomaps is an open source, server-less system for deploying webmaps. It offers an alternative to API-based map services by using a system designed around single static files read in byte ranges from cloud storage. This makes it easy to deploy and scale.
- Mapbox (https://www.mapbox.com/): Mapbox is a popular mapping platform that offers tools and APIs for creating interactive maps and location-based applications. It provides various services, including map design, geocoding, routing, and data visualization. Mapbox is under a proprietary source-available license.
- deck.gl (https://deck.gl/): deck.gl is a WebGL-powered data visualization library that specializes in large-scale and complex geospatial visualizations. It’s particularly well-suited for displaying large datasets and provides various layers for creating maps with intricate visualizations.
- Kepler.gl (https://kepler.gl/): Kepler.gl is an open-source geospatial data visualization tool developed by people from Uber. It allows users to easily create and customize maps with multiple layers and data types. Kepler.gl is user-friendly and supports the visualization of diverse geospatial data.
- Unfolded (https://www.unfolded.ai/): Unfolded offers a platform for interactive geospatial data visualization especially for large and 3D datasets built with deck.gl and Kepler.gl. It was acquired by Foursquare in 2021.
Bonus 02: QGIS for publishing data and maps on the web
Section titled “Bonus 02: QGIS for publishing data and maps on the web”No-code and collaborative web maps
Section titled “No-code and collaborative web maps”- Datawrapper (https://www.datawrapper.de/): Datawrapper offers an easy way to create dynamic, beautiful, and shareable charts, maps, and tables without coding or design skills required.
- Felt (https://felt.com/): Felt considers itself as “the world’s first collaborative mapping tool built for anyone to make a beautiful map in minutes”.
- Mapbox Studio (https://www.mapbox.com/mapbox-studio): Mapbox Studio is Mapbox’s tool that allows you to design custom maps using Mapbox with no coding or design experience.
Web map publishing with QGIS
Section titled “Web map publishing with QGIS”- Lizmap (https://www.3liz.com/en/lizmap.html): Lizmap allows you to create web applications from QGIS that allows you to (1) faithfully reproduce the cartographic rendering made in QGIS, (2) edit the map in QGIS, and (3) print from the web.
- GISQuick (https://gisquick.org/): GISQuick is a geospatial data publishing platform for sharing projects created with QGIS and for creating generic web maps with QGIS easily.
- QGIS Server: QGIS itself can serve as a OGC-compliant geospatial server.
QGIS as part of a geospatial framework
Section titled “QGIS as part of a geospatial framework”- GeoNode (https://geonode.org): GeoNode is a web-based application and platform for developing geospatial information systems (GIS) and for deploying spatial data infrastructures (SDI) built on a robust foundation of open geospatial tools such as PostGIS for its database and GeoServer for its server. It excels in data sharing, management, and visualization. It offers a user-friendly web-based interface that allows users to easily publish, share, and collaborate on geospatial data and maps. QGIS can be used both as an alternative server for GeoNode or as a client used to access and edit data stored in GeoNode.
- PostGIS (https://postgis.net) + GeoServer (https://geoserver.org/) + QGIS stack: This technology stack combines a robust back-end (database + server) with QGIS serving as the primary data analysis and visualization tool.
Certification and support
Section titled “Certification and support”Contact us or sign-up to our courses if you are interested in having this as an instructor-led or self-paced course.