
The QGIS Atlas
Before we begin
Section titled “Before we begin”Before diving into this module’s exercises, it would be good if you can review and familiarize yourself with the QGIS Atlas.
QGIS Atlas allows you to automatically create a series of maps using a single layout. A properly configured QGIS Atlas will save you countless hours.
A simple Atlas with data-driven elements
Section titled “A simple Atlas with data-driven elements”3.1. District map of Quezon City showing population statistics per barangay
Section titled “3.1. District map of Quezon City showing population statistics per barangay”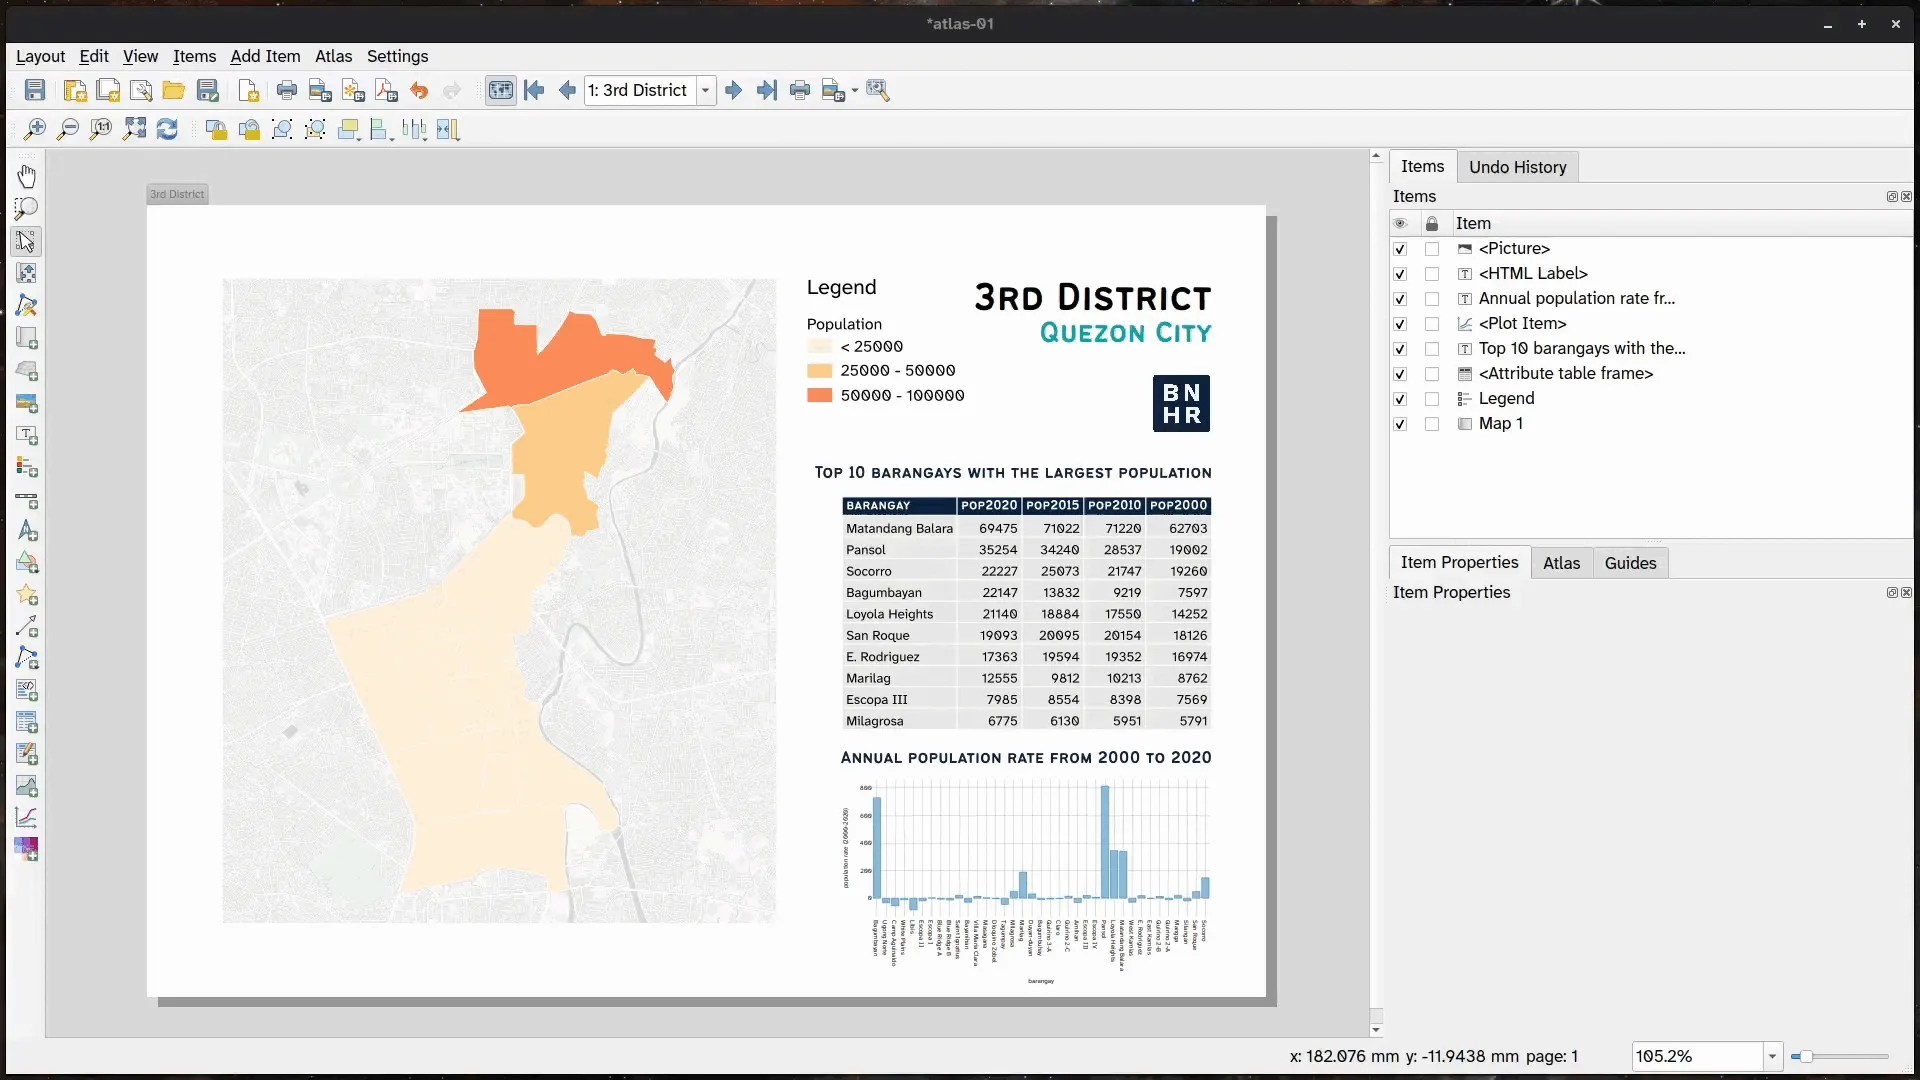
In this exercise, you will take the adm_brgy_quezon_city_pop2000_2020 layer and create an Atlas that generates one map per district but shows information about the barangays inside that district. To do that, you will utilize data-defined overrides and expressions.
- Load the adm_brgy_quezon_city_pop2000_2020 layer and apply a graduated symbology using the pop2020 field.
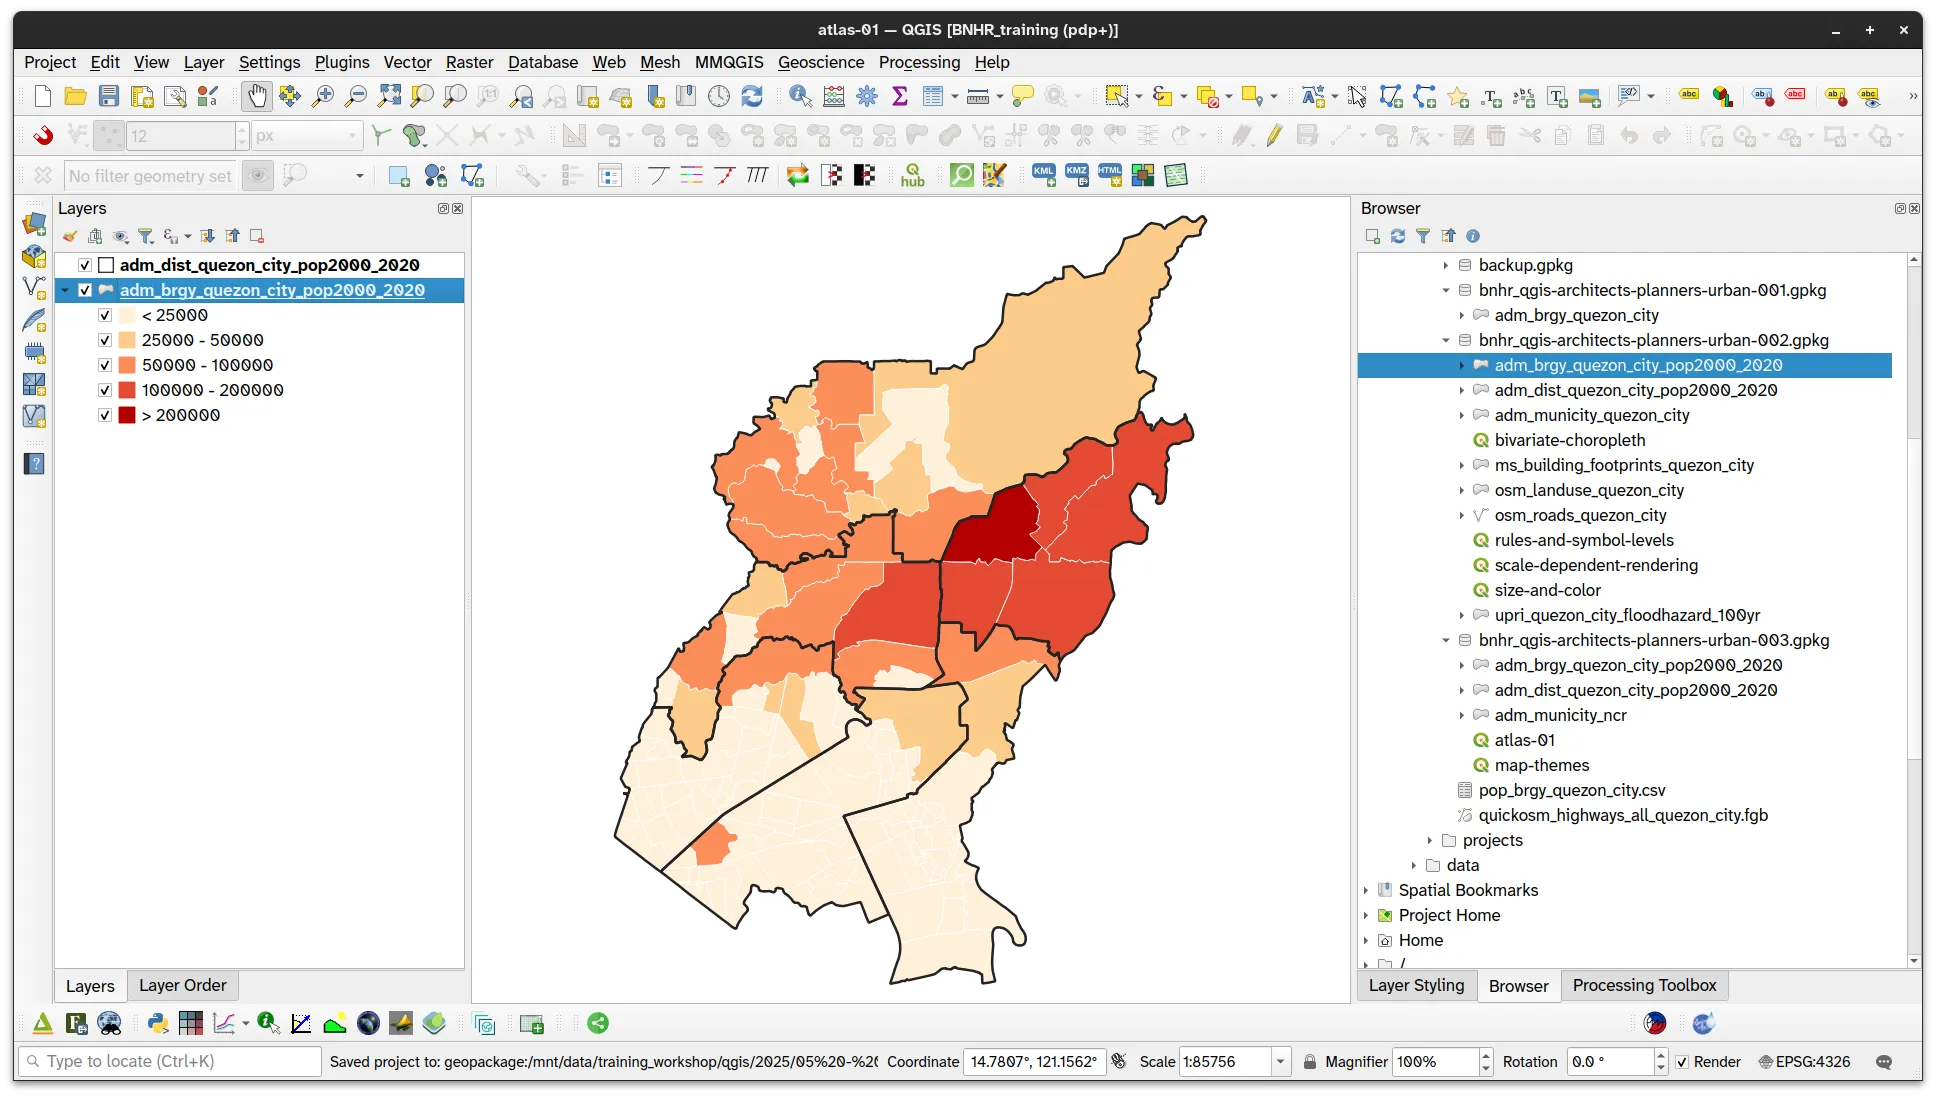
- Load the adm_dist_quezon_city_pop2000_2020 layer. No need to style this layer right now. You will use this layer as your coverage layer.
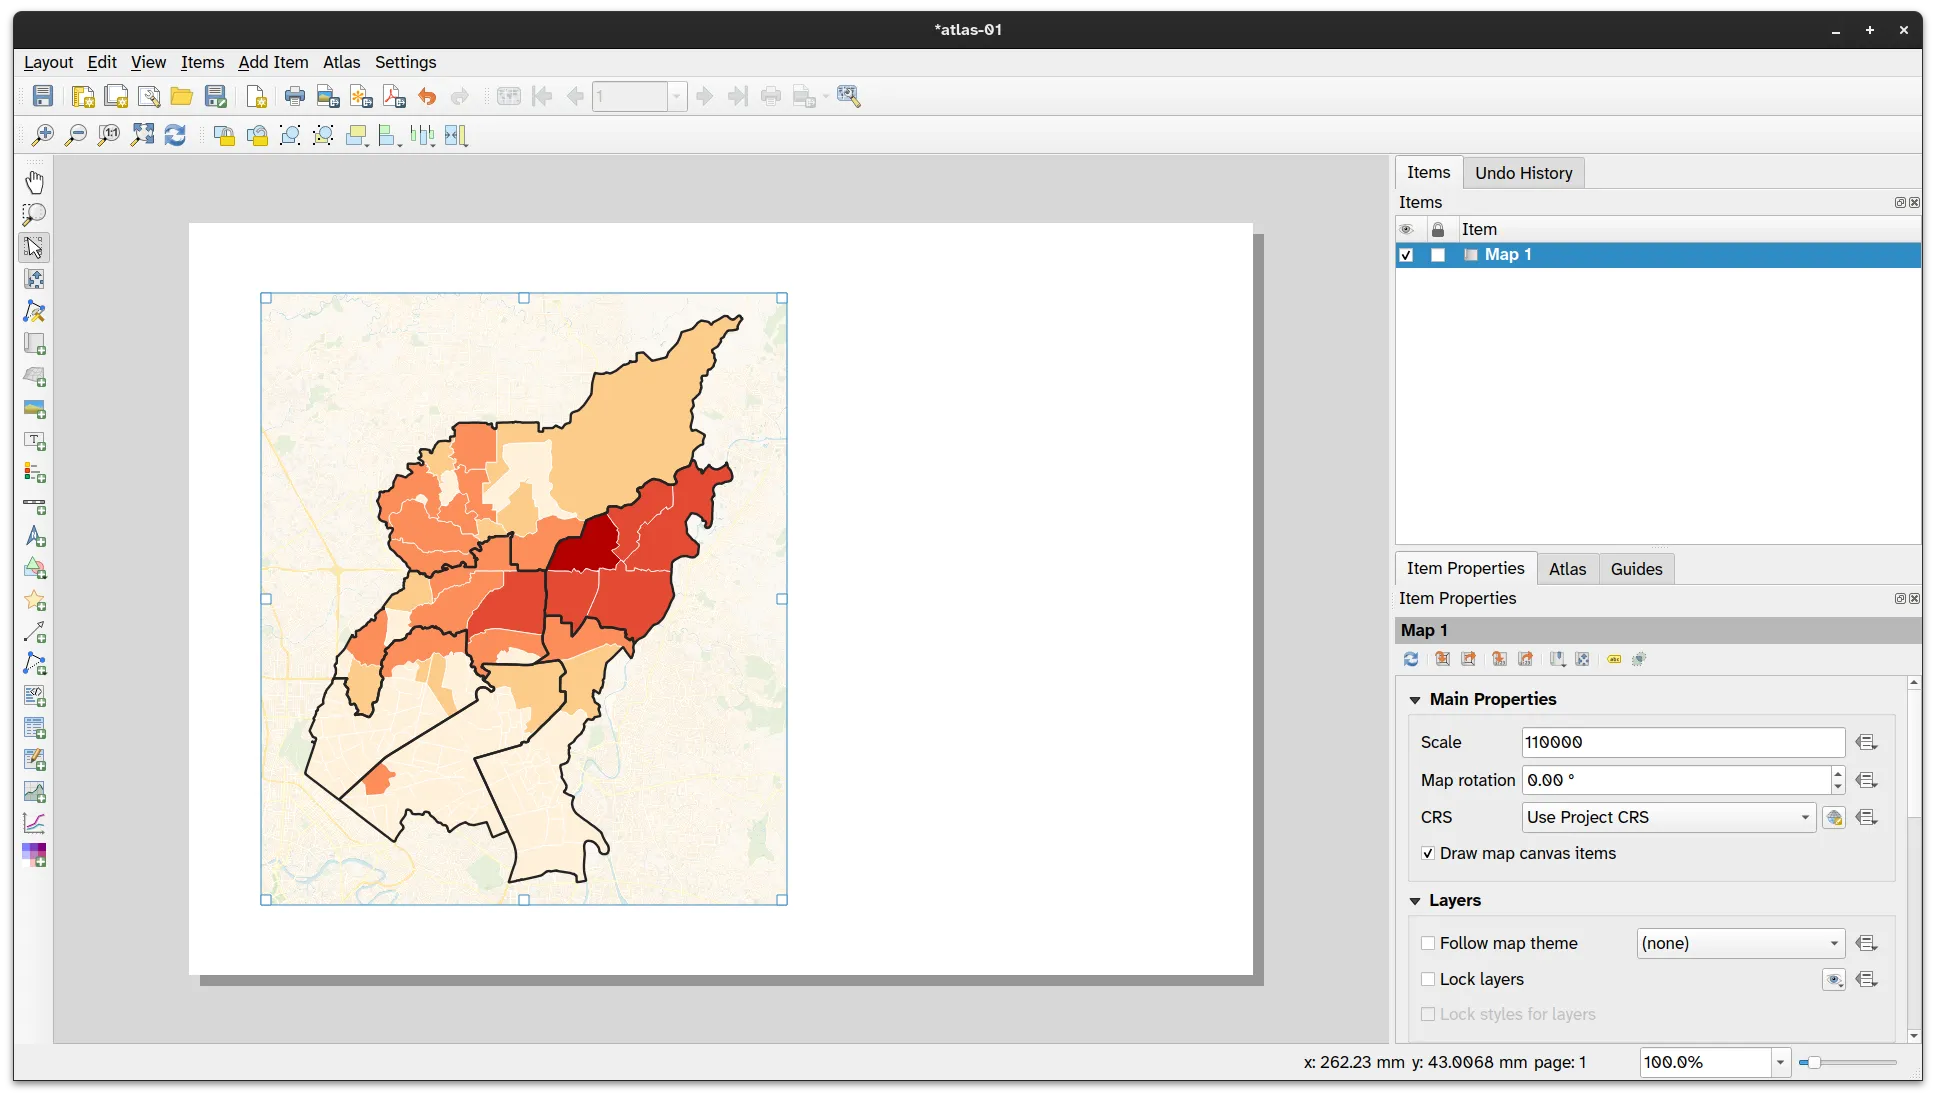
- Create a new Print Layout and add a map.
-
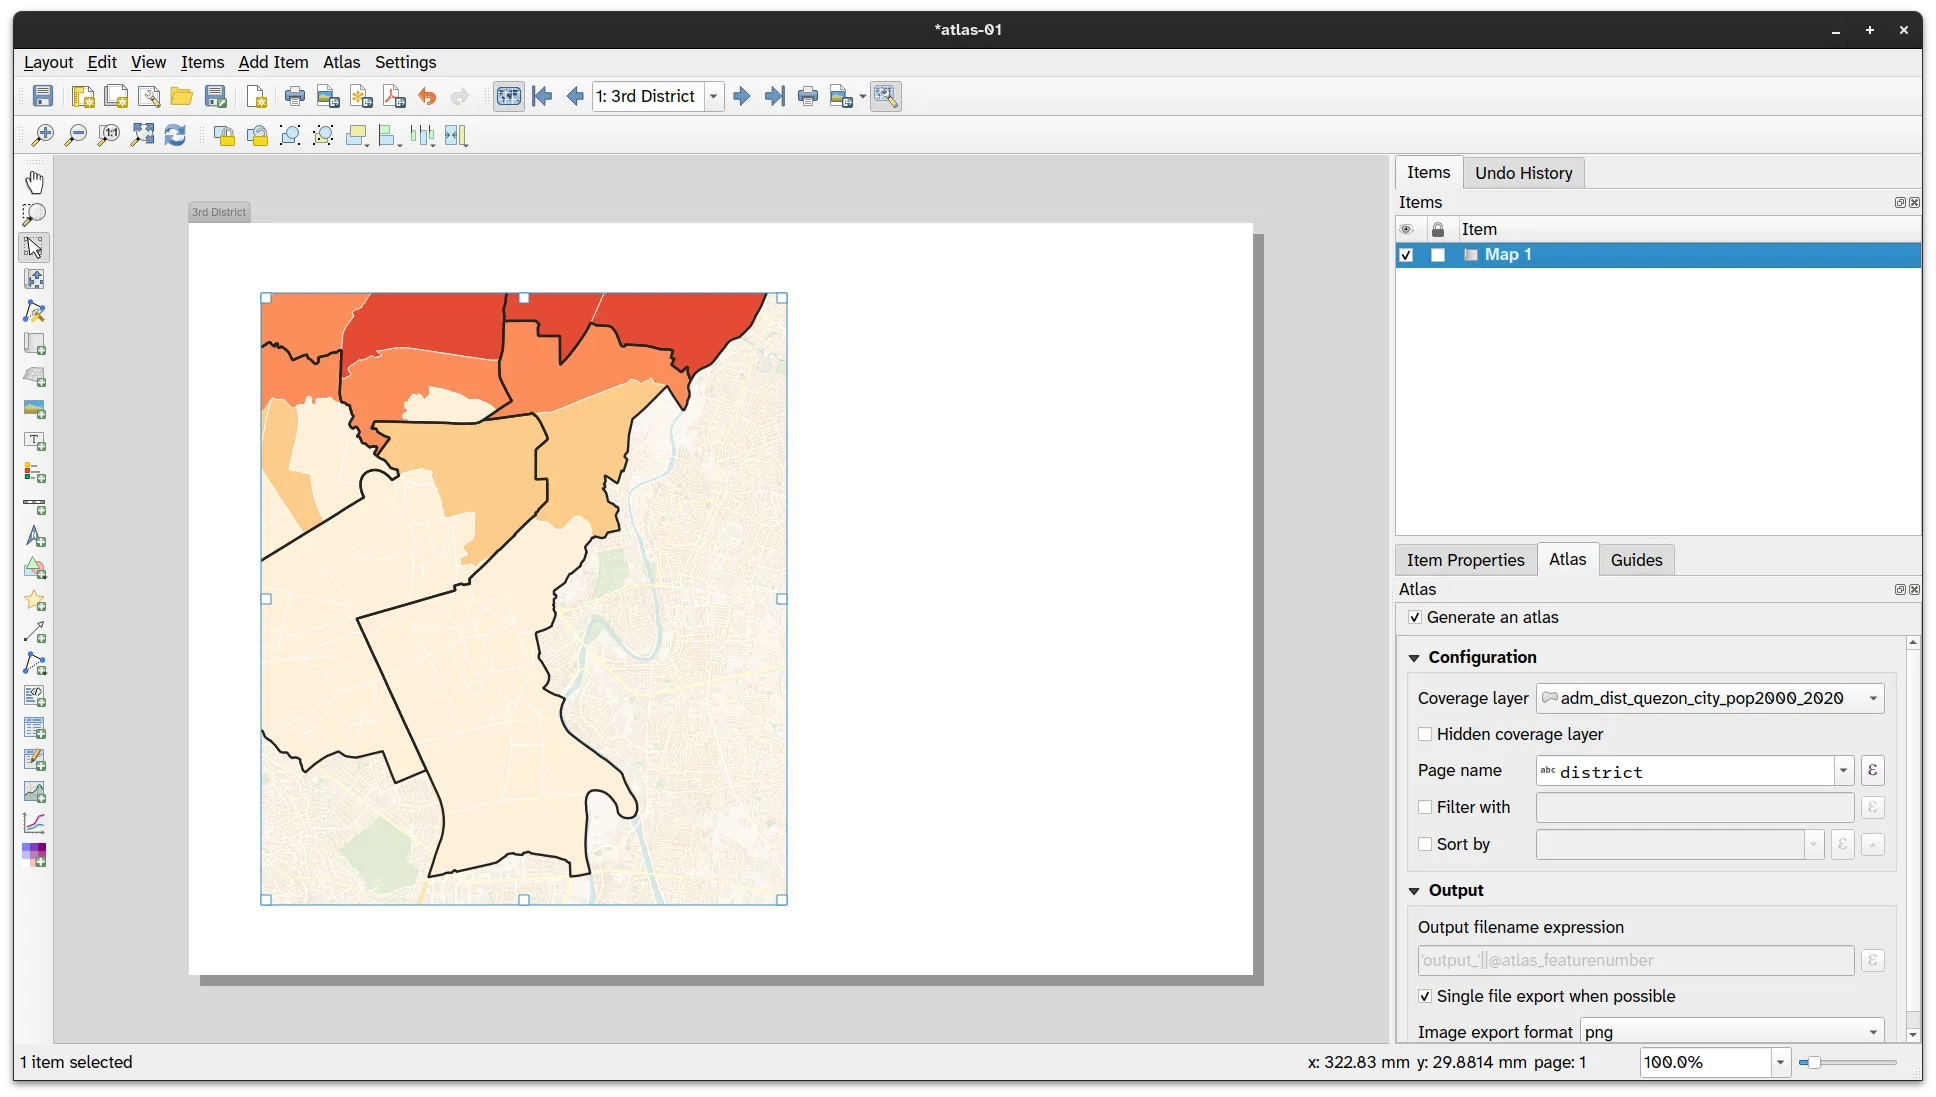
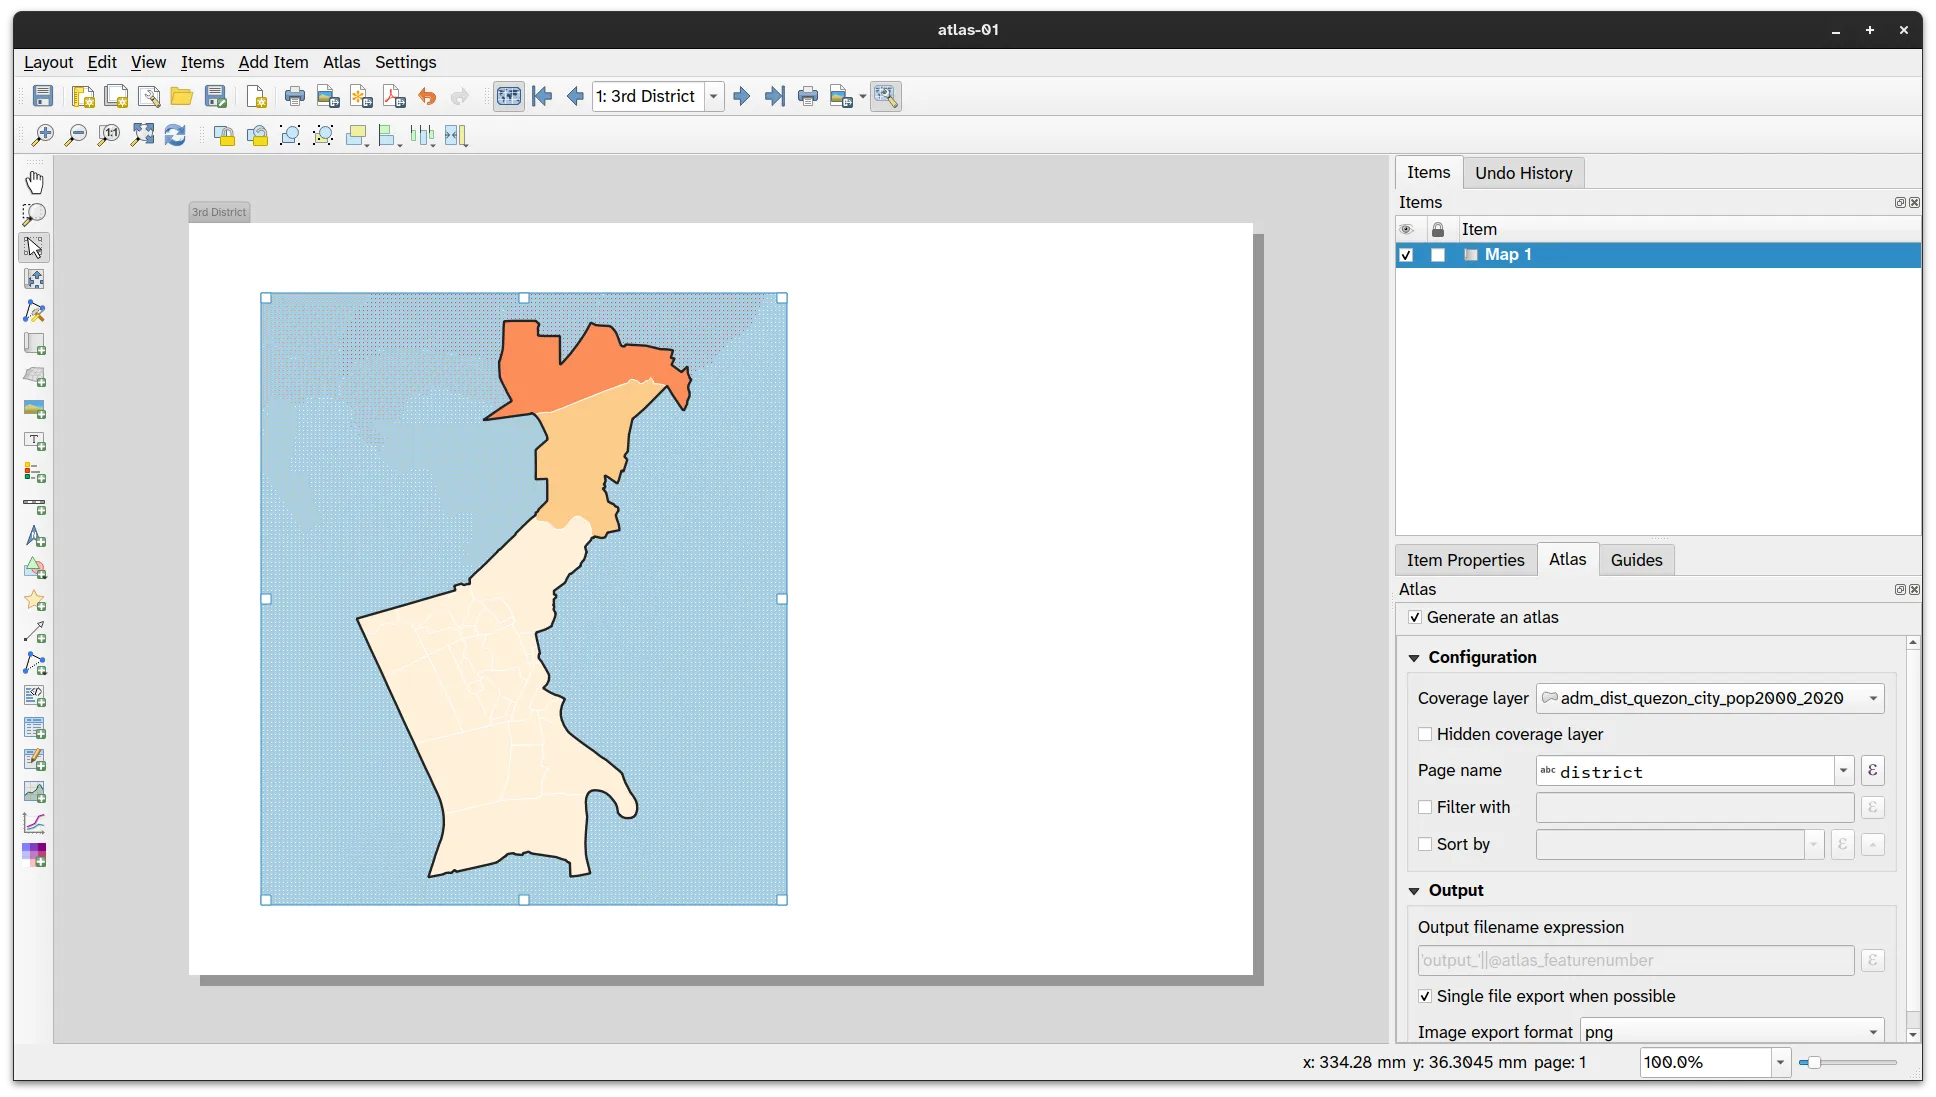
Let’s configure your Atlas. Click the Configure Atlas button
 on the top toolbar to open the Atlas Settings.
 -
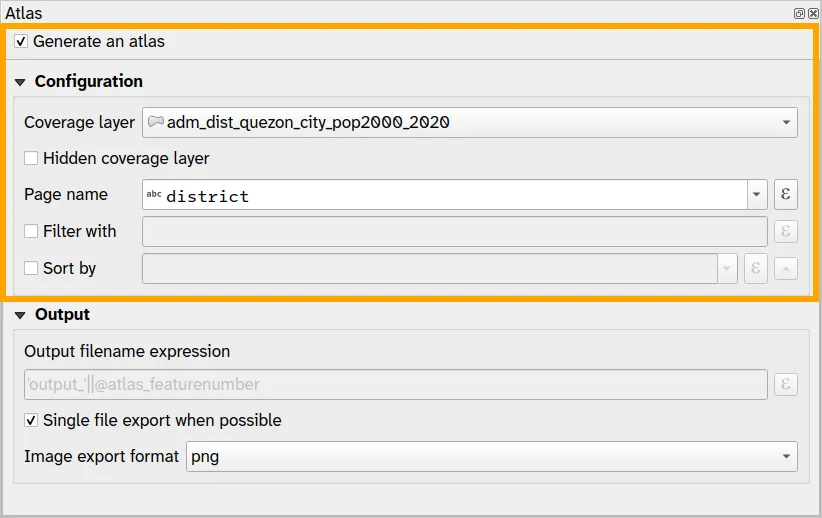
Check Generate an atlas and apply the following parameters:
- Configuration
- Coverage layer: adm_dist_quezon_city_pop2000_2020
- Page name: region
- Configuration
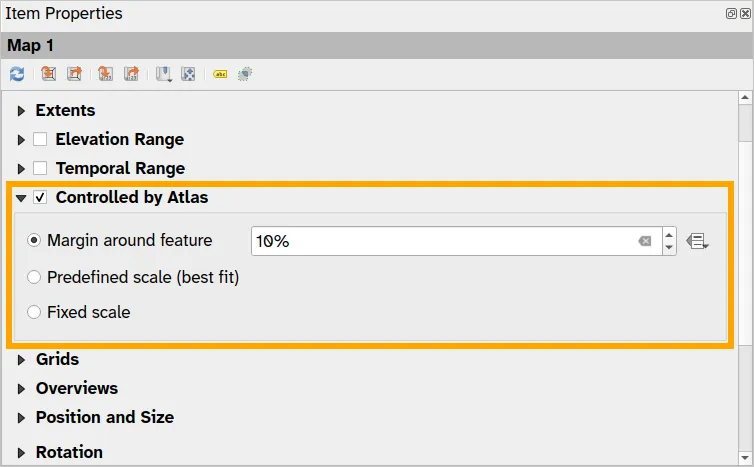
- Modify the Item Properties of the Map and check Controlled by Atlas.
- Click the Atlas button (
 ) on the top toolbar to preview your atlas.

- The Atlas Toolbar shown below allows you to see the different maps in your atlas. Try to click the arrow buttons and see what happens to the map.
![]()
Showing only the current district
Section titled “Showing only the current district”Although your atlas does what it’s supposed to—which is to generate a map for each district automatically—it doesn’t look that appealing. What you can do is to utilize some techniques to improve the map.
Option 1: Styling the districts layer
Section titled “Option 1: Styling the districts layer”- Using this approach, you can apply a style to the districts layer such that when it is the feature being used by the atlas, it will cover all other features outside of itself. In essence, this just means that you will apply an Inverted Polygon symbology to the current atlas feature.
- This can easily be done by combining rule-based symbology, inverted polygon symbology, and expressions.
- Apply the following styles to the adm_dist_quezon_city_pop2000_2020 layer: Inverted Polygons with a Rule-based Sub renderer.
- Create a rule to get the current atlas feature by using this expression:
$id = @atlas_featureid
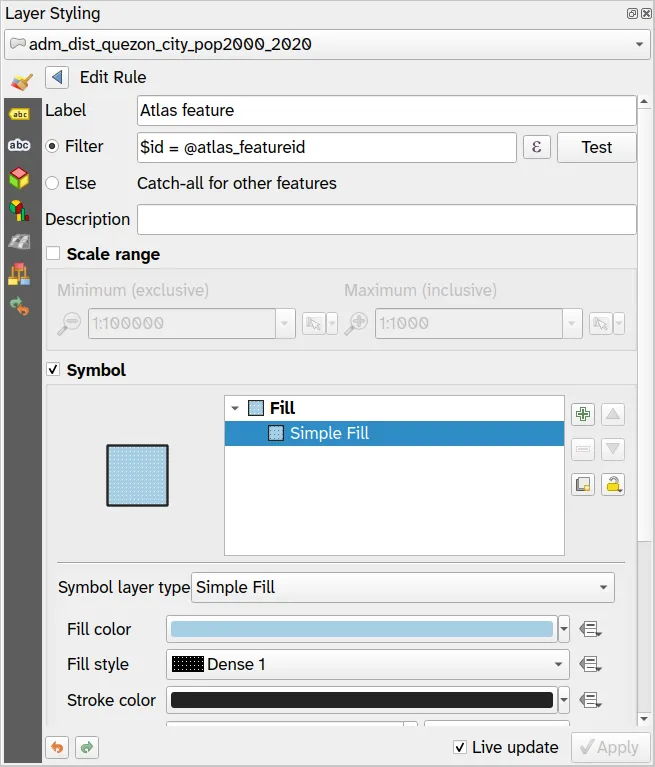
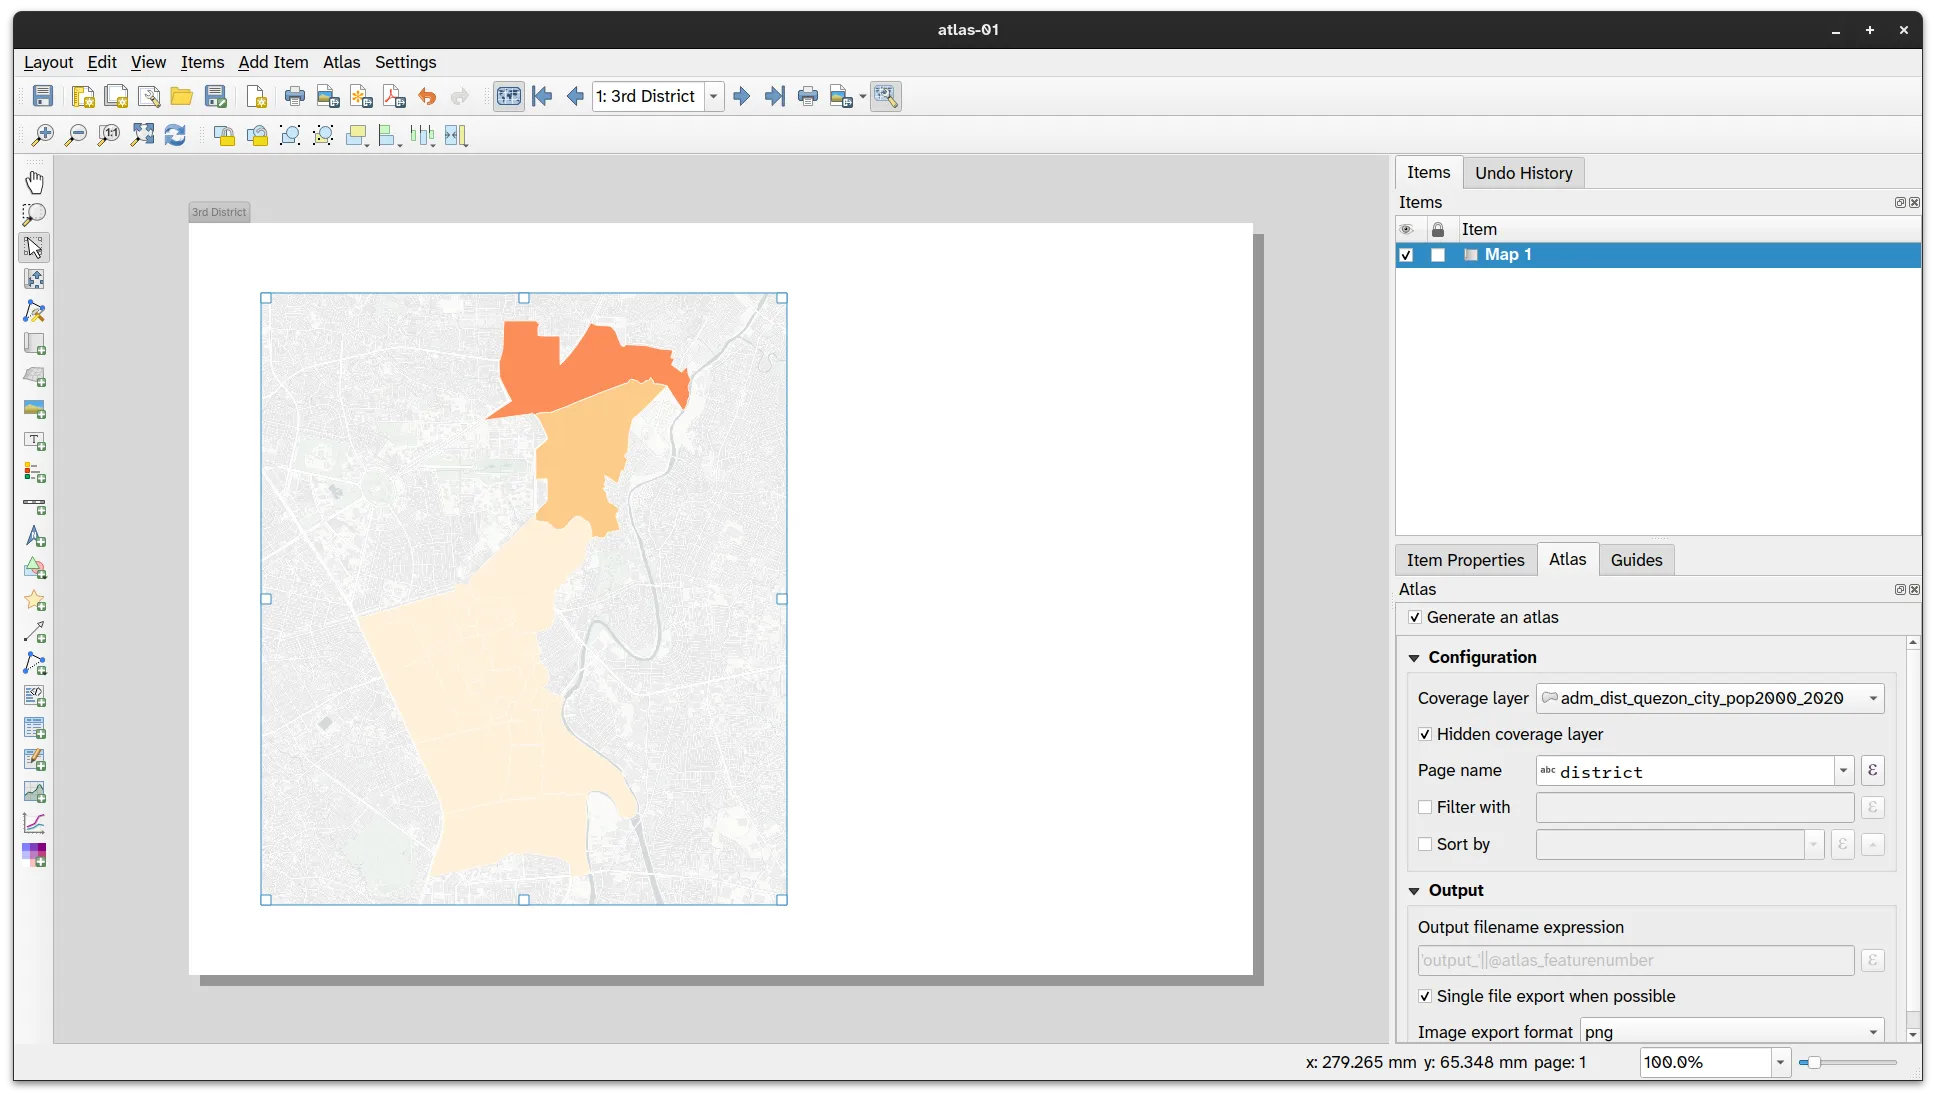
- As long as the adm_dist_quezon_city_pop2000_2020 layer is rendered above the adm_brgy_quezon_city_pop2000_2020 layer, then you should see a map canvas similar to the one below.
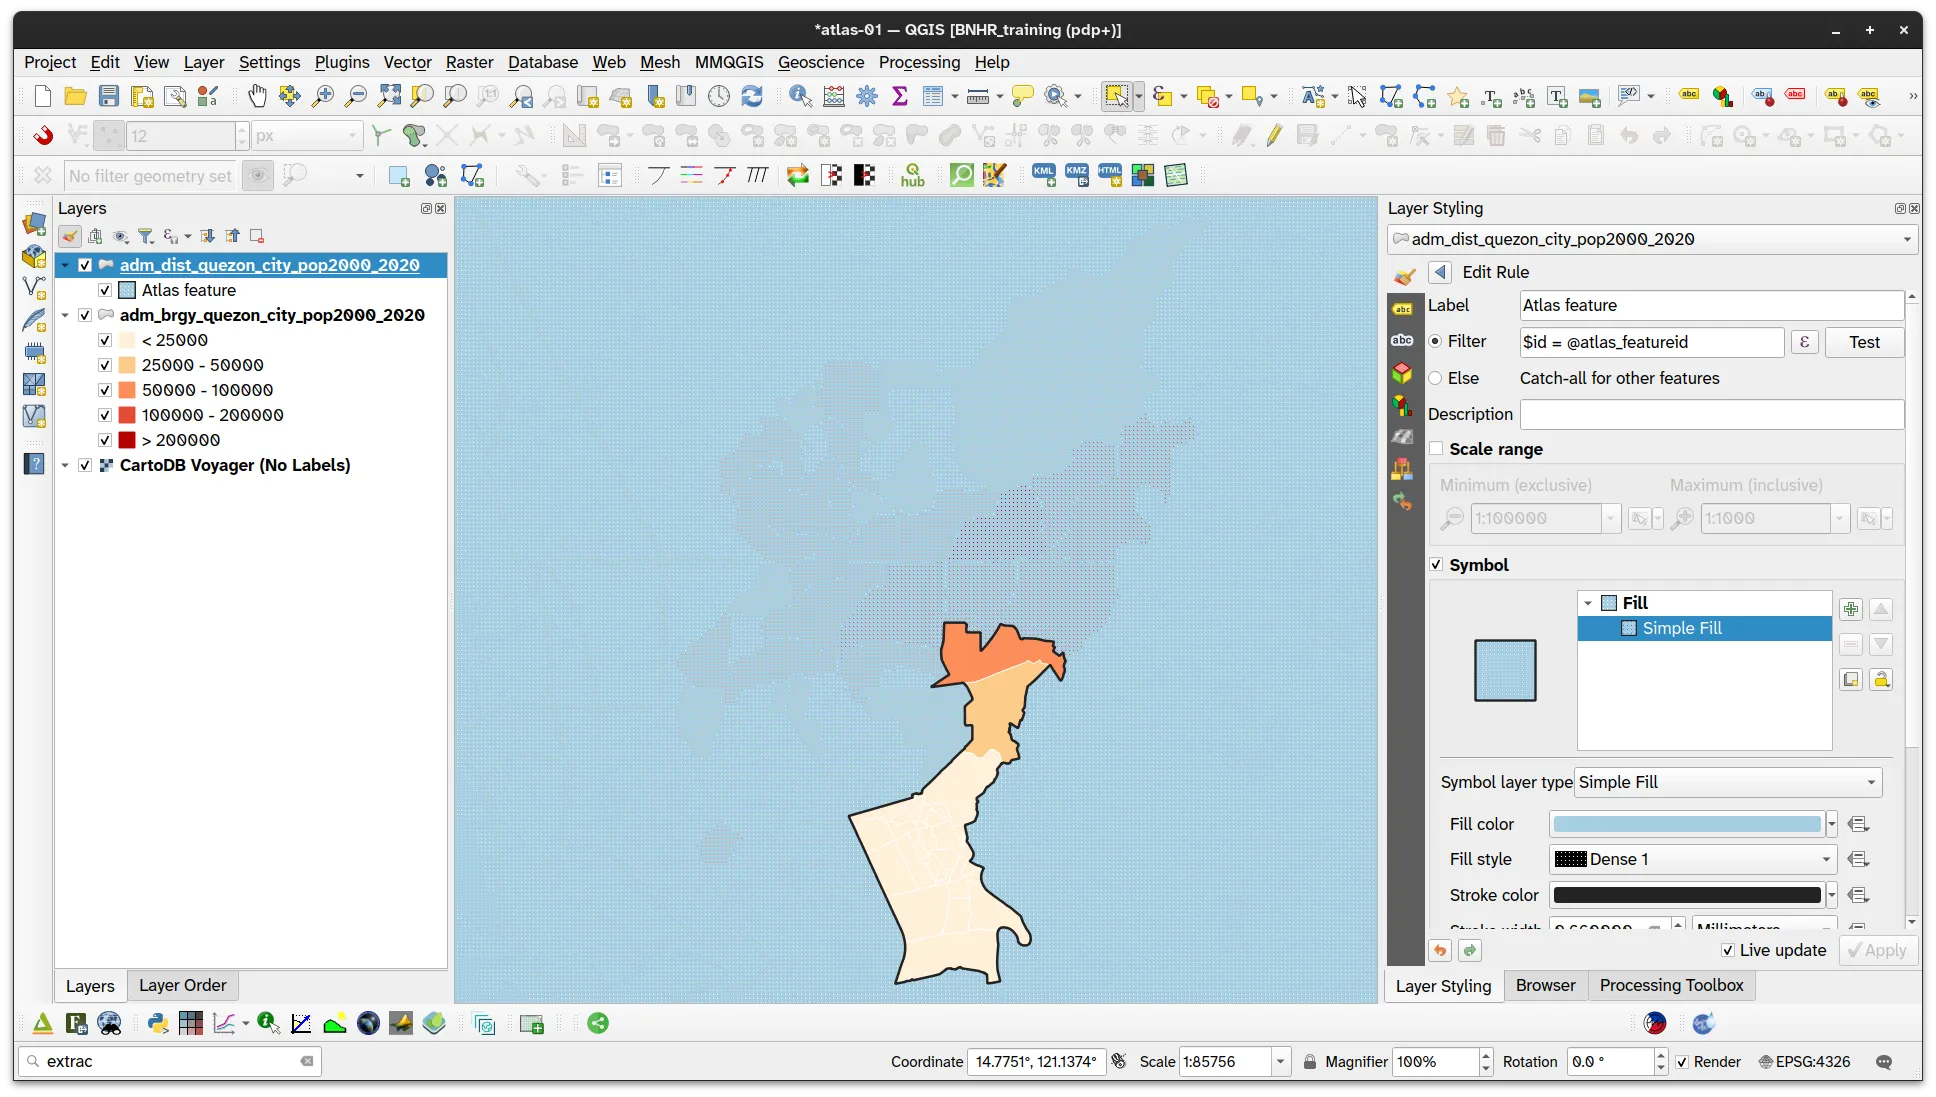
- This also reflects on the Print Layout and you should see something similar in the Atlas you created.
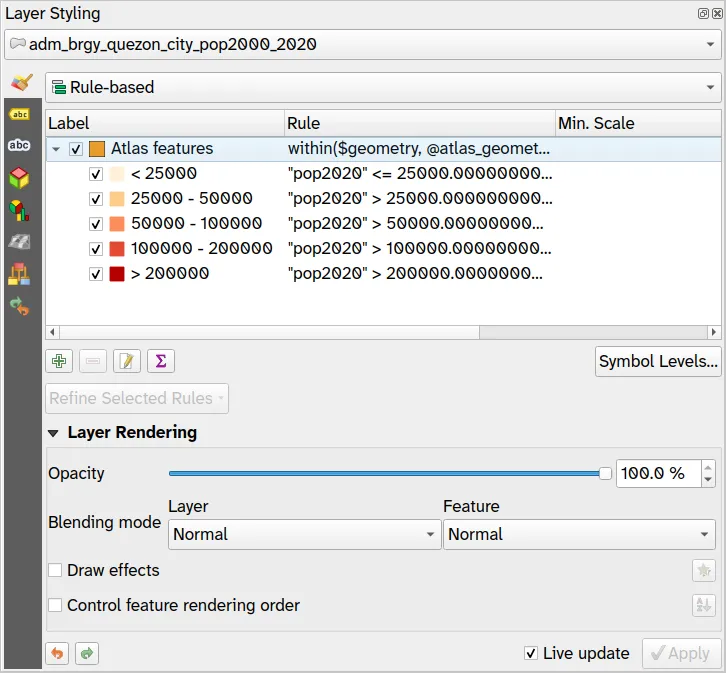
Option 2: Using expressions to filter the brgy layer
Section titled “Option 2: Using expressions to filter the brgy layer”The second option is to apply the same kind of filter directly to the adm_brgy_quezon_city_pop2000_2020 layer. In this case, you can use an expression that checks if a barangay is inside of a district and if yes, it will style the barangay. If not, it will not apply any styles (e.g. make it not visible).
This can be done by using a refined/nested rule-based symbology where the topmost rule checks whether or not a province is within a region (spatially) and the sub-rules apply the symbology.
- Apply the following style to the adm_brgy_quezon_city_pop2000_2020 layer.
- The topmost rule uses the following expression:
within($geometry, @atlas_geometry)
- Your map canvas should look like below:
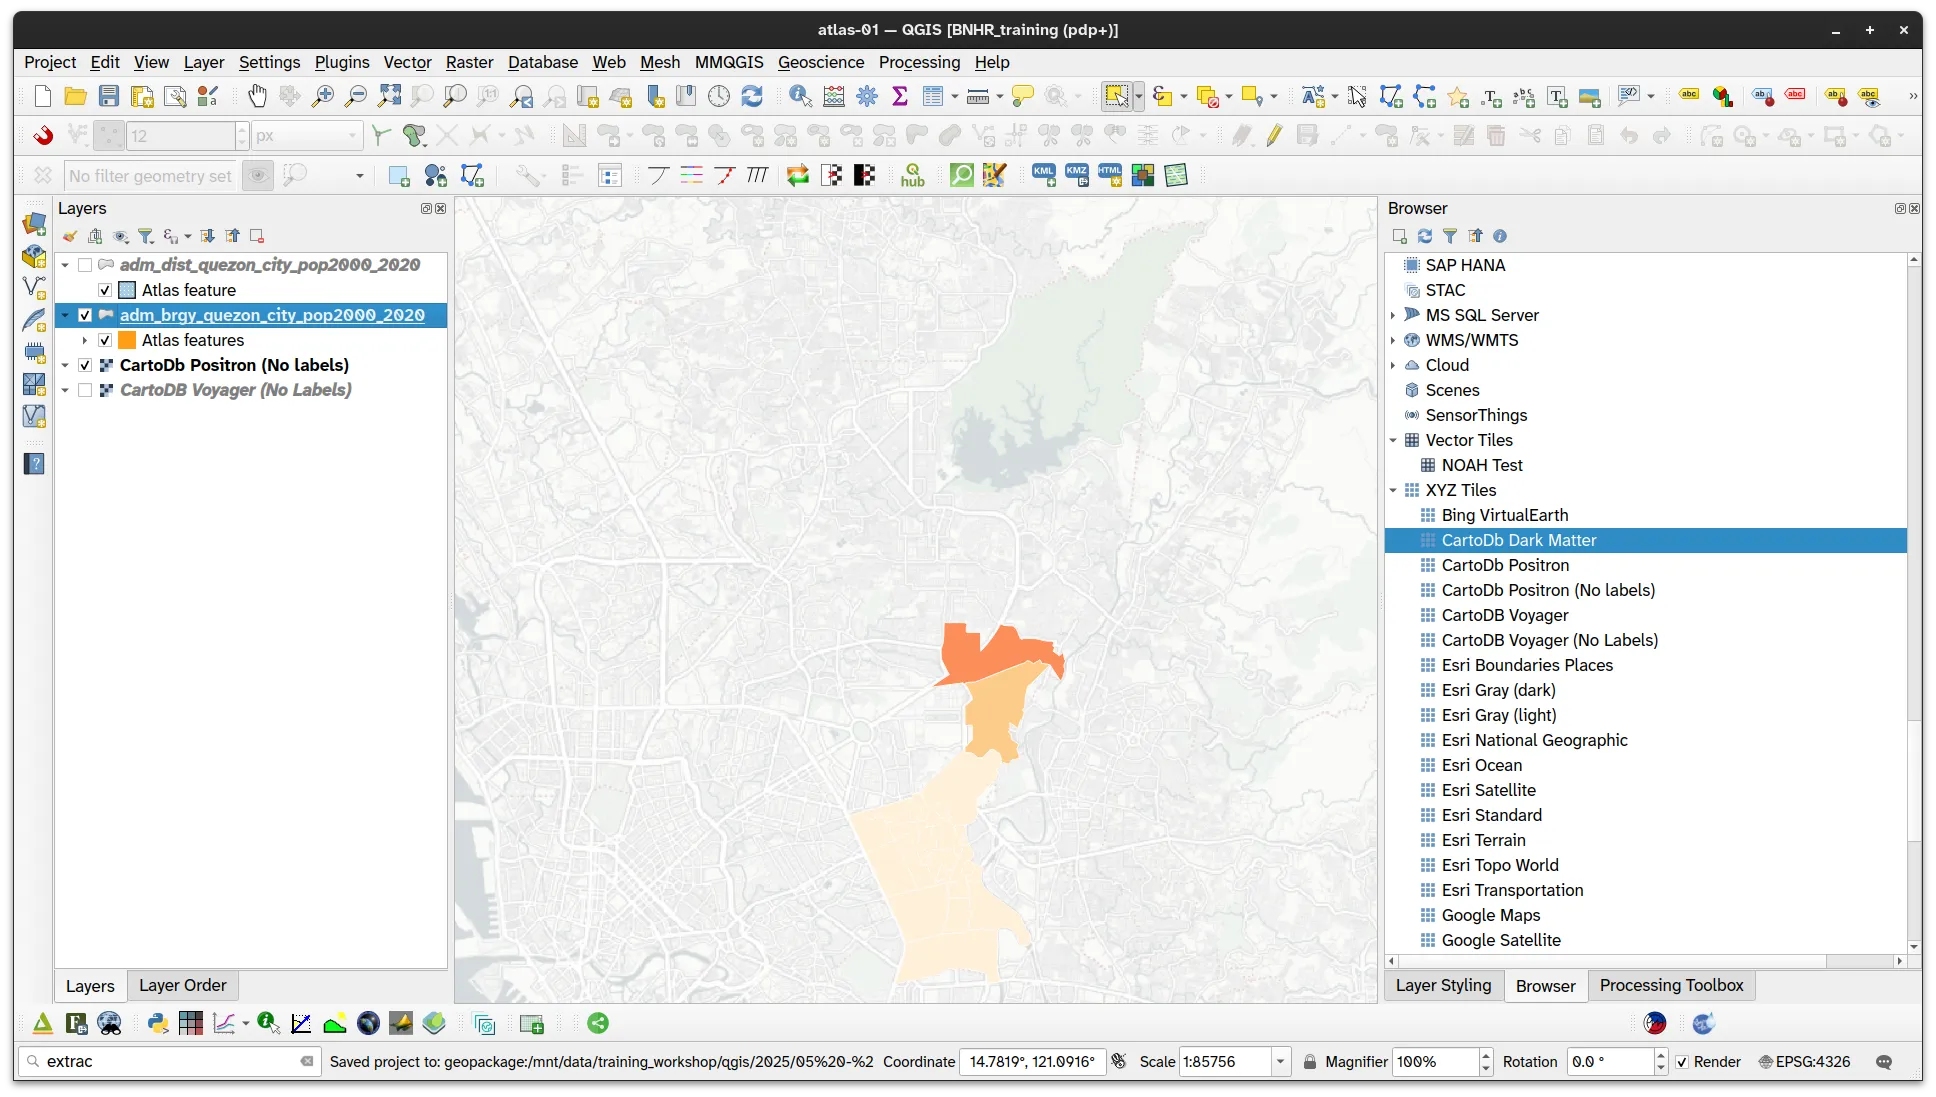
- Similar to the first option, this also reflects in the Atlas or Print Layout.
You can select which approach you like better.
In the next section, you will be adding more data-defined elements to your Atlas such as a texts, legends, and tables that change depending on the current atlas feature being mapped.
Data-defined elements
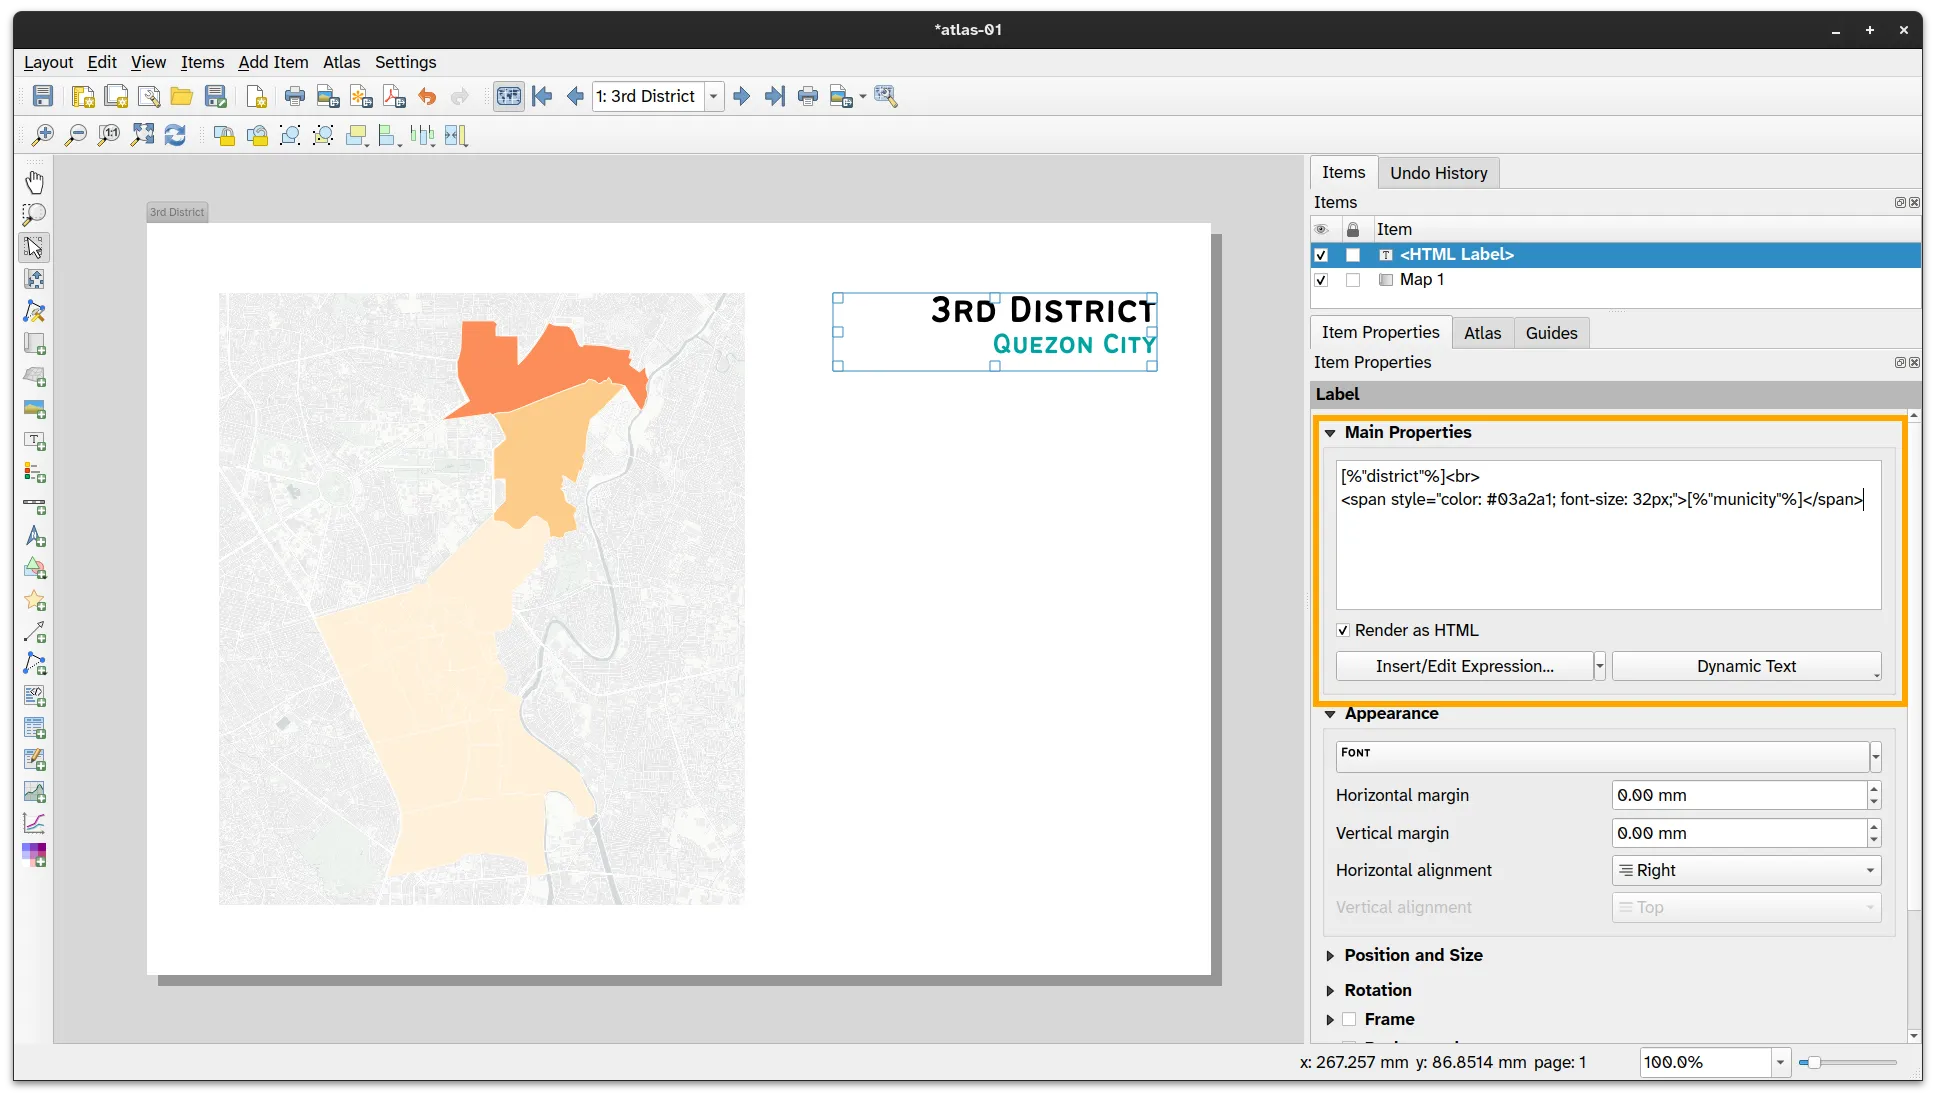
Section titled “Data-defined elements”Data-defined title
Section titled “Data-defined title”- Add a data-defined label to your map that shows the name of the district.
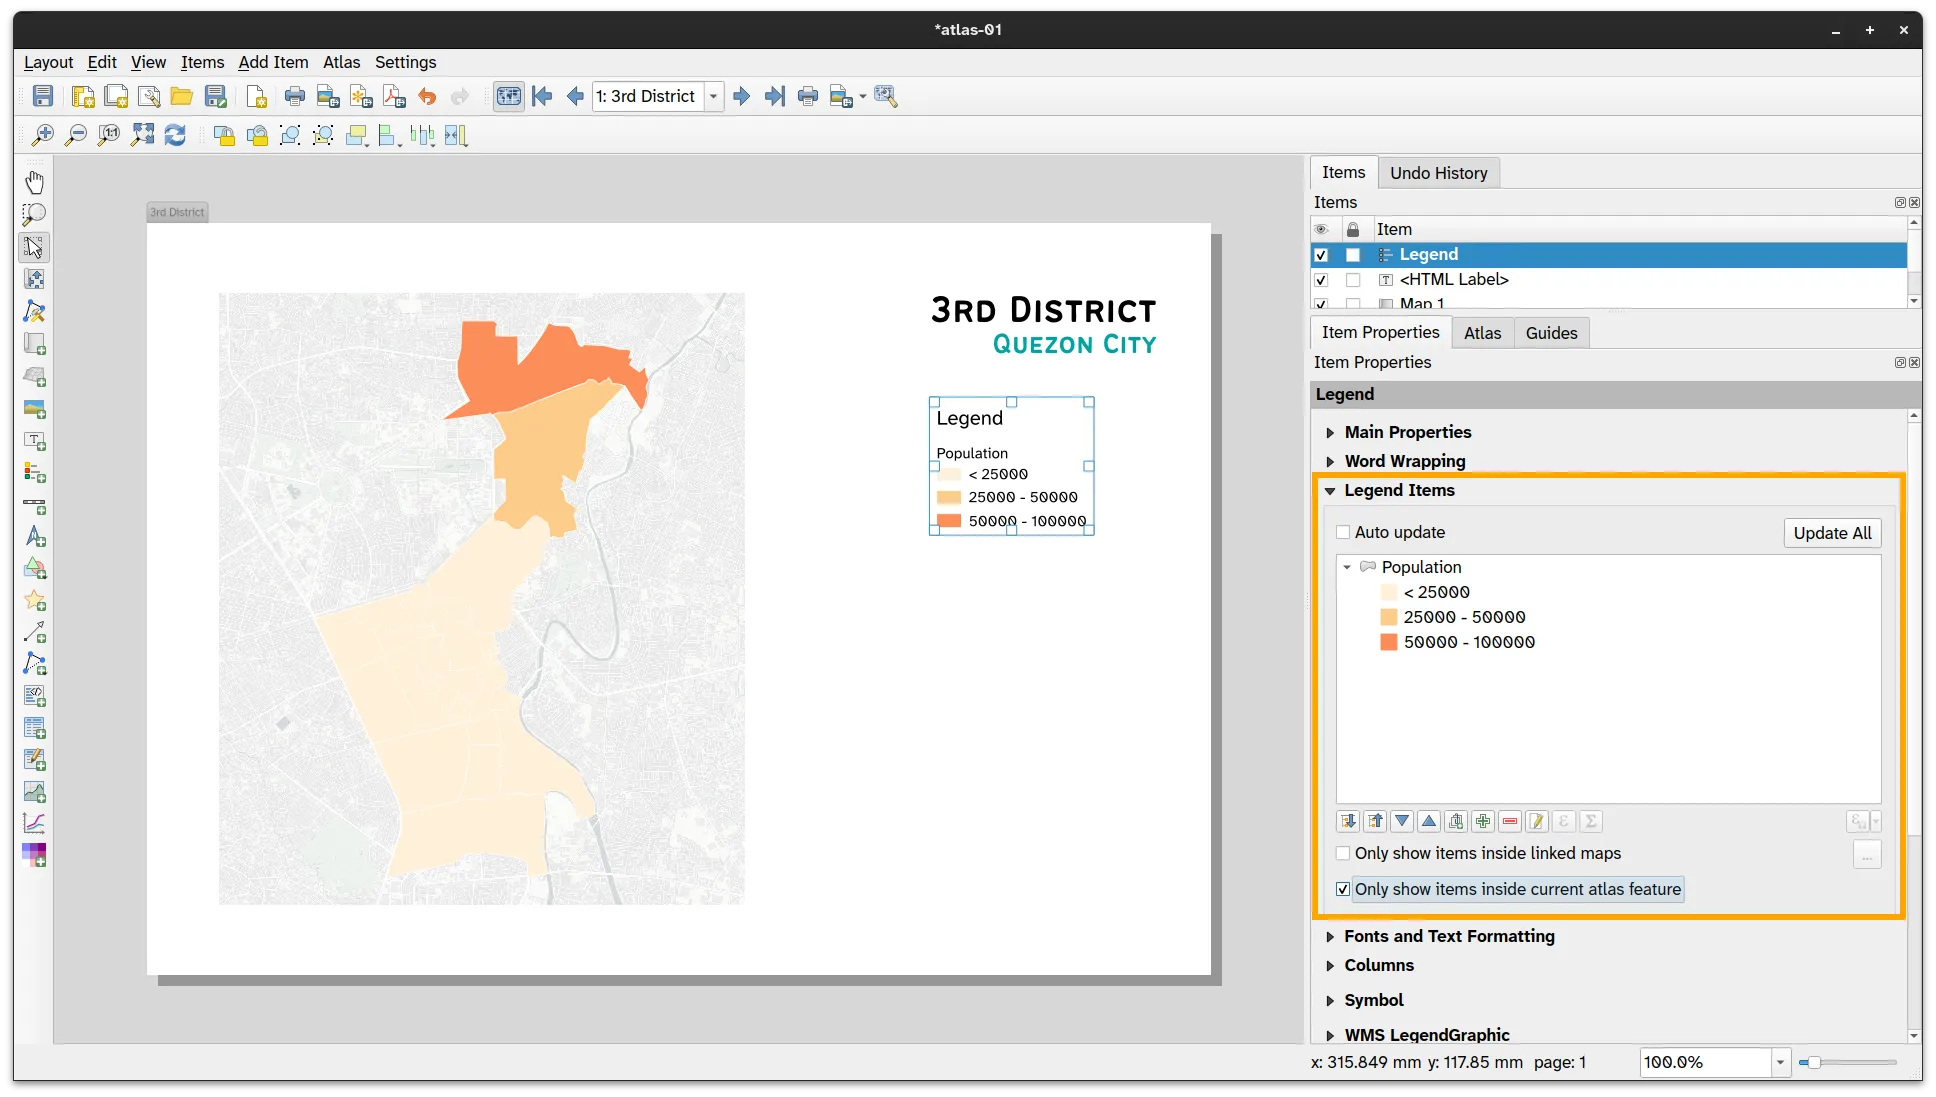
Atlas-defined legend
Section titled “Atlas-defined legend”- Add a legend to the map. You can make this legend only show the items inside the current atlas feature.
Adding a table that shows only the barangays in the district
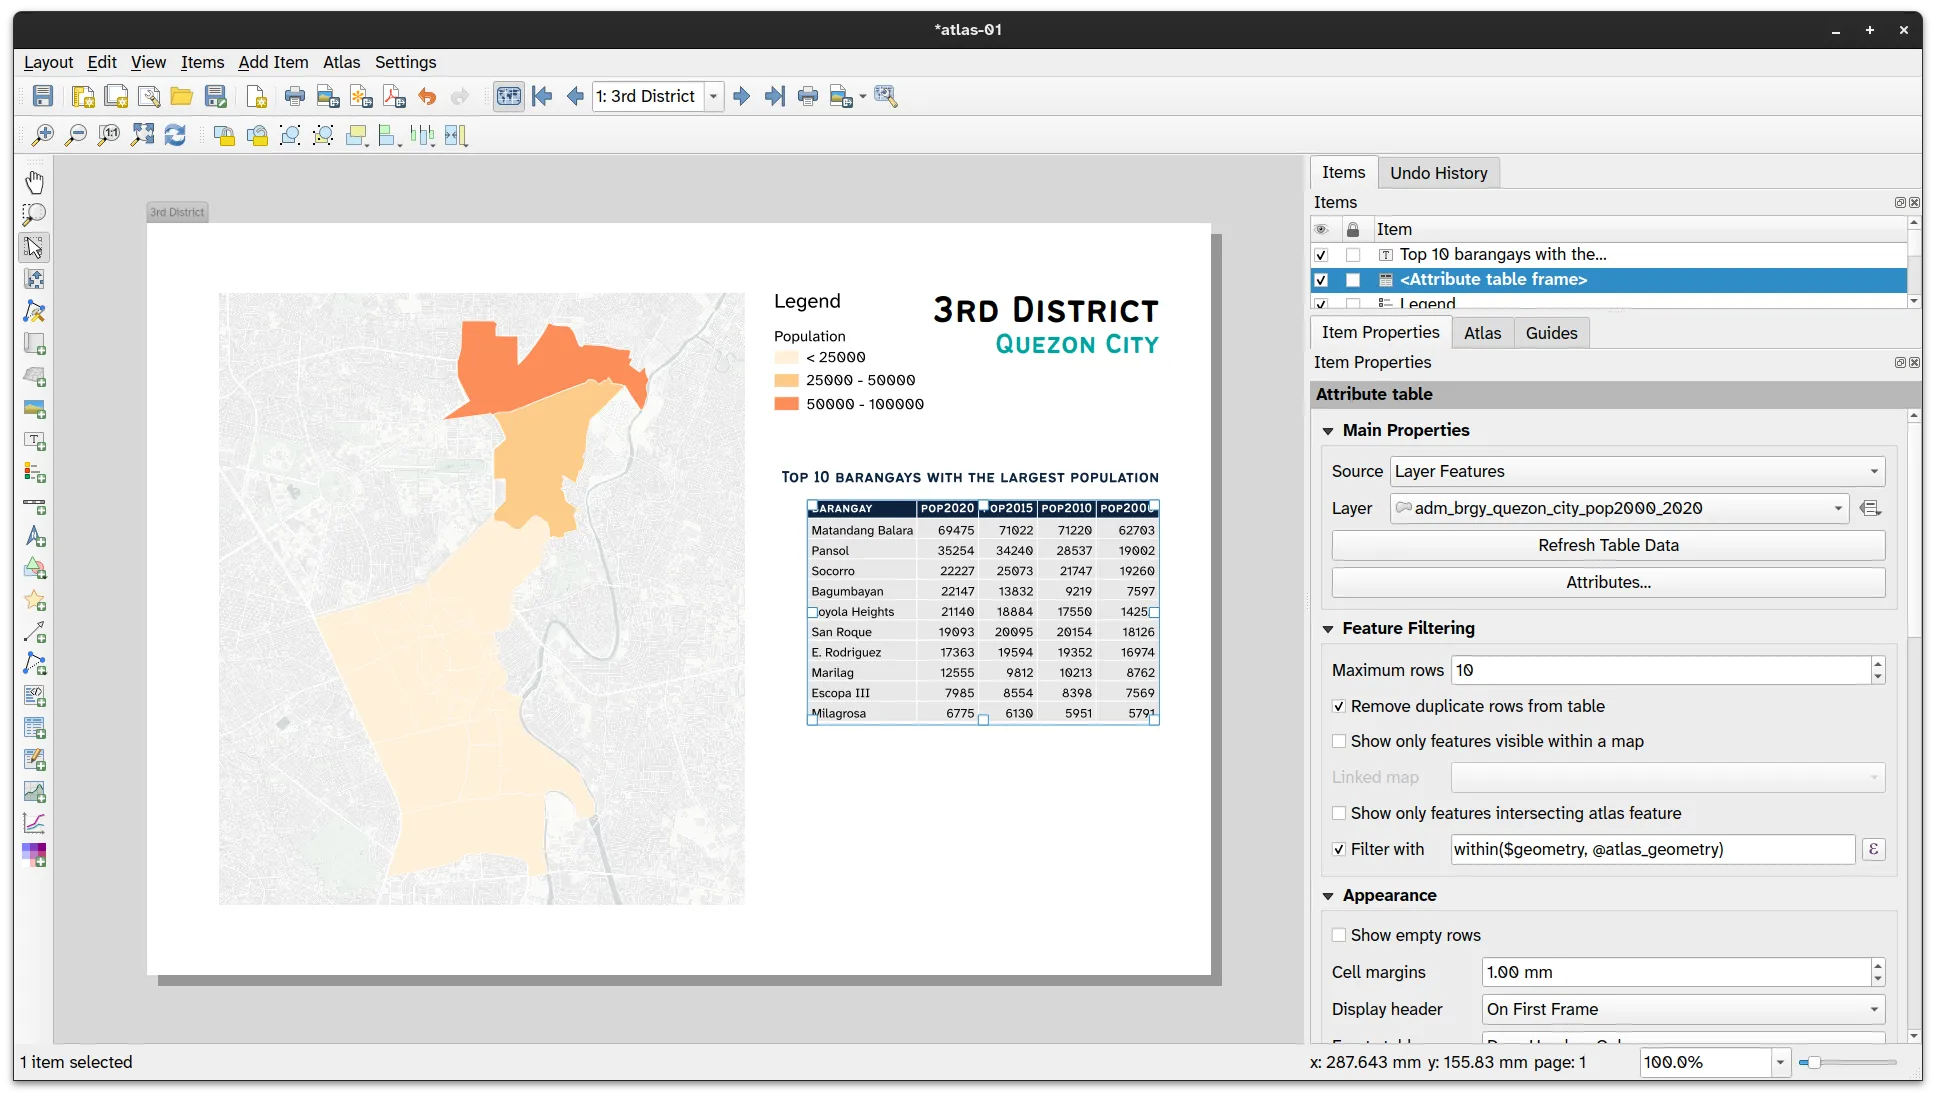
Section titled “Adding a table that shows only the barangays in the district”You can use the same expression you used to filter the barangays inside the district to make a table that only shows those barangays.
- Add a table to the map and define the table using the following columns.
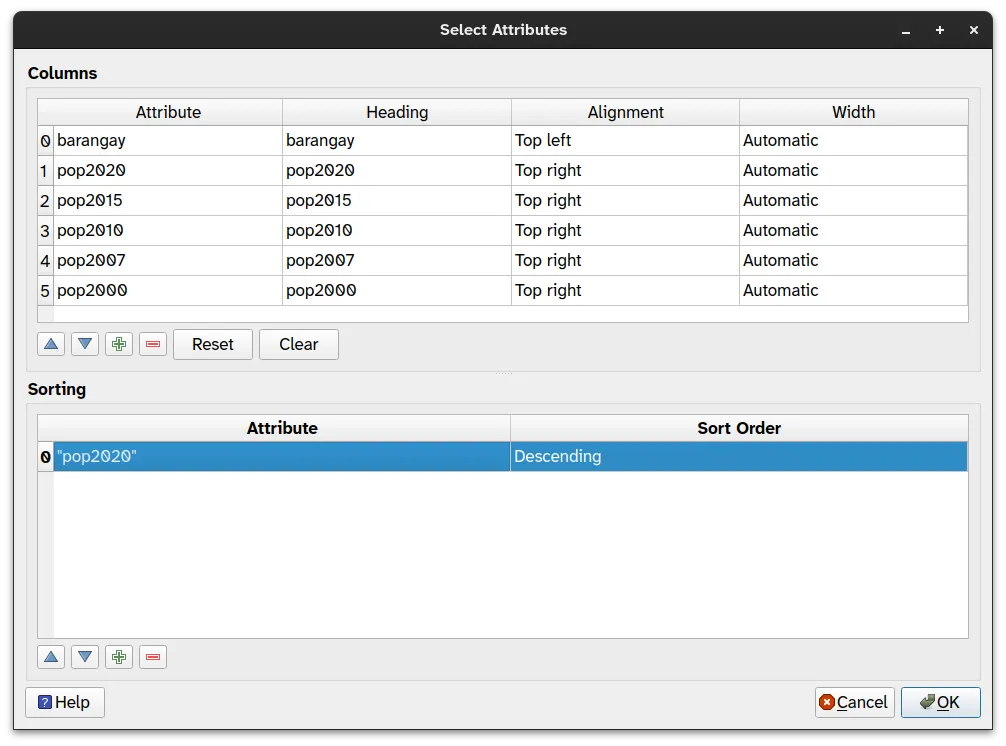
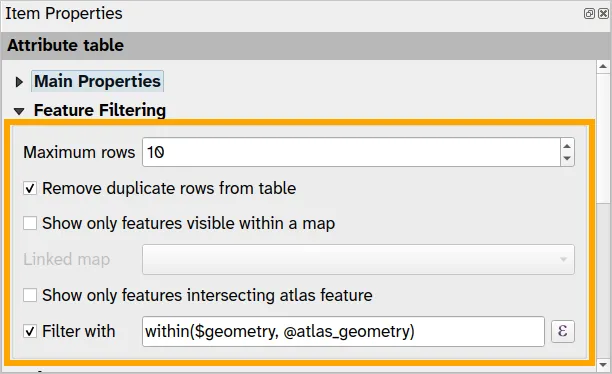
- Under Feature Filtering:
- Set Maximum rows to 10
- Check Remove duplicate rows from table
- Check Filter with and use the following expression:
within($geometry, @atlas_geometry)
- You can also define the reference/anchor point of the table to control how it will change size.
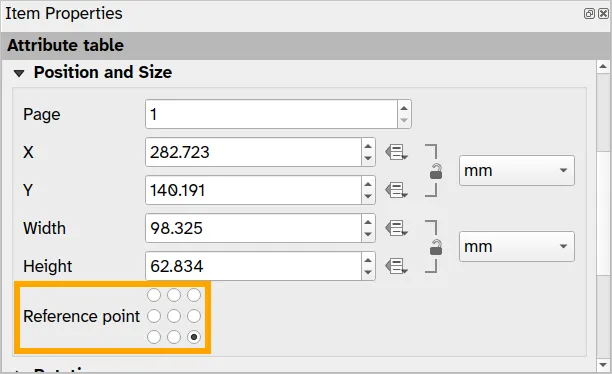
- Feel free to edit the look and feel of your table.
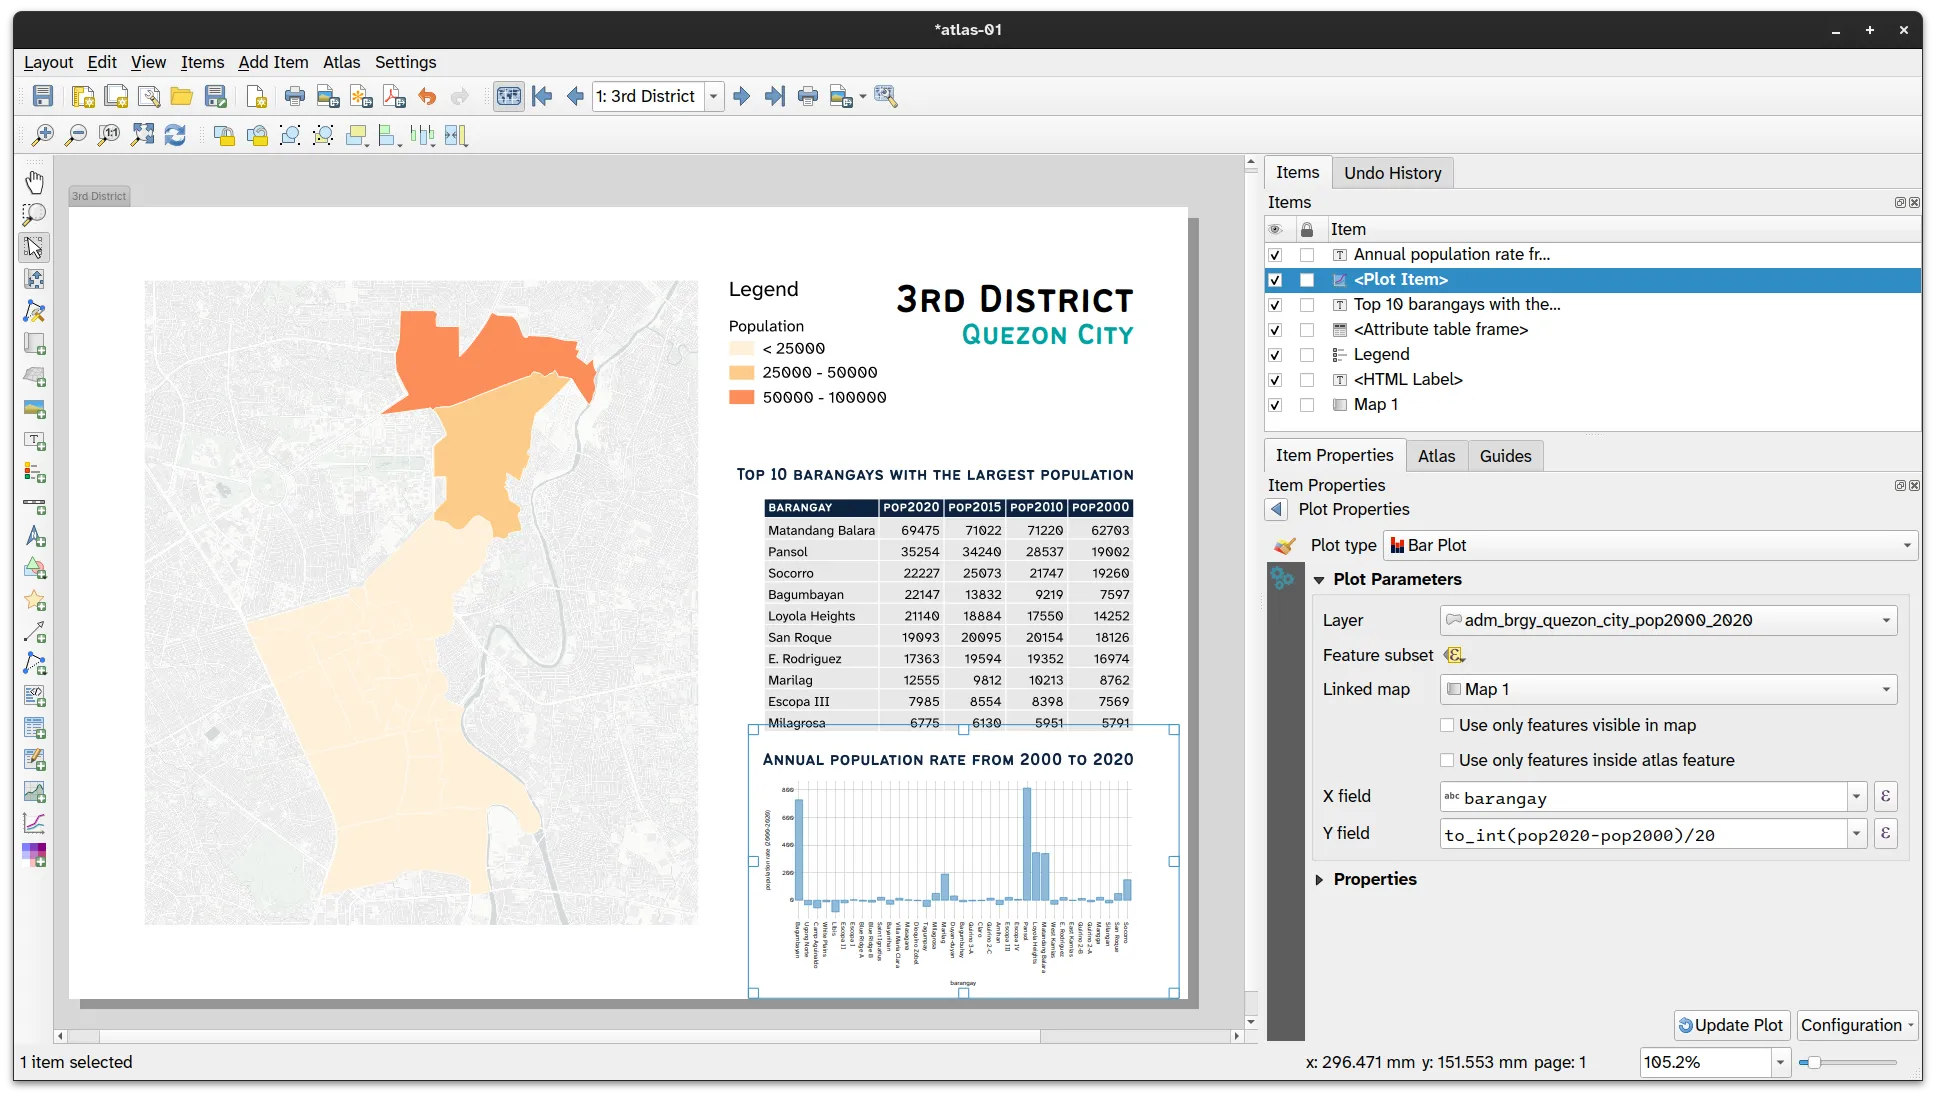
Adding a data-defined plot/graph
Section titled “Adding a data-defined plot/graph”Similarly, you can use the same expression to filter the plots you add to your map.
-
Create the same bar plot you did in one of the previous exercises.
-
Under Feature subset use the following expression:
within($geometry, @atlas_geometry)
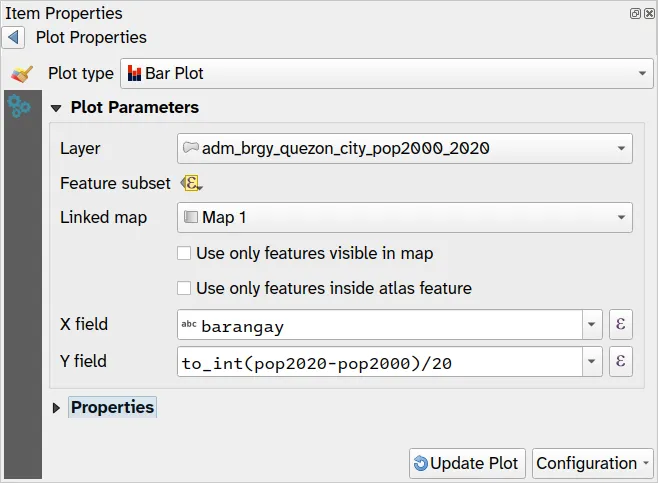
- The plot should change values depending on the current atlas feature being mapped.
Completing and exporting your map
Section titled “Completing and exporting your map”
-
You can add other map items/elements and configure them as you like—e.g. scalebar, north arrow, etc.
-
Once you’re happy with your Atlas, you can Export your atlas as images by clicking
 . Depending on how you configured your atlas, this may result in a single image or multiple images (1 per map).
Atlas that iterates over the same area/coverage
Section titled “Atlas that iterates over the same area/coverage”3.2. Mapping flood hazard levels for one district in Quezon City
Section titled “3.2. Mapping flood hazard levels for one district in Quezon City”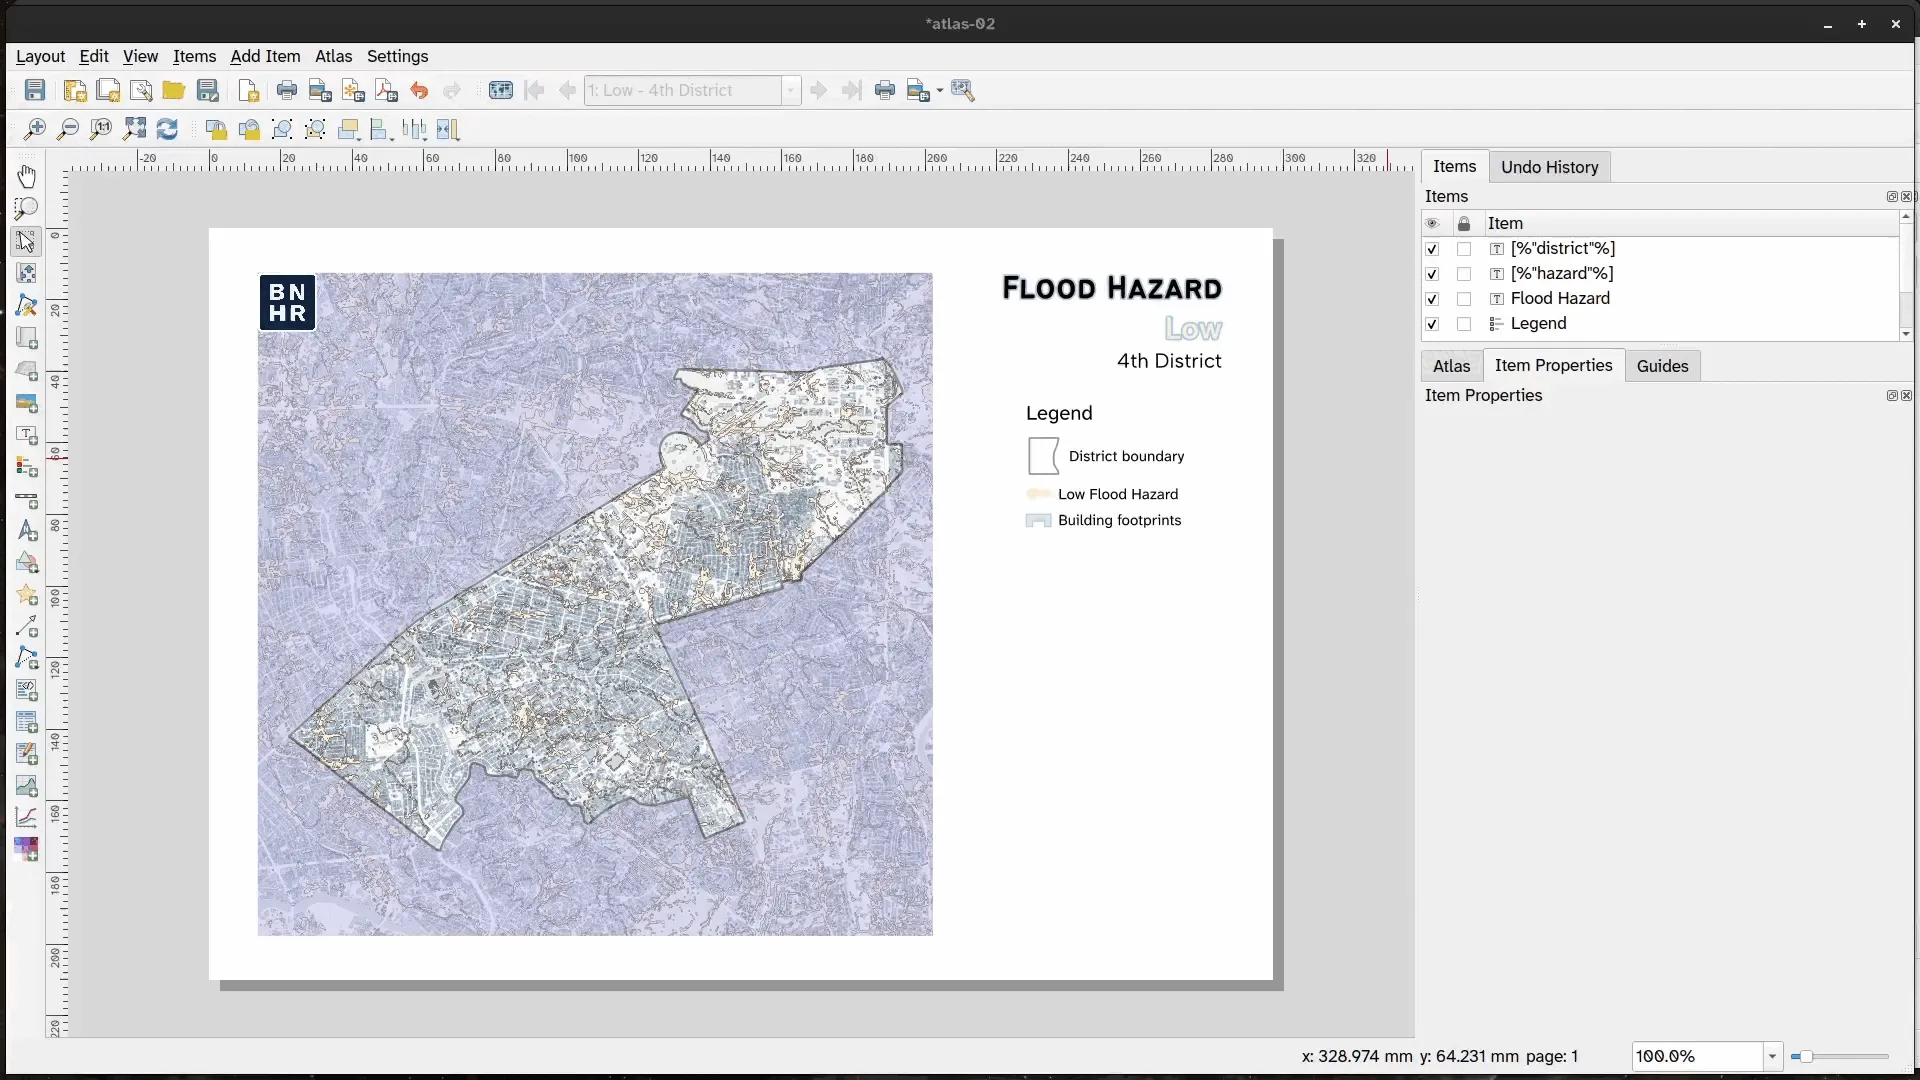
In this exercise, you will utilize an atlas to map the same area but showing different things (e.g. phenomena, attributes, etc.). In this case, you will create four maps of the same QC district showing the (1) low flood hazard, (2) moderate flood hazard, (3) high flood hazard, and (4) all flood hazard areas using an atlas by combining rule-based symbology, expressions, and a creative use of the coverage layer.
To do this, you need:
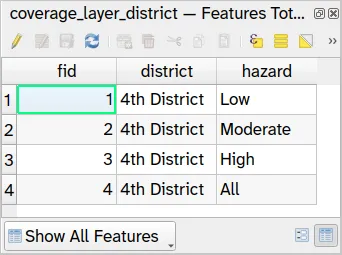
- a coverage layer (coverage_layer_district) that:
- covers the extent of the 2nd District
- has 4 features (1 for each map)
- has a “hazard” attribute/field corresponding to one of the hazard levels being mapped
- Load the coverage_layer_district, upri_quezon_city_floodhazard_100yr, and ms_building_footprints_quezon_city layers and style them accordingly.
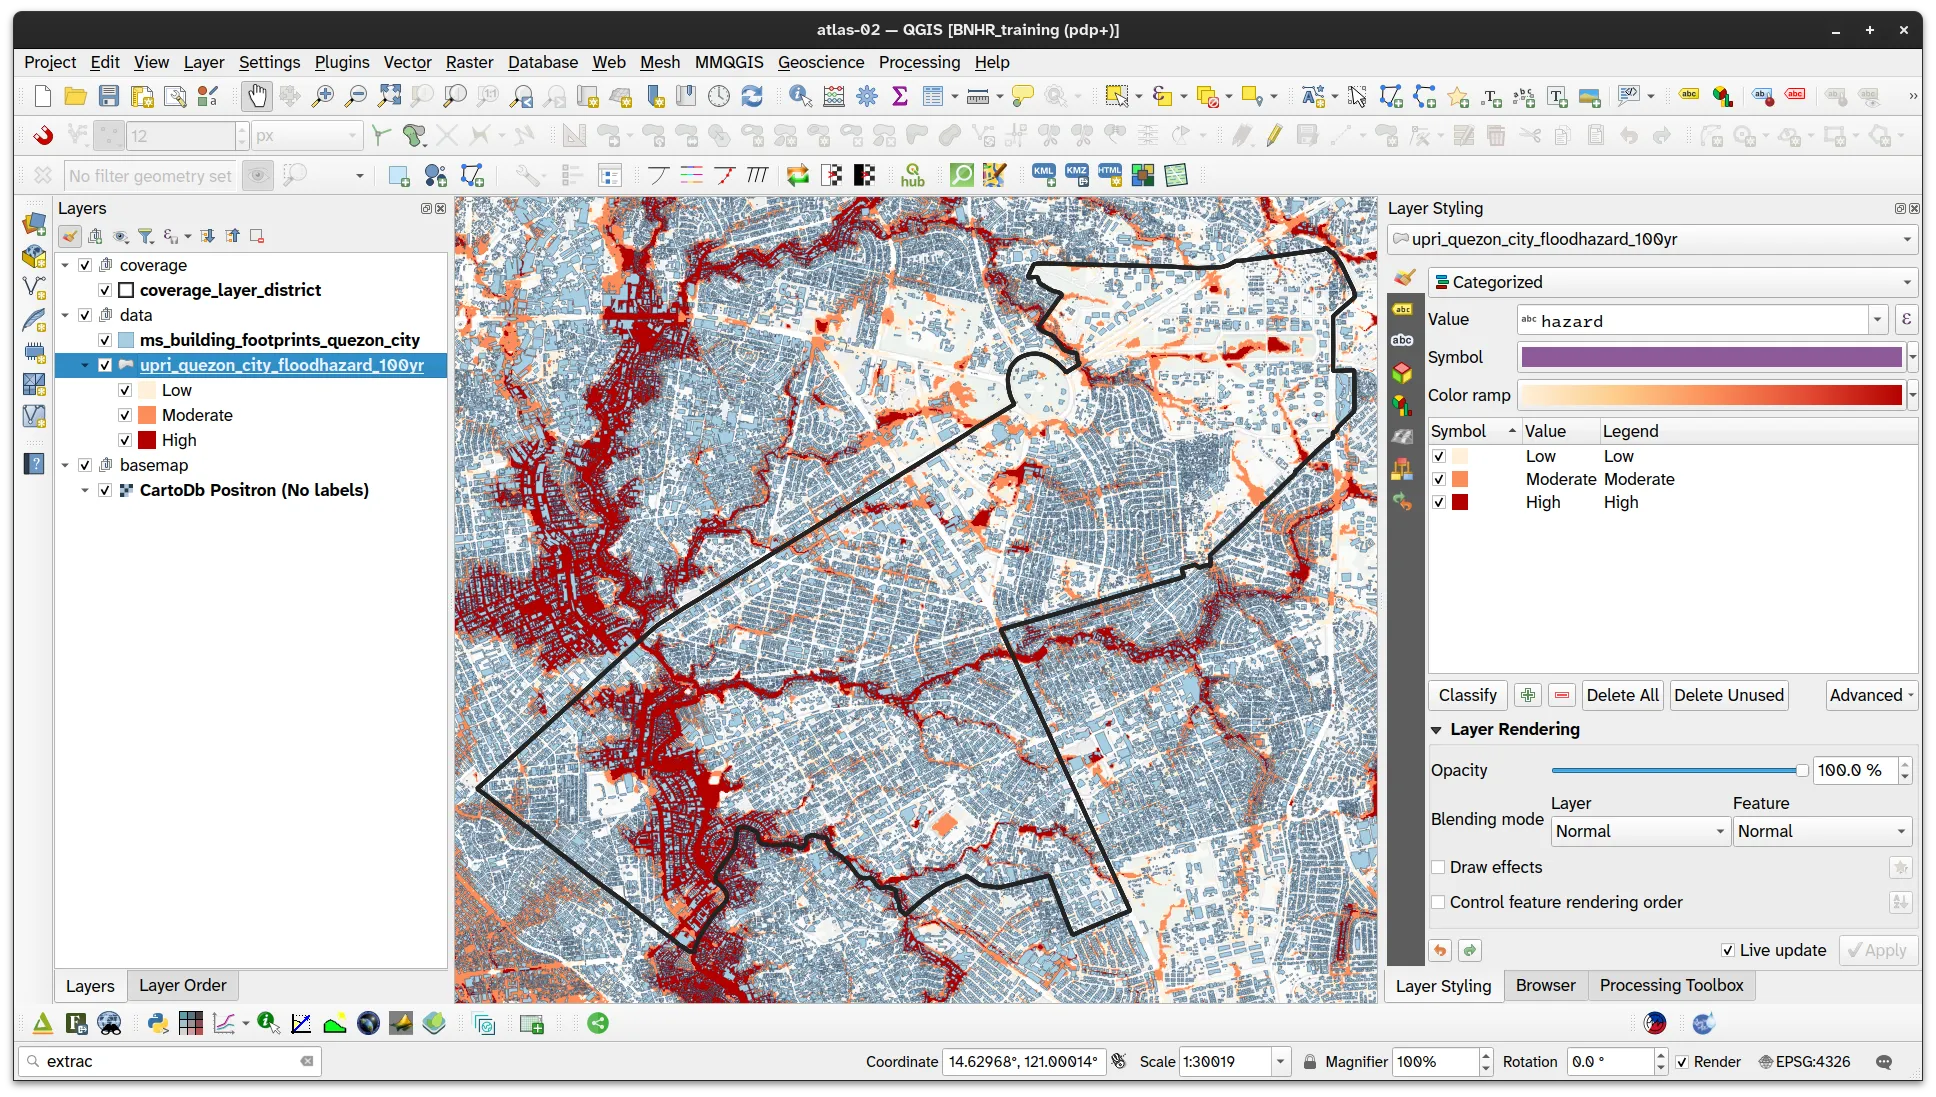
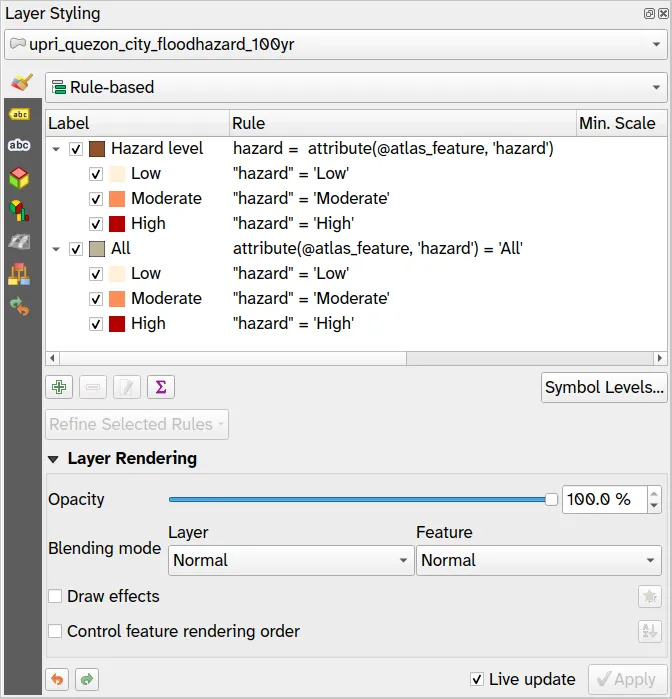
- Apply a nested/refined rule-based symbology on the flood hazard layer (upri_quezon_city_floodhazard_100yr) with the following filters.
- Hazard Level
hazard = attribute(@atlas_feature, 'hazard')
- Low
hazard = 'Low'
- Moderate
hazard = 'Moderate'
- High
hazard = 'High'
- Low
- All
attribute(@atlas_feature, 'hazard') = 'All'
- Low
hazard = 'Low'
- Moderate
hazard = 'Moderate'
- High
hazard = 'High'
- Low
- Hazard Level
- Create a new layout and add a map.
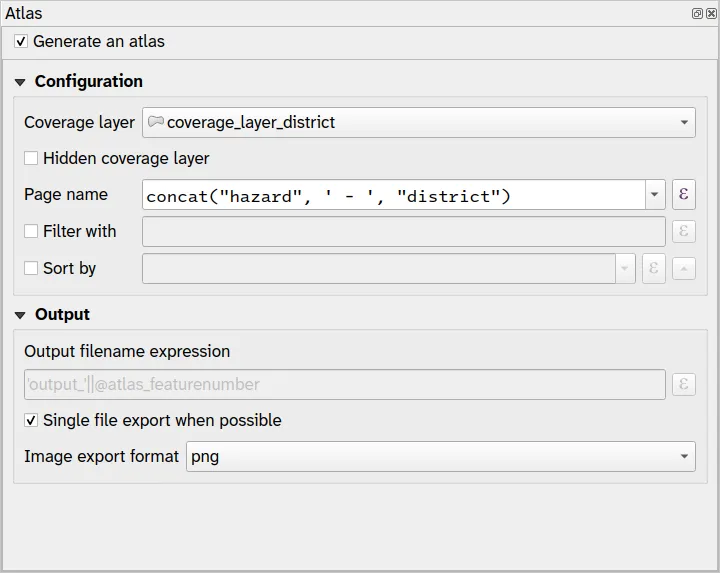
- Generate an atlas with the following configuration:
- Coverage layer: coverage_layer_district
- Page name and Sort by:
"hazard" || ' - ' || "district"
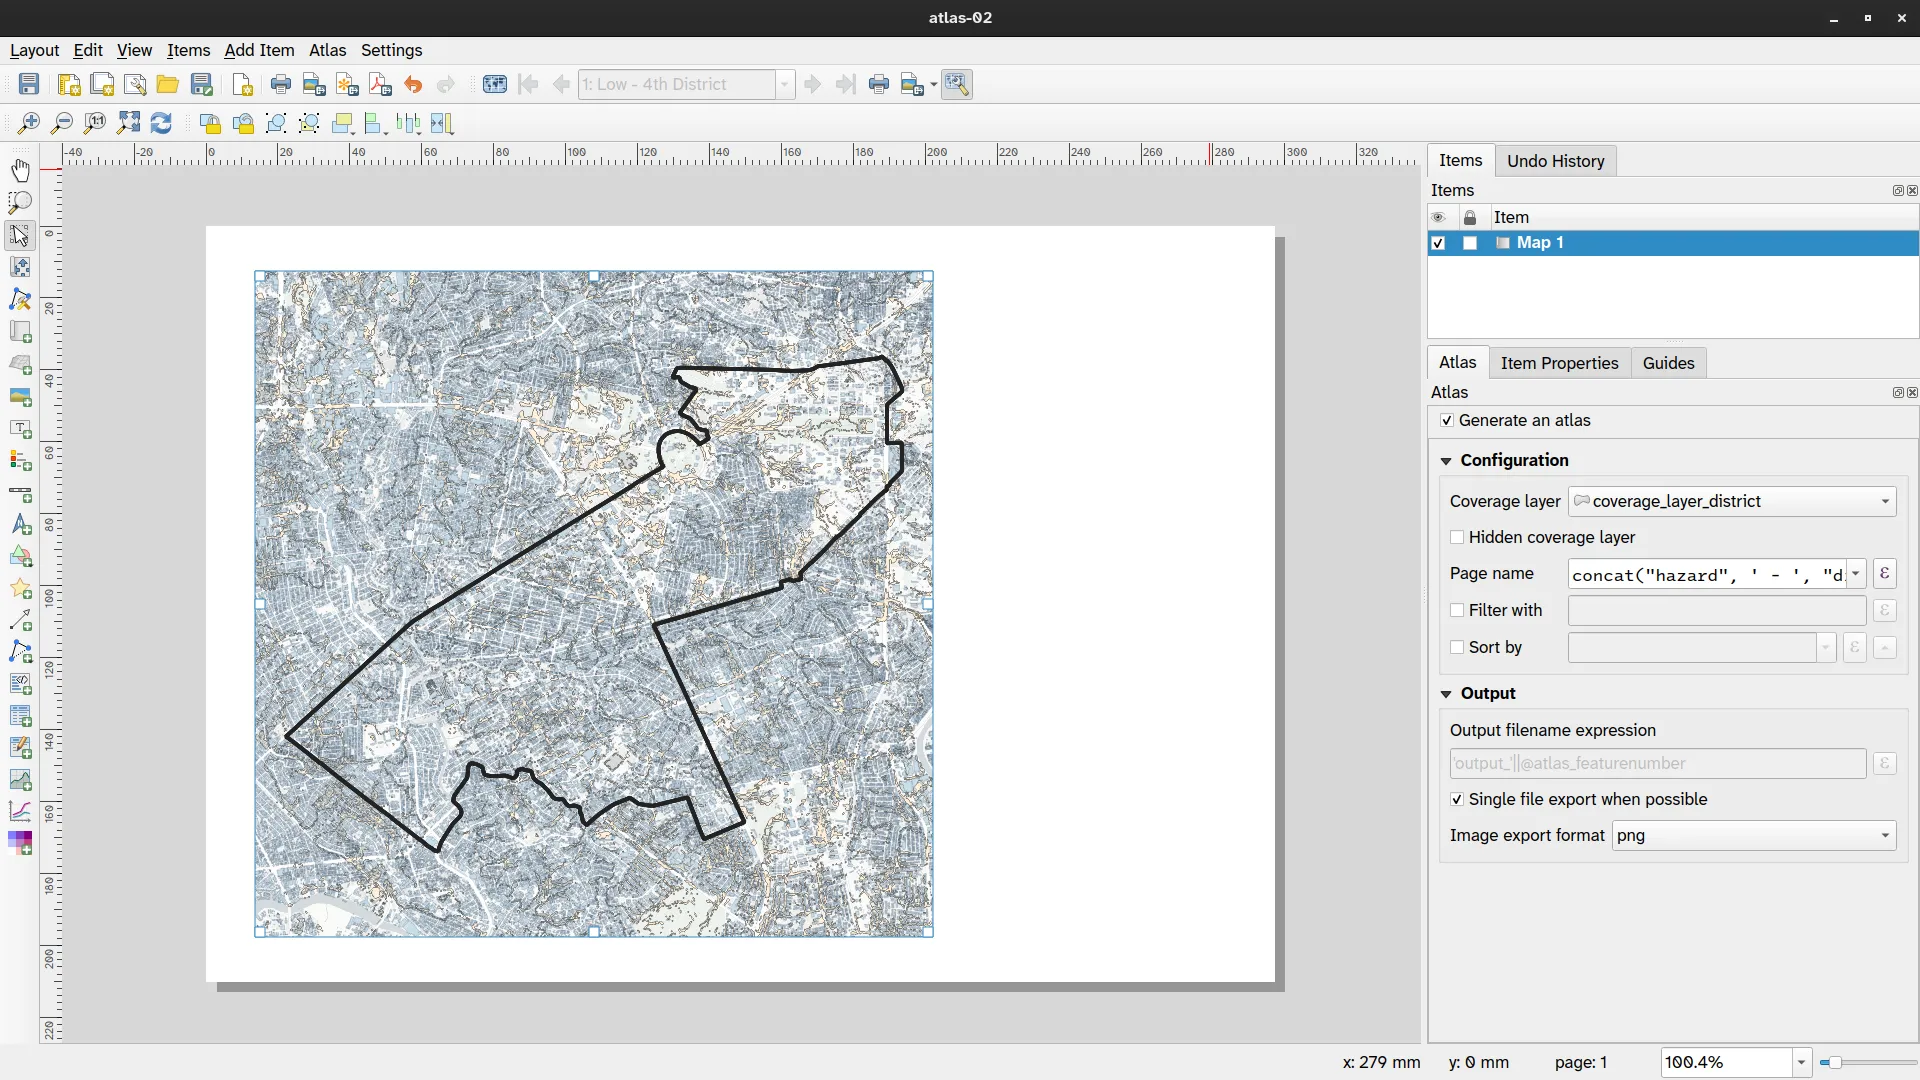
- Enable the Atlas and look at the generated maps.
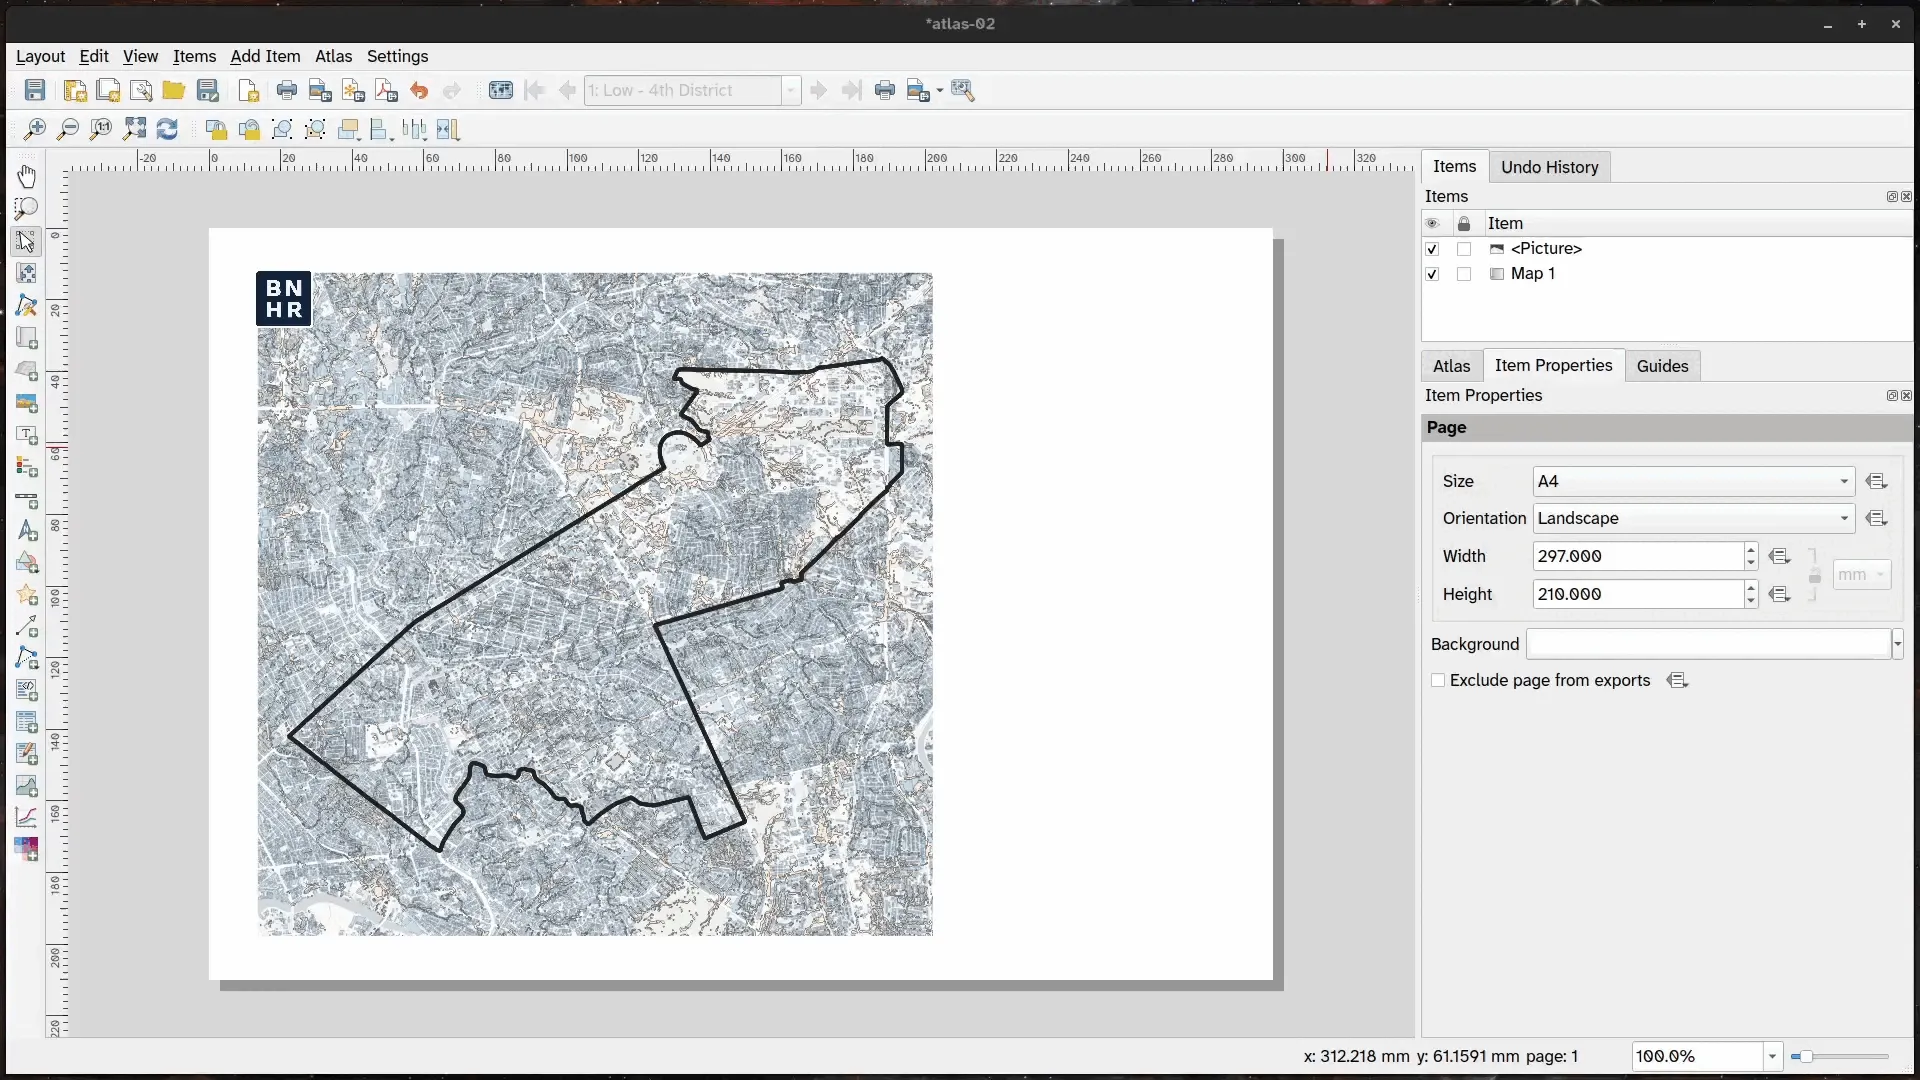
- Add other data defined elements such as titles and legends.
Atlas that incorporates map themes
Section titled “Atlas that incorporates map themes”You’ve learned how to use an atlas to map different areas showing the same layers as well as mapping the same layer multiple times in the same area. In this exercise, you will add another level to your Atlas skills by combining both—mapping multiple layers in multiple areas.
3.3. Mapping population density, flood hazard, building footprints, and roads for all districts in Quezon City
Section titled “3.3. Mapping population density, flood hazard, building footprints, and roads for all districts in Quezon City”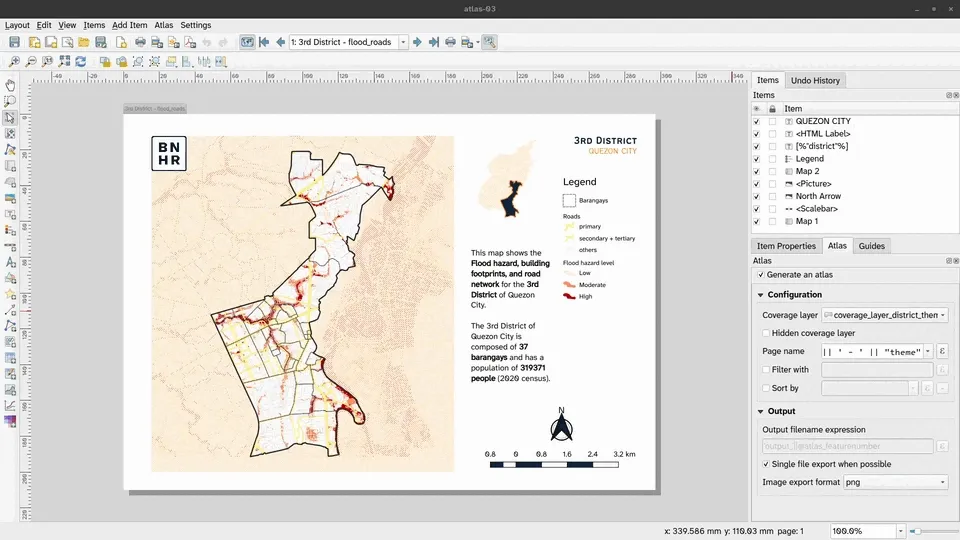
The goal of this exercise is for you to create at atlas that can map, per district:
- population density,
- flood hazard and building footprints,
- flood hazard and roads,
- flood hazard, building footprints, and roads.
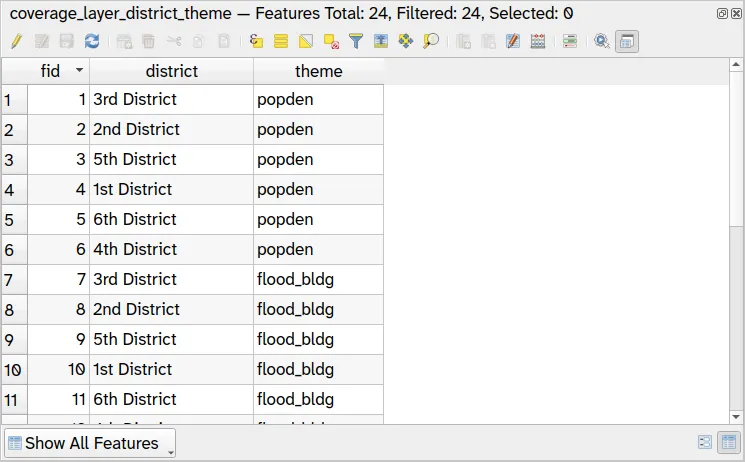
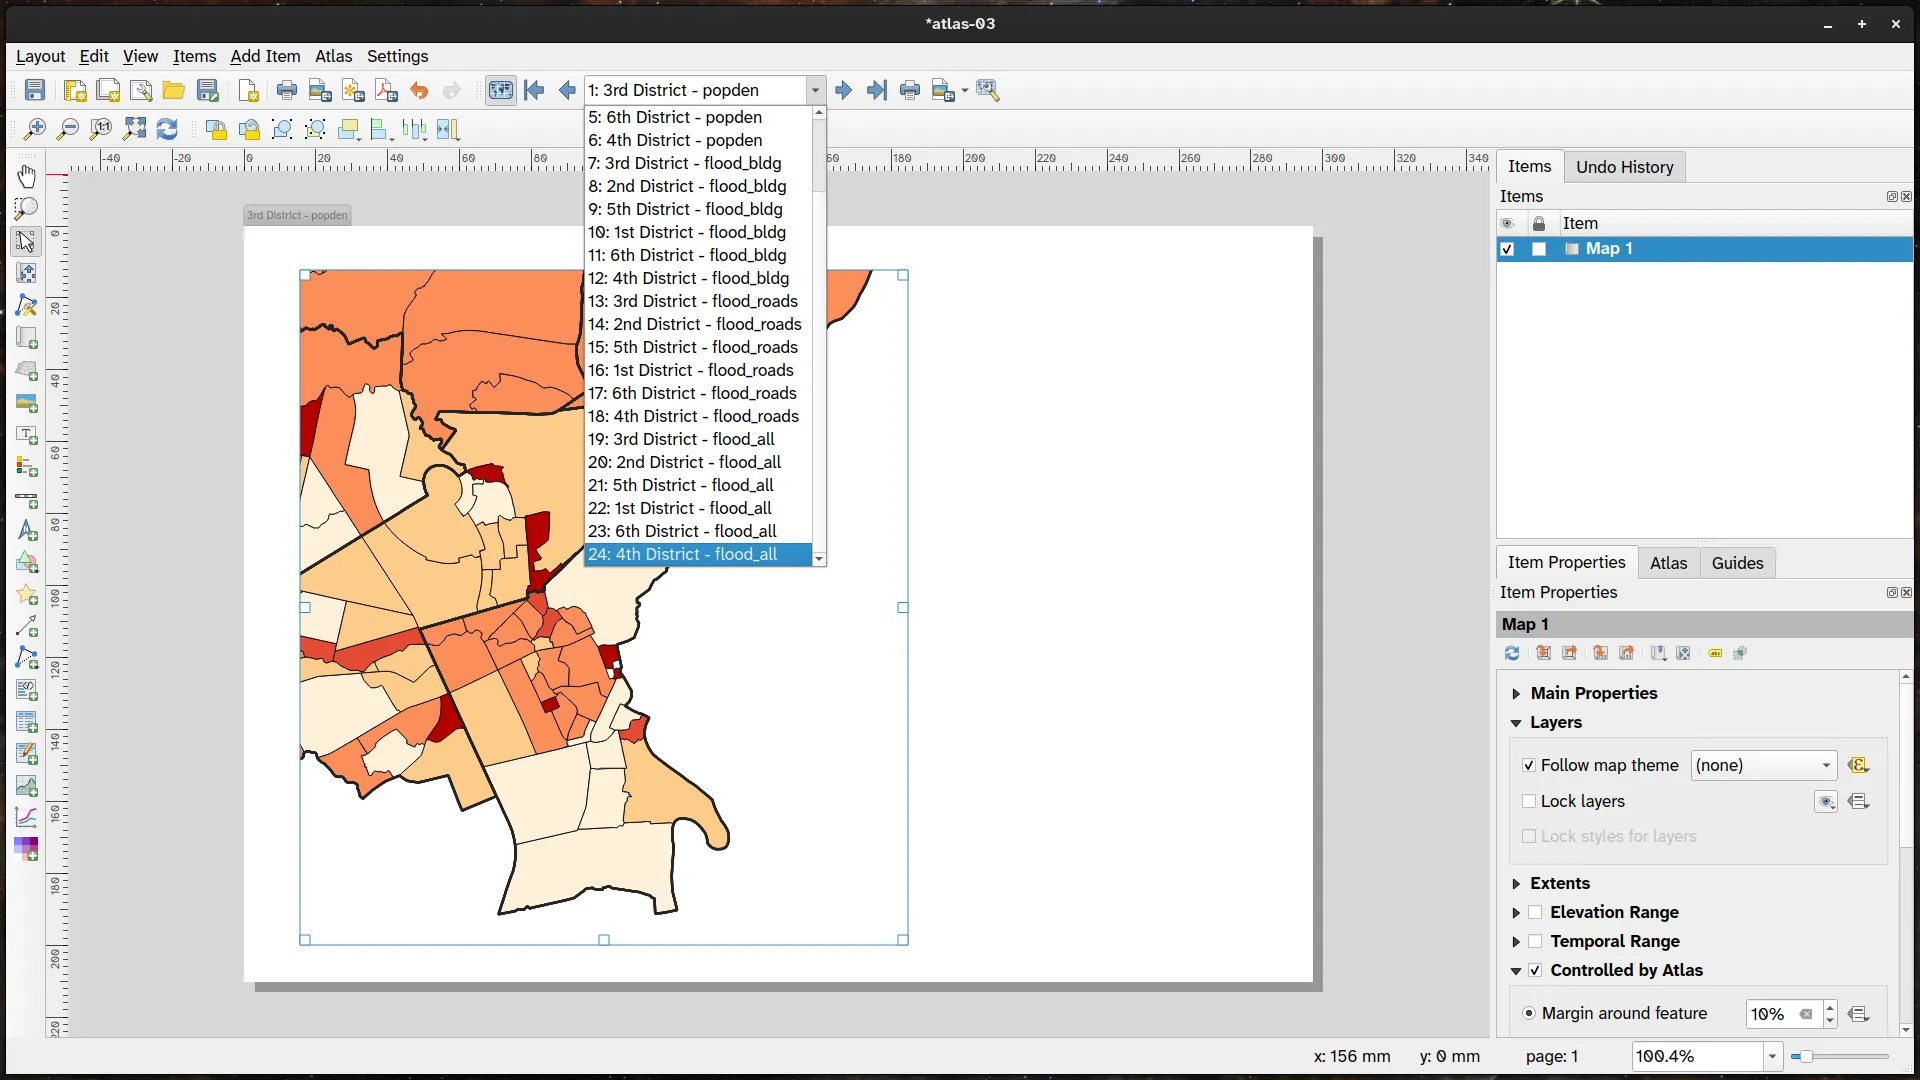
In total, you will generate 24 maps (6 x 4) with 1 layout that can dynamically map different layers. imilar to the previous exercise, you need to be creative with your coverage layer. You will also utilize your knowledge of map themes.
To do this exercise, you need:
- a coverage layer (coverage_layer_district_theme) that:
- covers the extent of the 2nd District
- has 24 features (1 for each map)
- has a “theme” attribute/field corresponding to the theme that will be used for the map (atlas feature)
- 4 map themes
- popden: showing only the population density layer
- flood_bldg: showing only the flood hazard and building footprint layers
- flood_roads: showing only the flood hazard and roads layer
- flood_all: showing the flood hazard, building footprint, and roads layers
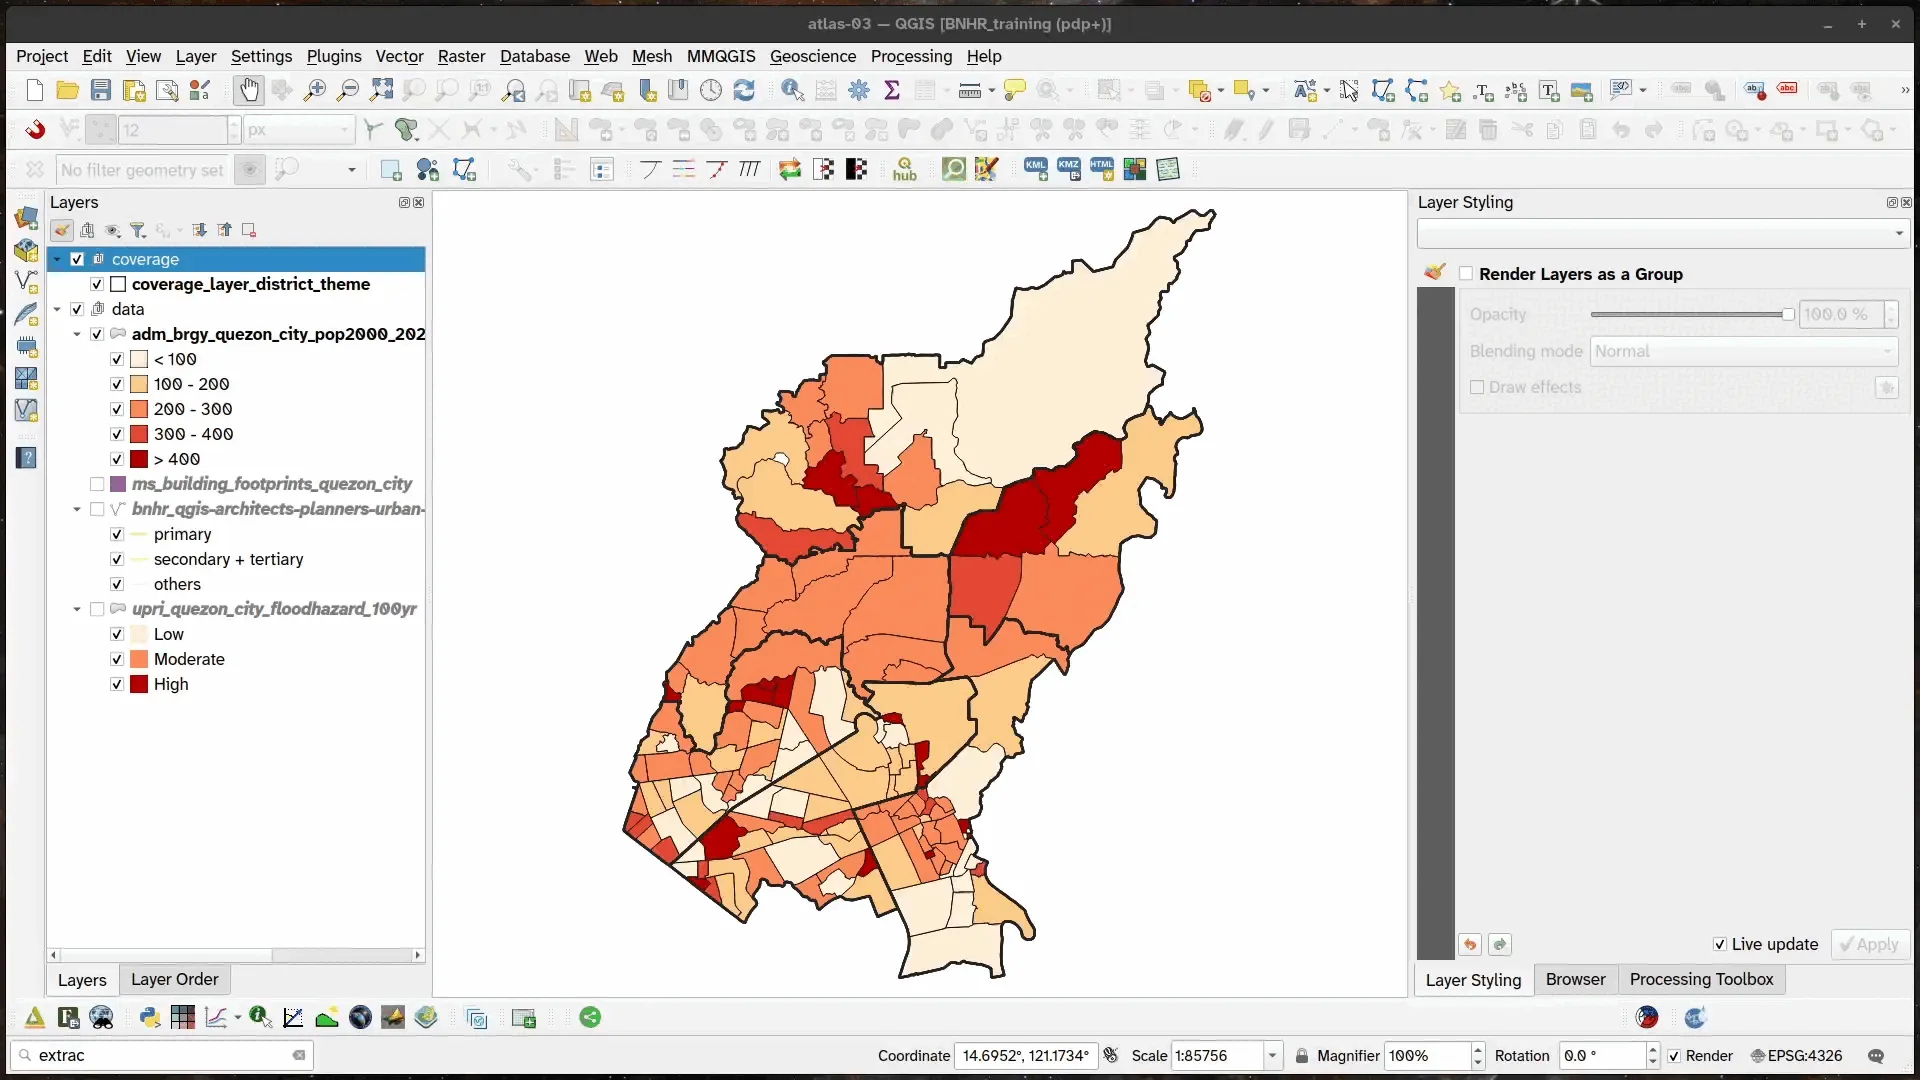
- Load and style the following layers:
- coverage_layer_district_theme,
- upri_quezon_city_floodhazard_100yr,
- ms_building_footprints_quezon_city,
- osm_road layers,
- adm_brgy_quezon_city_pop2000_2020 (style based on population density per 100000 sqm)
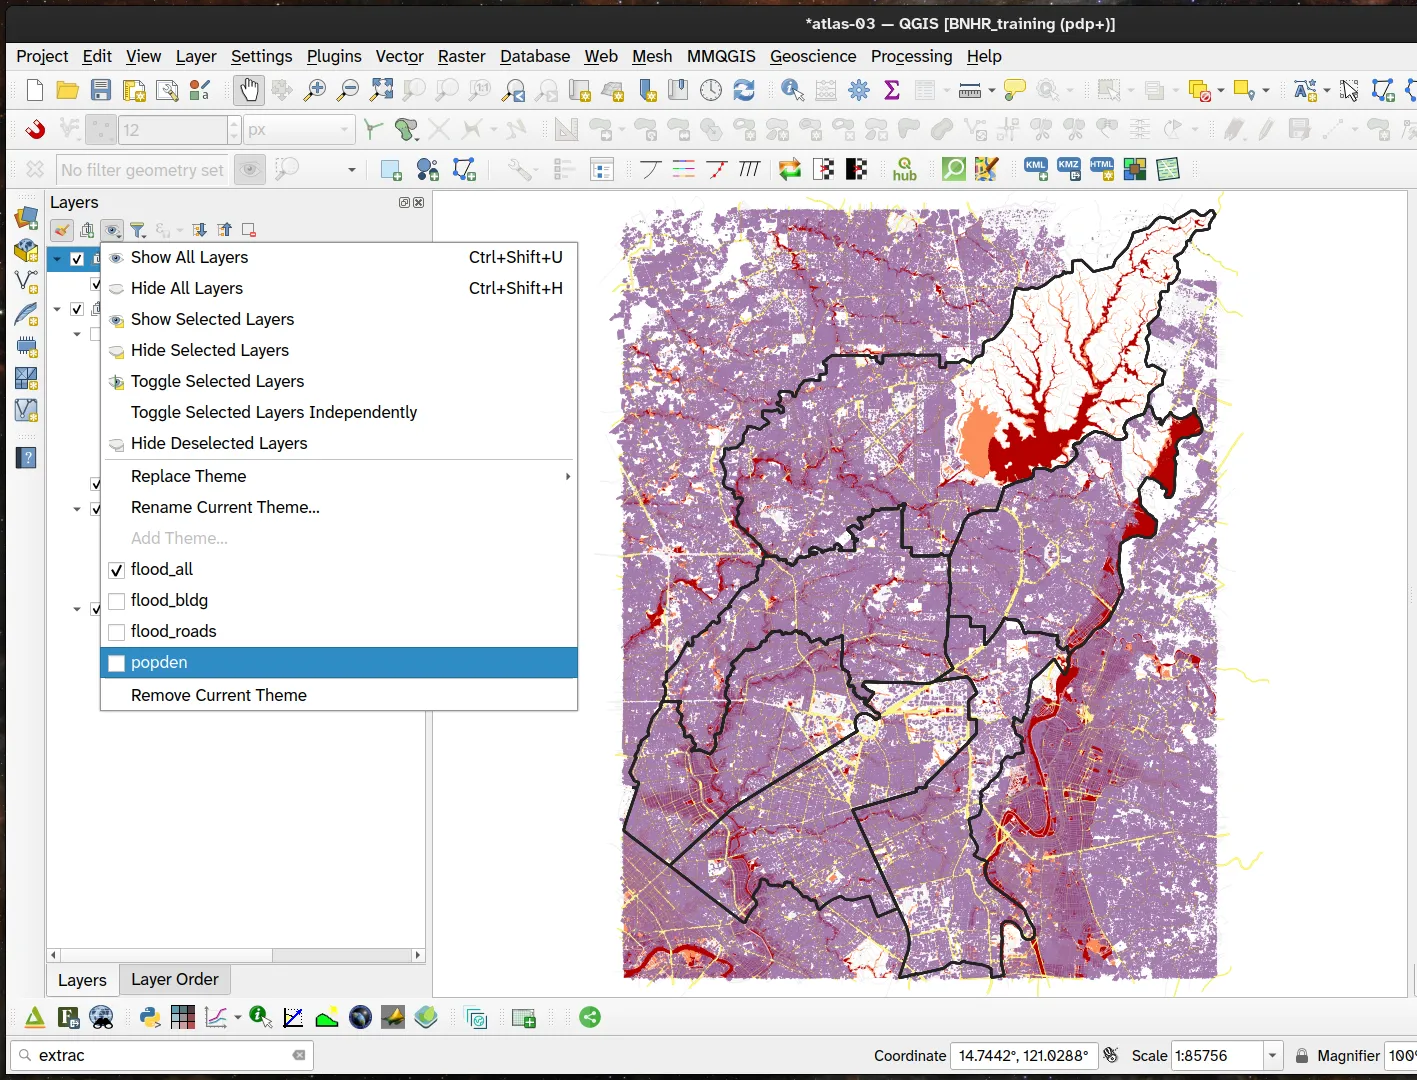
- Create 4 map themes with the following visible layers:
- popden
- adm_brgy_quezon_city_pop2000_2020 (population density layer)
- flood_bldg
- upri_quezon_city_floodhazard_100yr
- ms_building_footprints_quezon_city
- flood_roads
- upri_quezon_city_floodhazard_100yr
- osm_road layers
- flood_all
- upri_quezon_city_floodhazard_100yr
- ms_building_footprints_quezon_city
- osm_road layers
- popden
- Create a new layout and add a map.
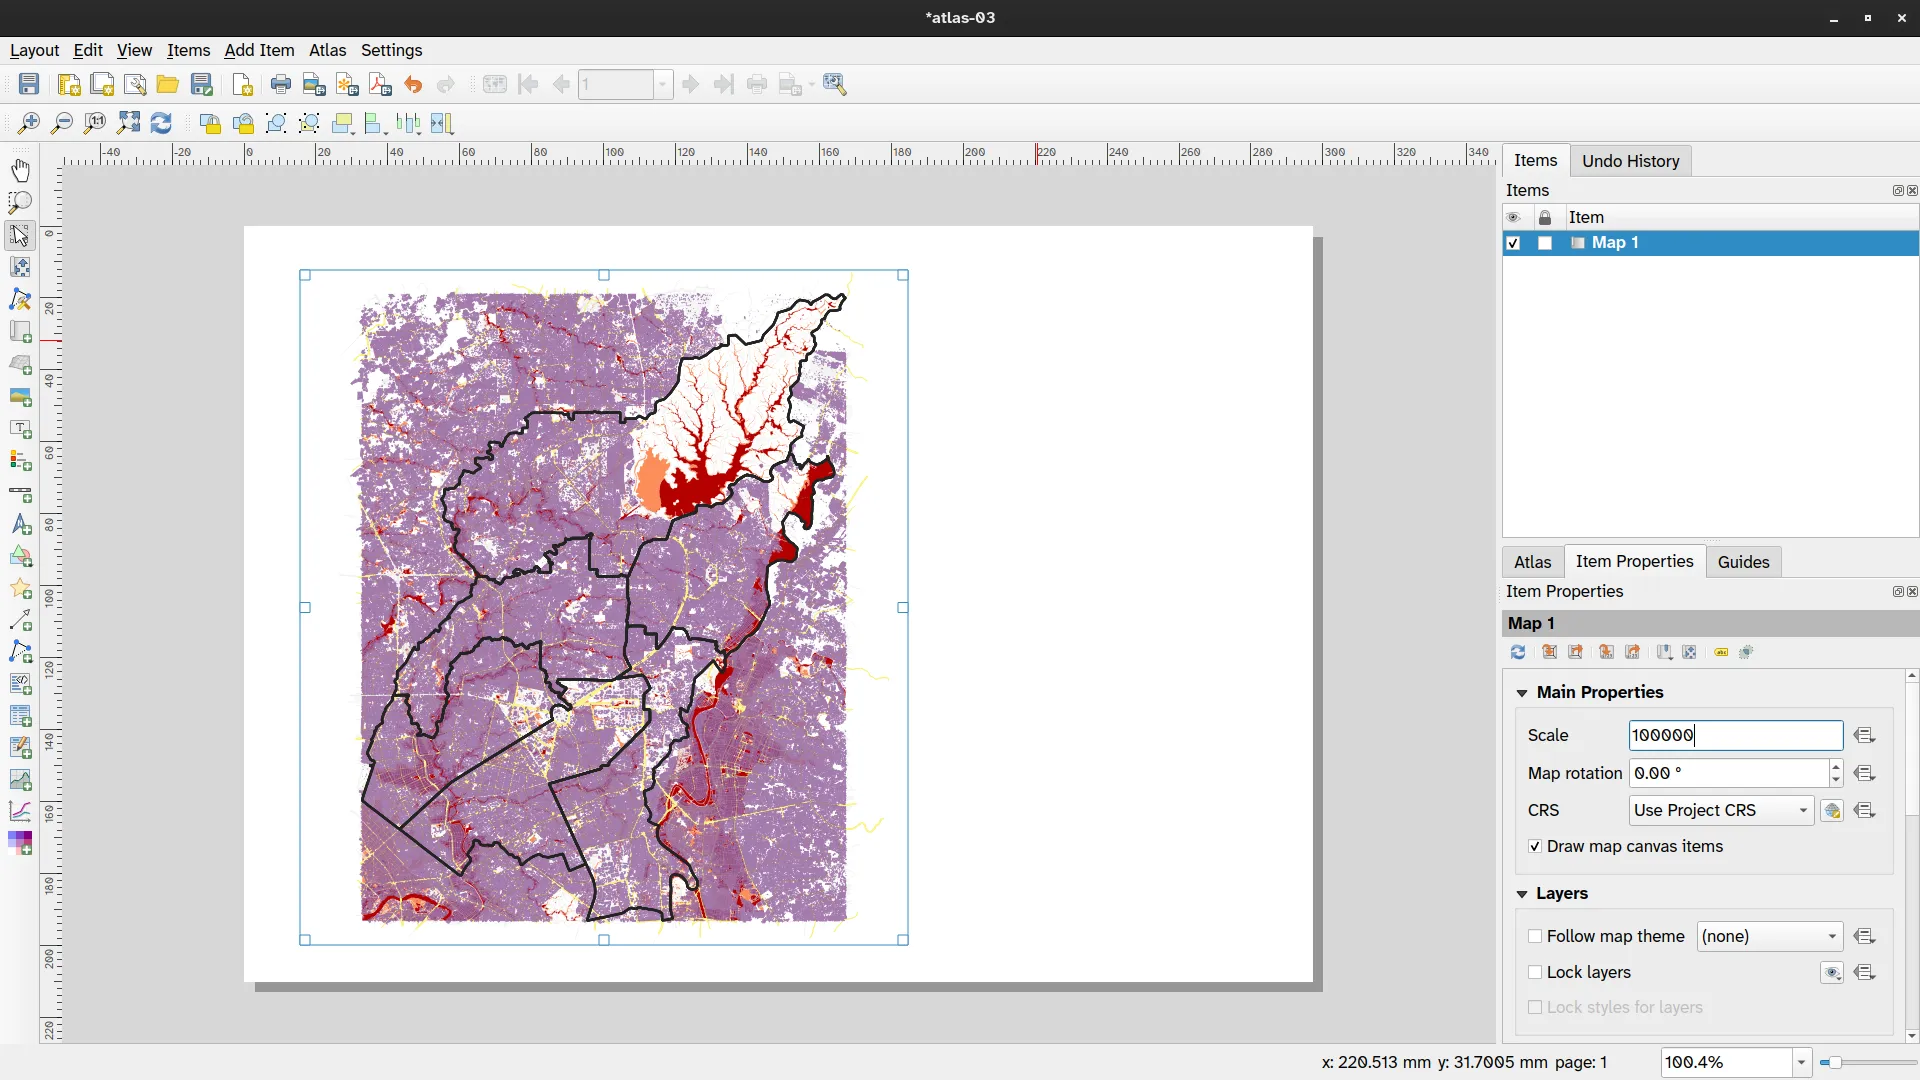
- Generate an atlas with the following configuration:
- Coverage layer: coverage_layer_district_themes
- Page name and Sort by:
"district" || ' - ' || "theme"
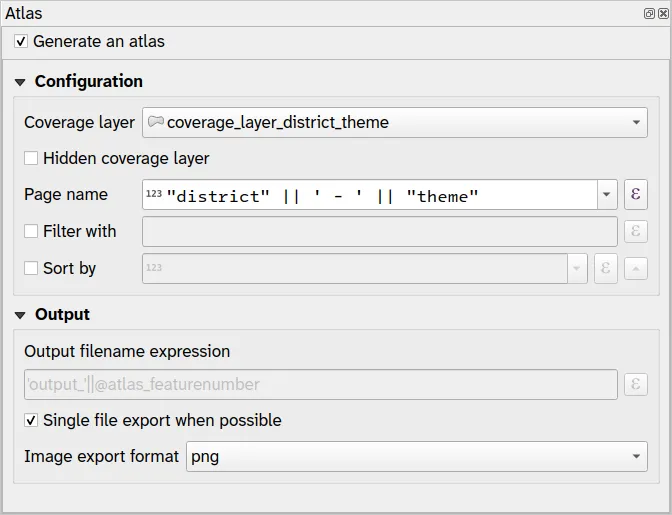
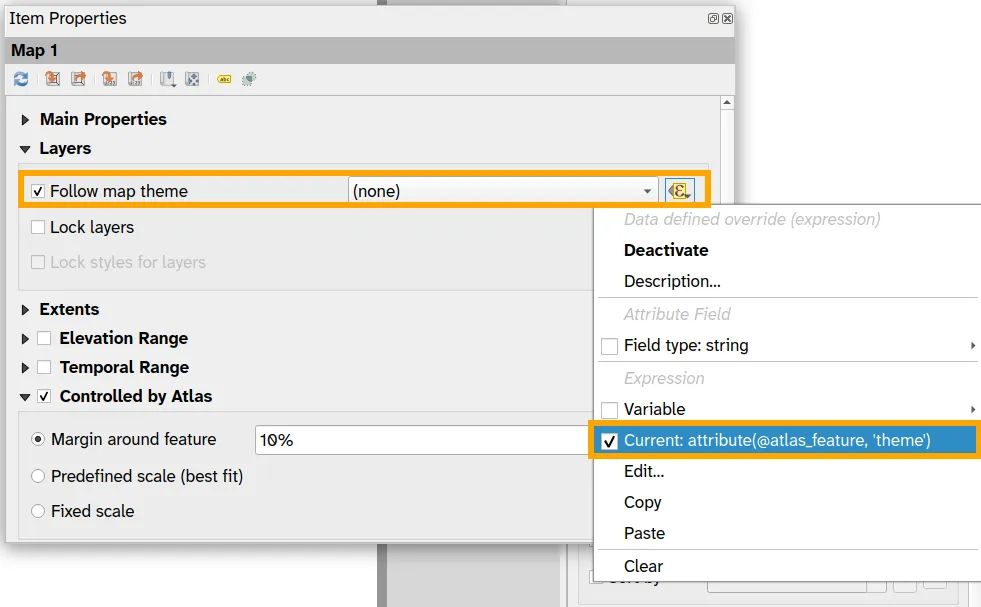
- In the Map’s Item Properties, under Layers, check Follow map theme and use a data-defined override so that the value for this parameter is theme (from the coverage layer attribute table). Use the following expression:
attribute(@atlas_feature, 'theme')
- Preview the Atlas, did you do it right?
- Let’s apply some of the things we learned from the previous exercises to improve the look and feel of the maps. We can:
Atlas that incorporates spatial and temporal elements
Section titled “Atlas that incorporates spatial and temporal elements”3.4. Using an atlas to map earthquakes over time
Section titled “3.4. Using an atlas to map earthquakes over time”See: Atlas that incorporates spatial and temporal elements.
Homework: Mapping health events in barangays per city/municipality in NCR
Section titled “Homework: Mapping health events in barangays per city/municipality in NCR”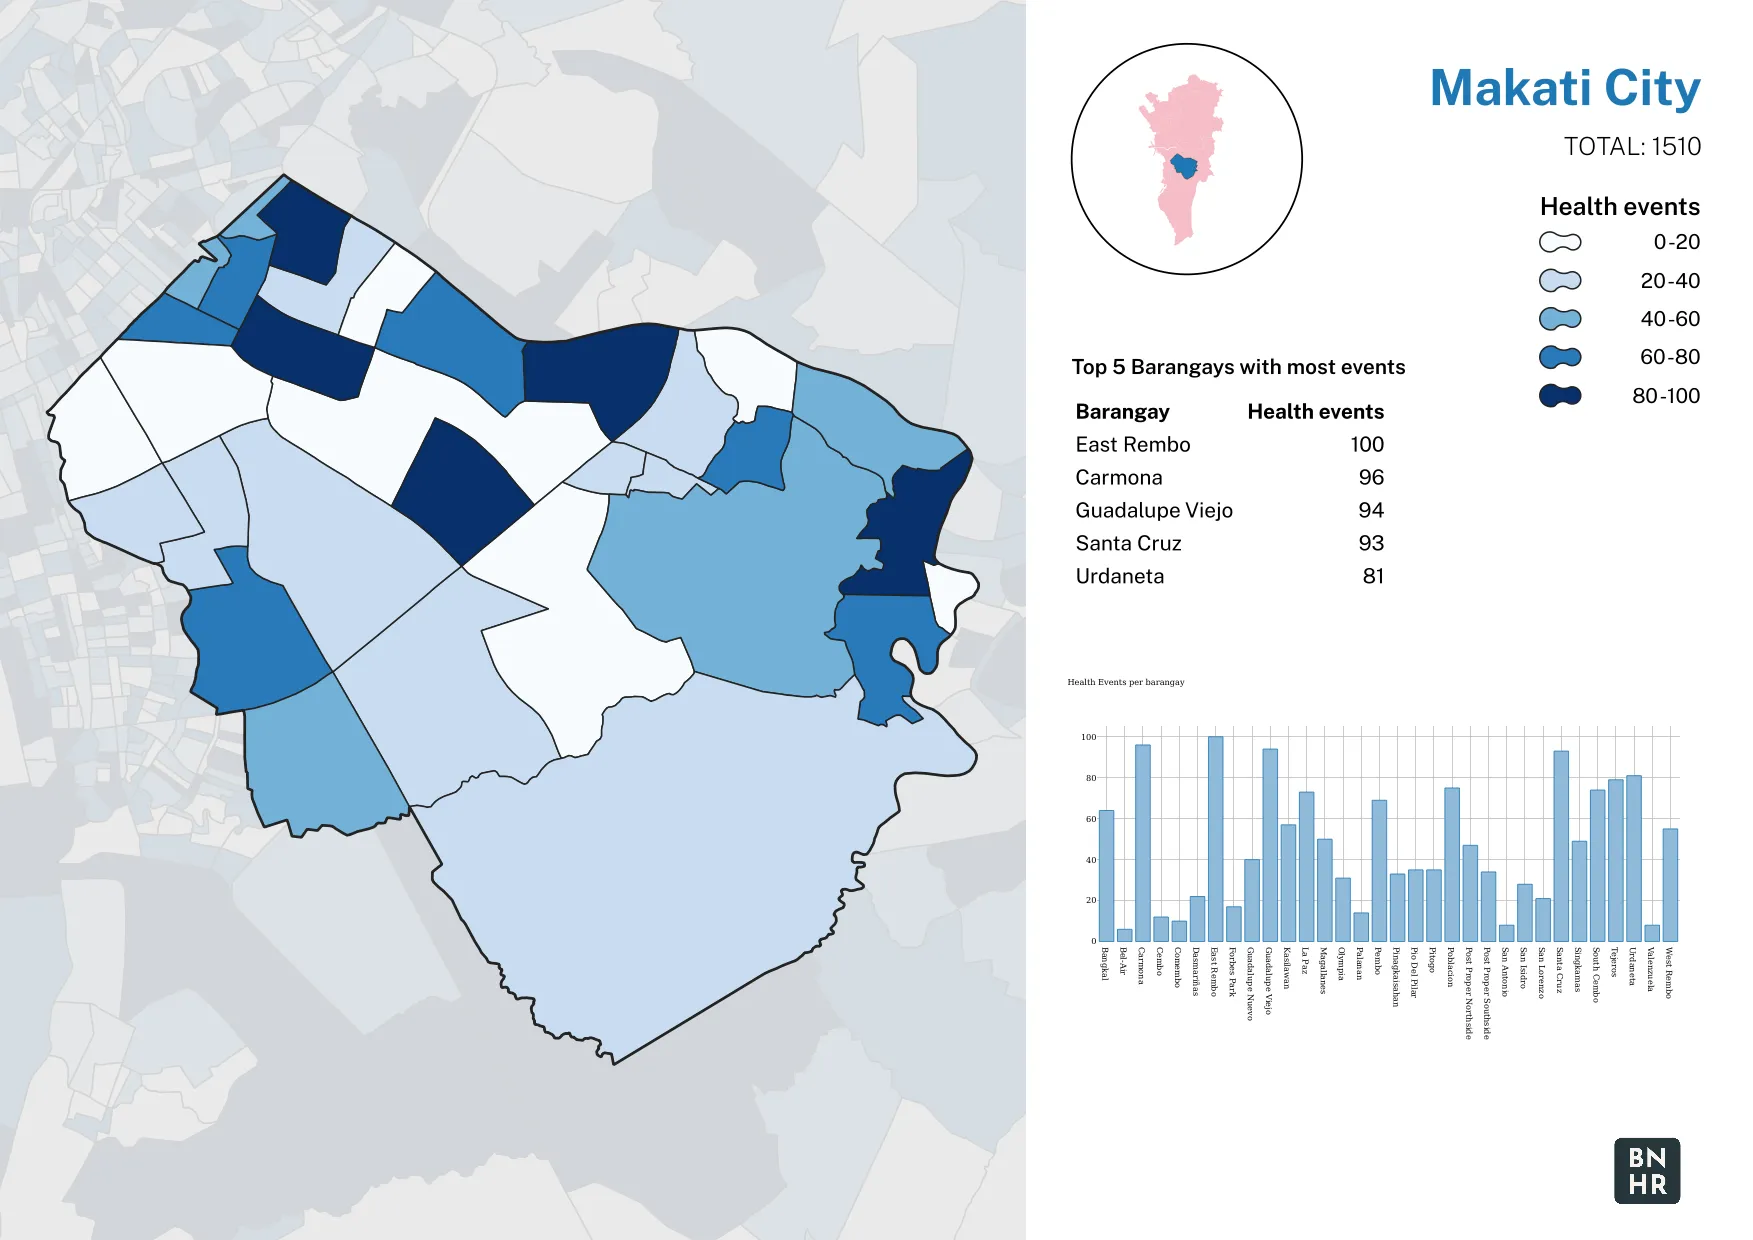
General instructions
Section titled “General instructions”- Submit a geopackage containing the layers and project file.
- Submit the images generated by the atlas (store inside a zipped file).
Tips and Reminders
Section titled “Tips and Reminders”- To save a project in a GeoPackage, go to Project ▶ Save to ▶ GeoPackage in the Menu bar and select the GeoPackage where you want to save your project to.
- Use map themes to control what’s visible in different maps (e.g. inset, main map).
- Use expressions to show only the barangays that are inside the current city/municipality (or atlas feature).
- Remember that you can duplicate the same layer and style it differently.
Objectives
Section titled “Objectives”- To utilize the QGIS Atlas to create a layout that can generate a map of per-barangay health events for each city/municipality in the NCR.
- Found inside the bnhr_qgis-architects-planners-urban-003.gpkg.
- barangays - vector file of the barangays in the NCR with a field for the number of health_events per barangay
Instructions
Section titled “Instructions”- Create a municities layer from the barangays layer. This will serve as your coverage layer. It would be good if you can add fields for the total number of health events and total number of barangays in the municitieslayer you will create.
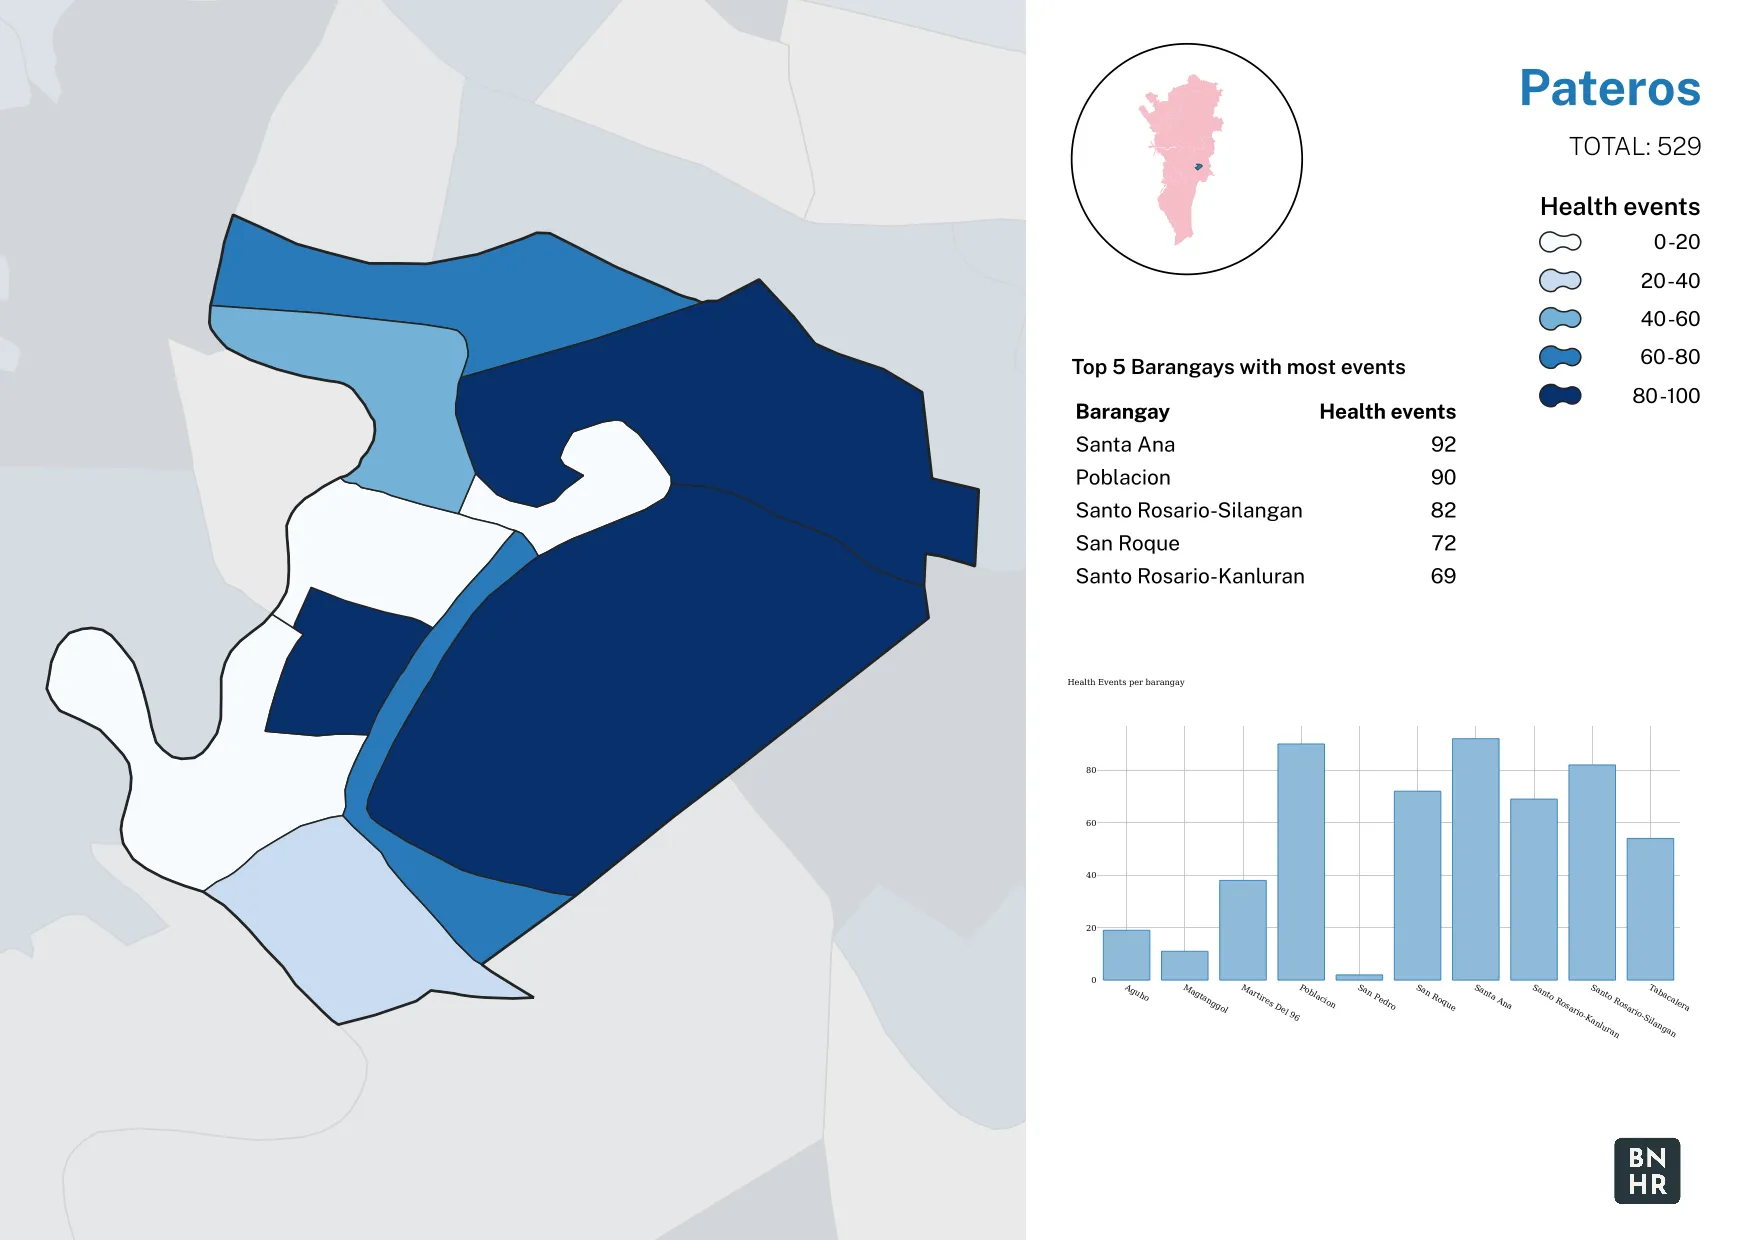
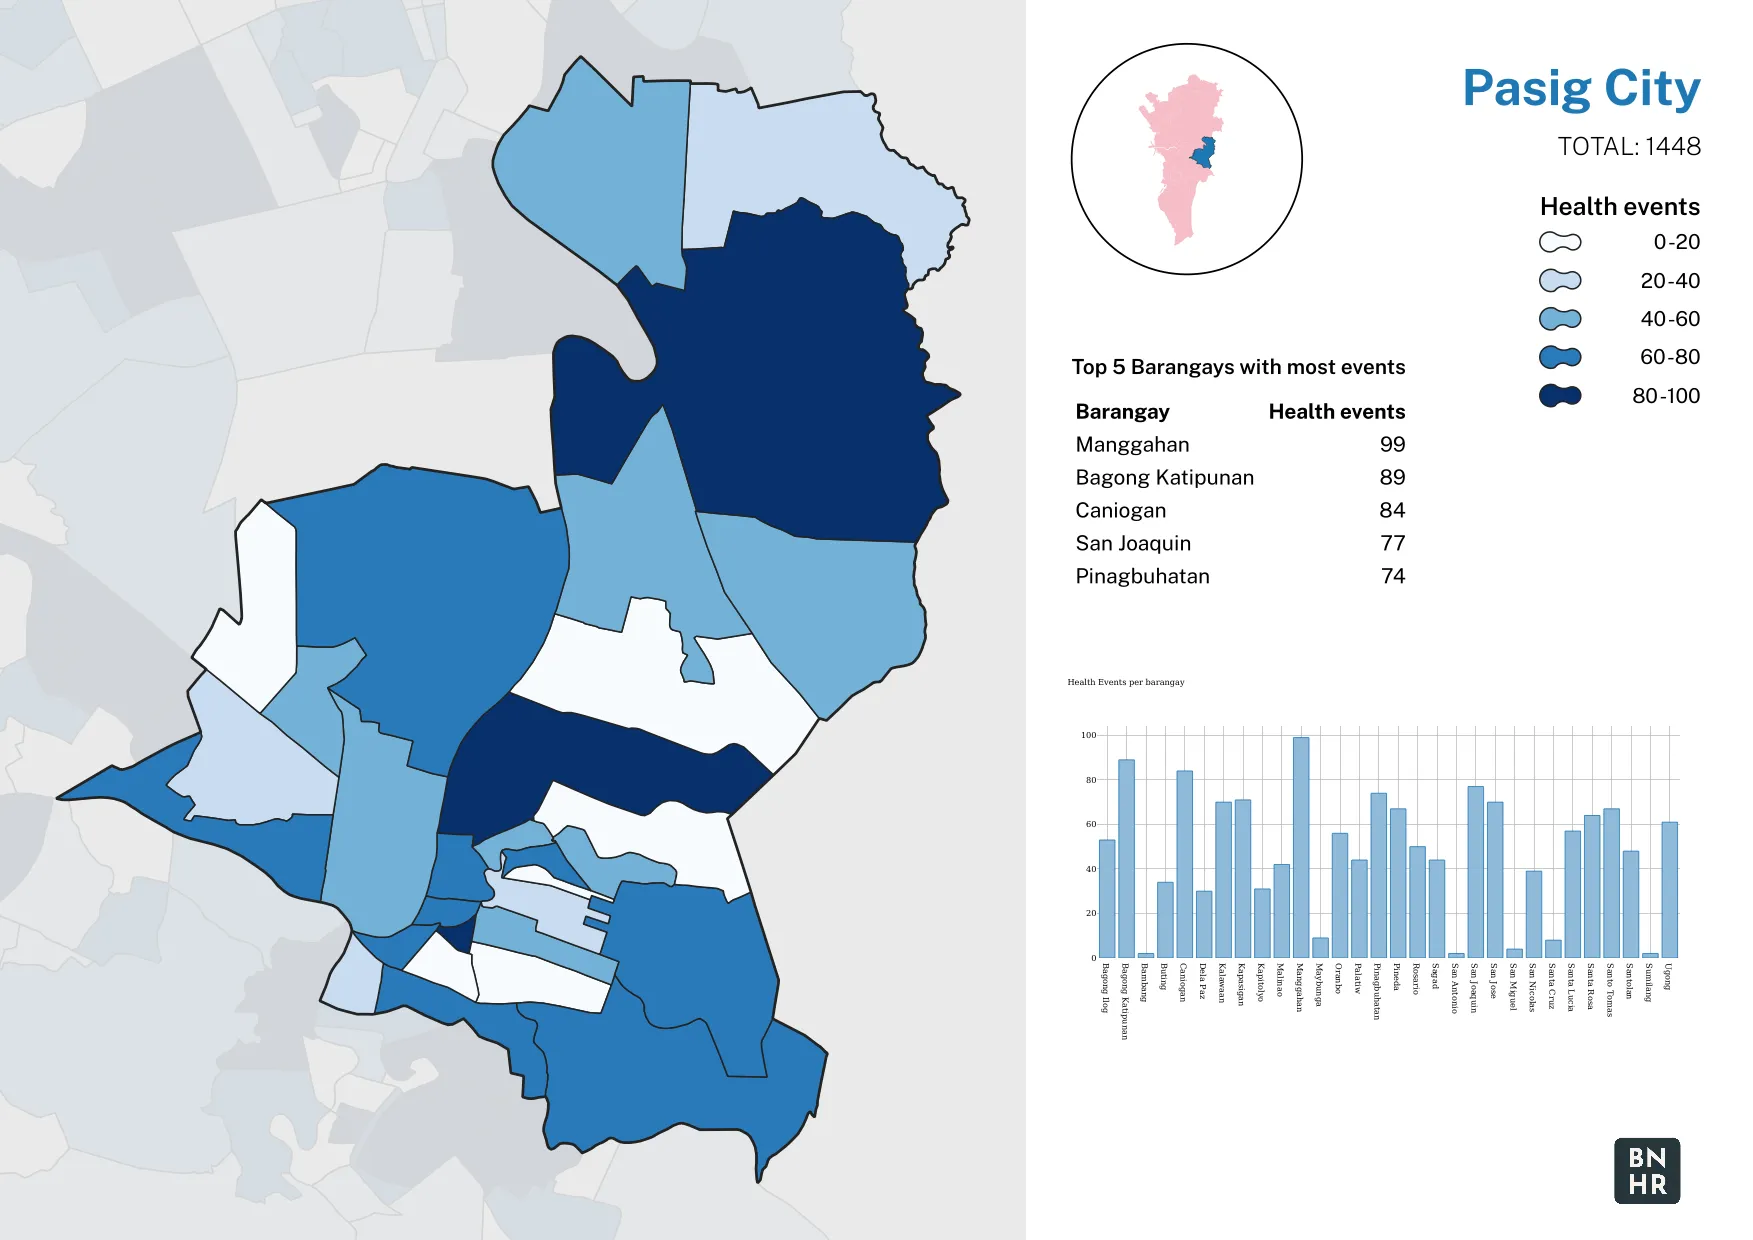
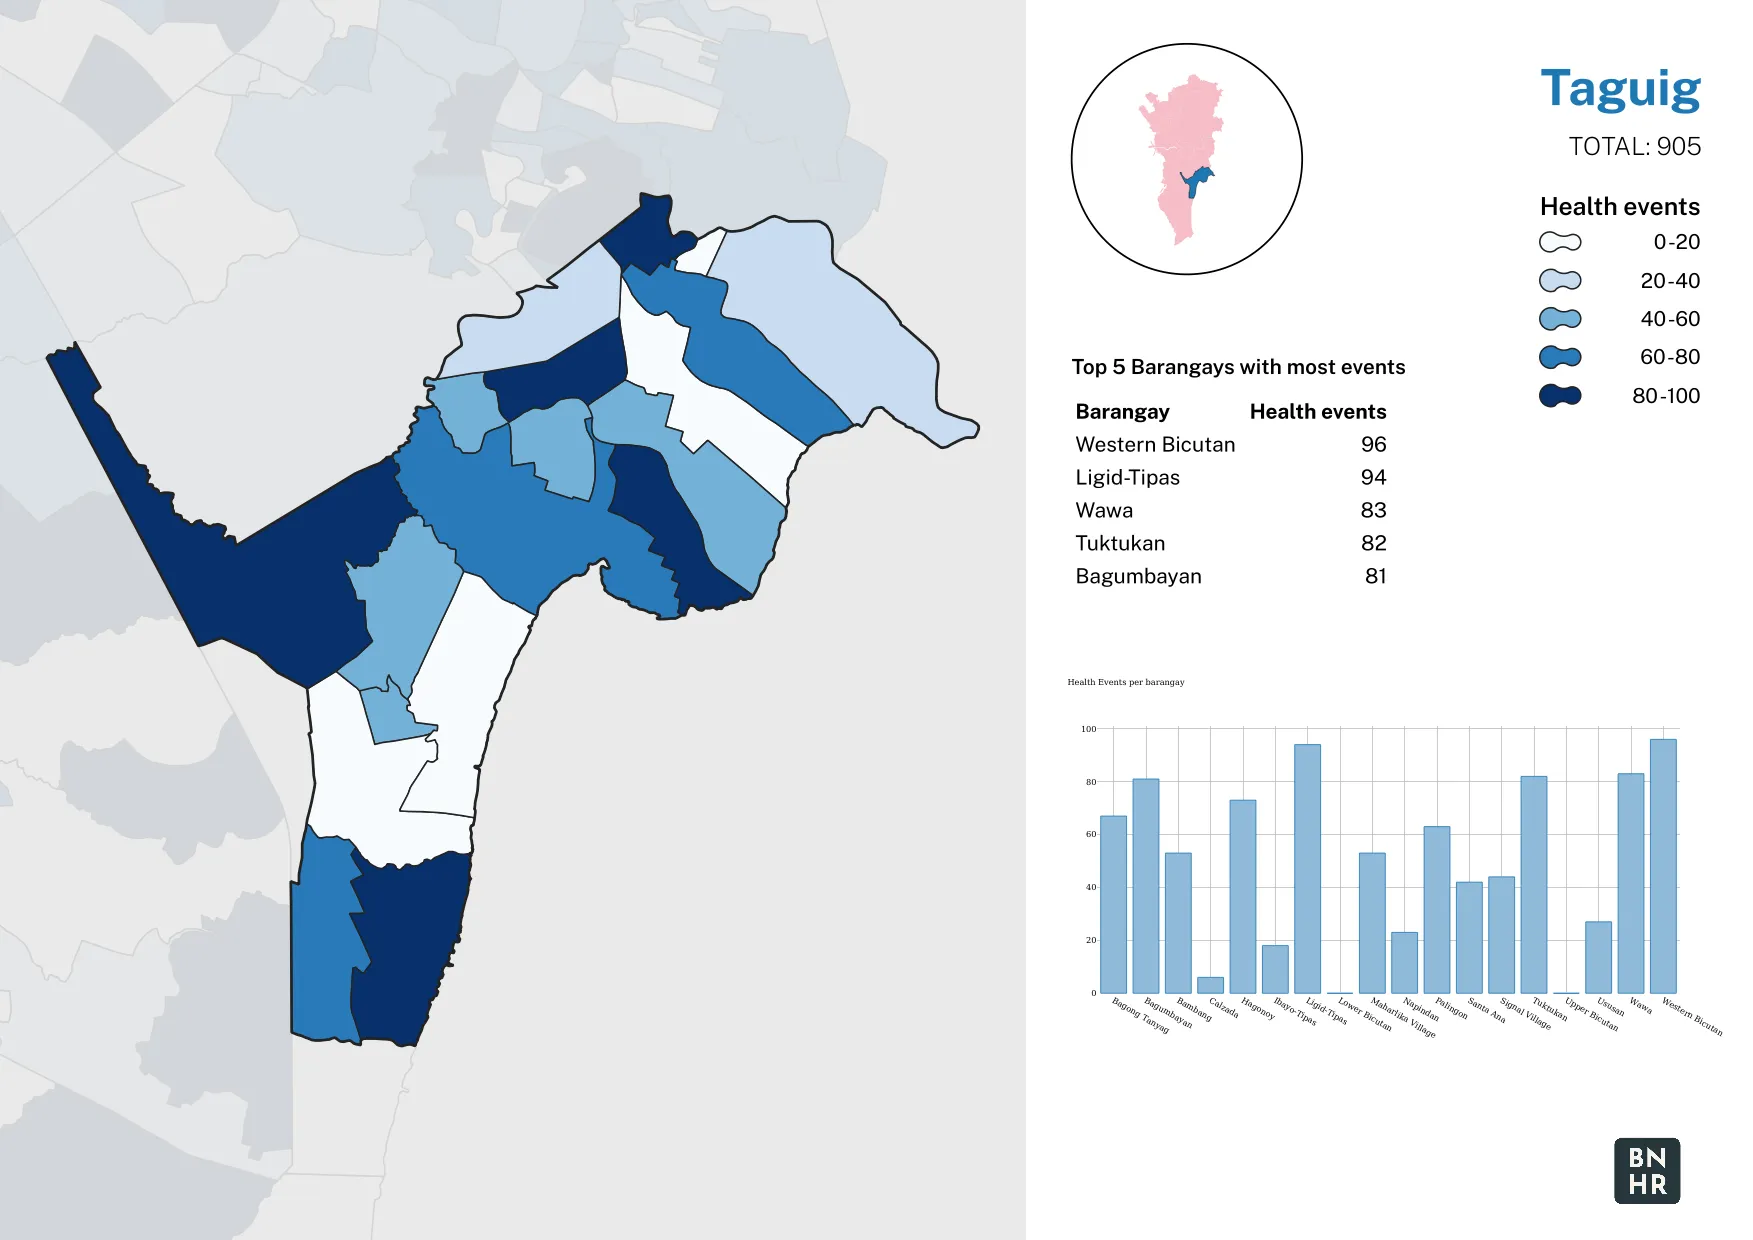
- Use the QGIS Atlas functionality to create maps for each city/municipality in the NCR that will show the following:
- Map of the number of health events per barangay in the city/municipality.
- An inset map showing the relative location of the city/municipality being mapped.
- The name of the city/municipality and the total number of health events in the city/municipality
- The top 5 barangays with the most health events in the city/municipality
- A graph/plot of the number of health events per barangay in the city/municipality
Sample Atlas outputs
Section titled “Sample Atlas outputs”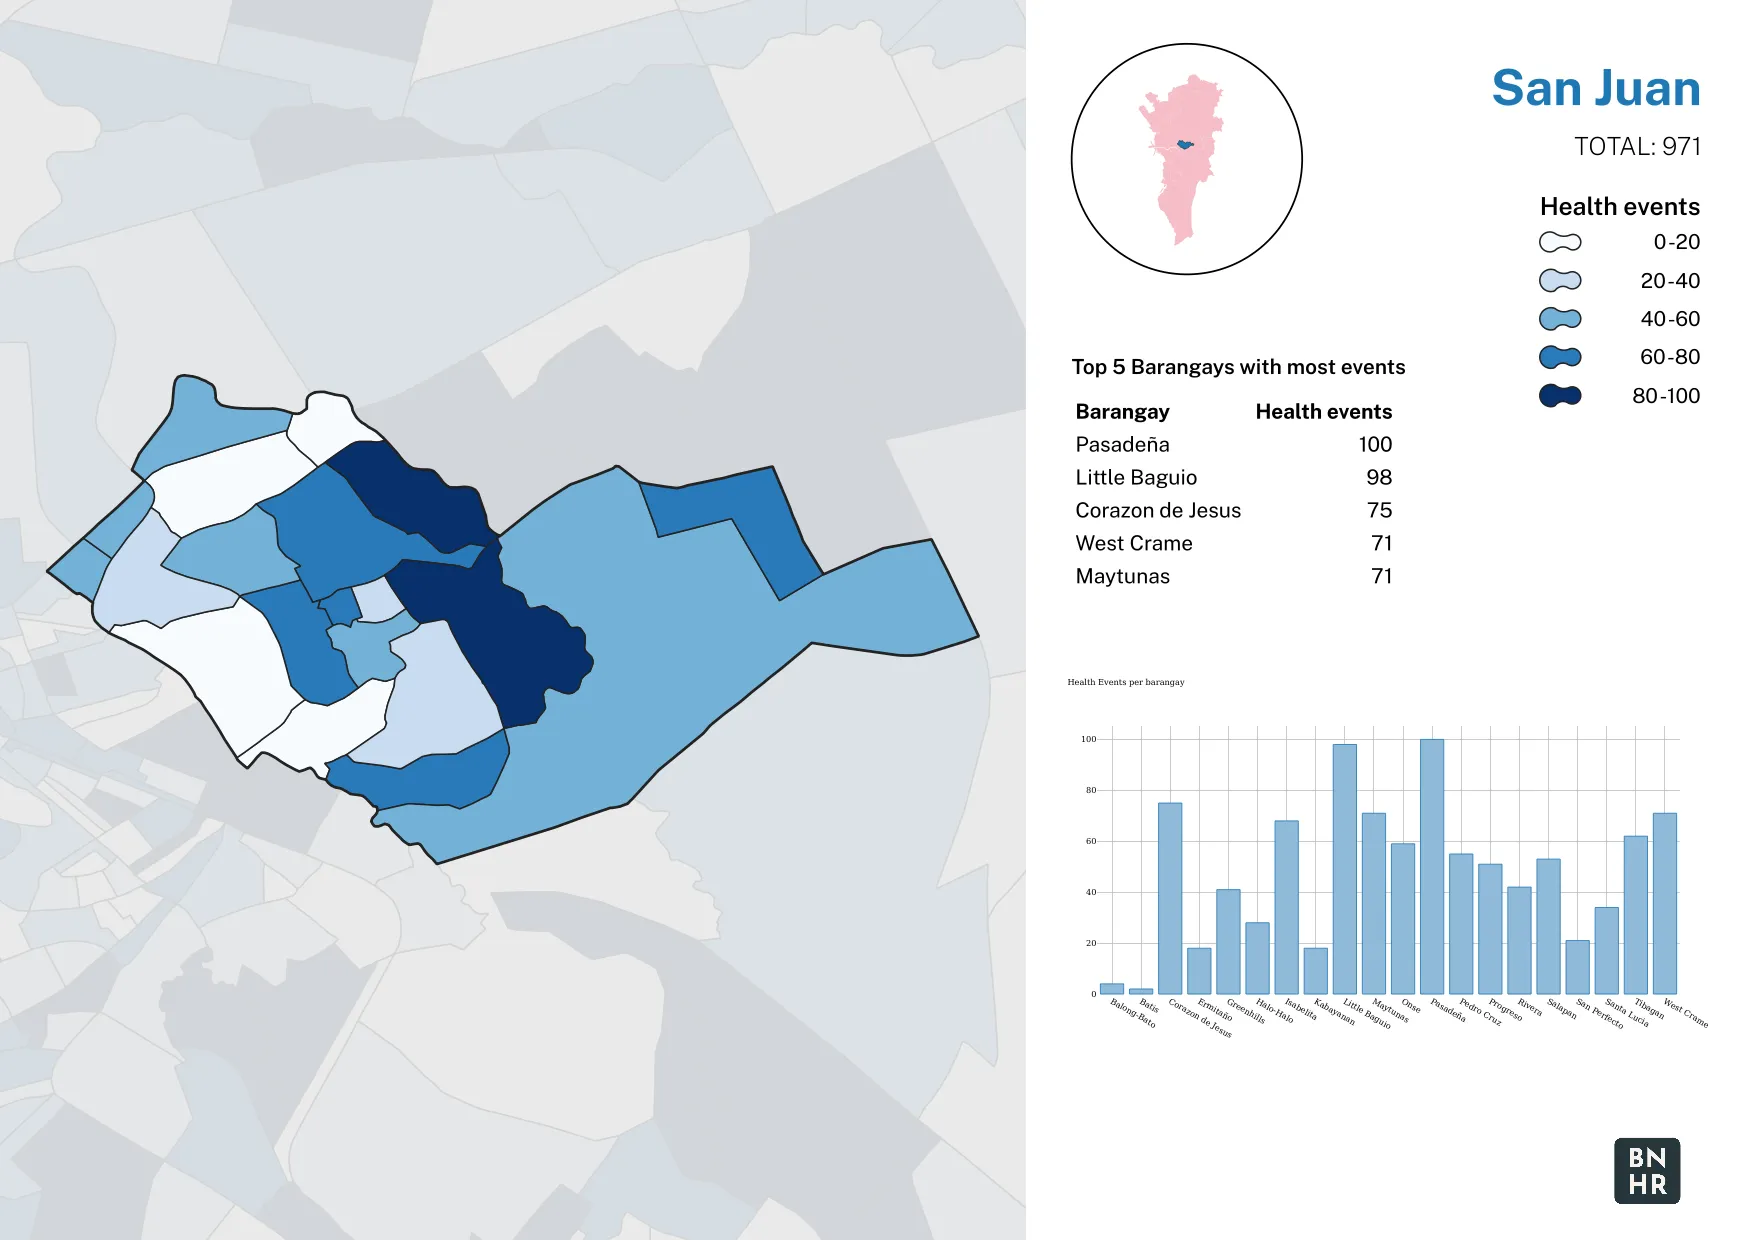
Certification and support
Section titled “Certification and support”Contact us or sign-up to our courses if you are interested in having this as an instructor-led or self-paced course.