
Basic geospatial processing techniques
Introduction
Section titled “Introduction”This module is designed to teach you the basics processing geospatial data in QGIS.
By the end of this module, you should know: what the QGIS processing framework is and how to do simple raster and vector processing.
What you should already know
Section titled “What you should already know”Since this is a beginner module, no previous knowledge of GIS or QGIS is required. However, familiarity with the QGIS interface (as discussed in Introduction to QGIS) and how to load different kinds of layers (as discussed in Introduction to Layers in QGIS) are preferred.
The QGIS Processing Framework
Section titled “The QGIS Processing Framework”The QGIS Processing Framewok is a powerful tool inside QGIS that will allow you to do a variety of geoprocessing tasks. It provides you access a variety of algorithms and tools—including spatial analysis, geometry processing, and data management tools—that you can utilize in QGIS.
The Processing Framework is designed to be extensible, meaning that developers can create their own custom processing algorithms and make them available to users. This allows for a highly flexible and customizable workflow for users.
It also supports batch processing, which allows users to apply processing algorithms to a large number of datasets in a single operation, saving time and effort.
Through the QGIS Processing Framework, QGIS is also able to interface with other GIS and geospatial applications—essentially enabling QGIS to use the processing algorithms of these external applications.
When thinking of the QGIS Processing Framework, you can think of it being composed of:
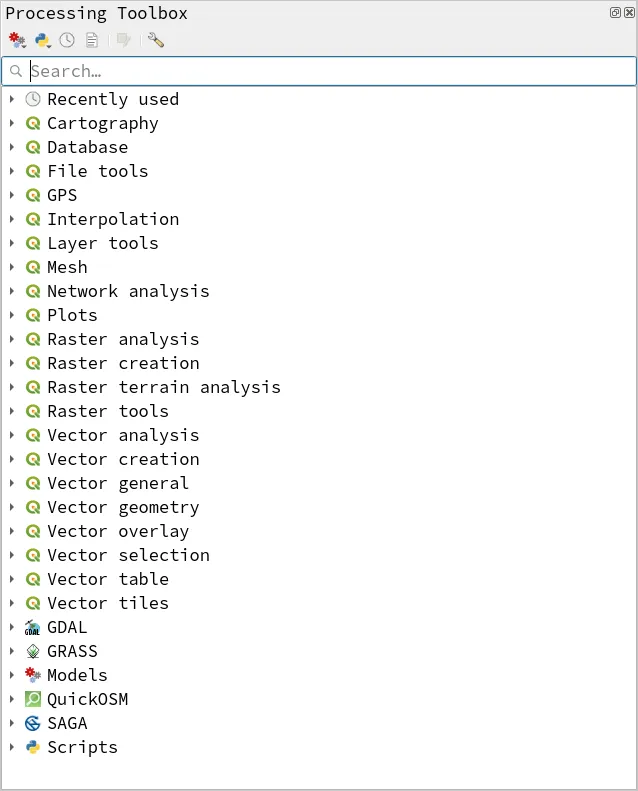
- Processing Toolbox (View ‣ Panels ‣ Processing Toolbox)
- Processing Providers
- GDAL, GRASS, SAGA, OTB, etc.
- Processing scripts and plugins
- Models and Model Designer
It’s important to know and utilize the Processing Framework because Processing algorithms that are part of the processing framework can be:
- Used in the Model Designer
- Used via PyQGIS
- Run using Batch Processing
How to find processing algorithms
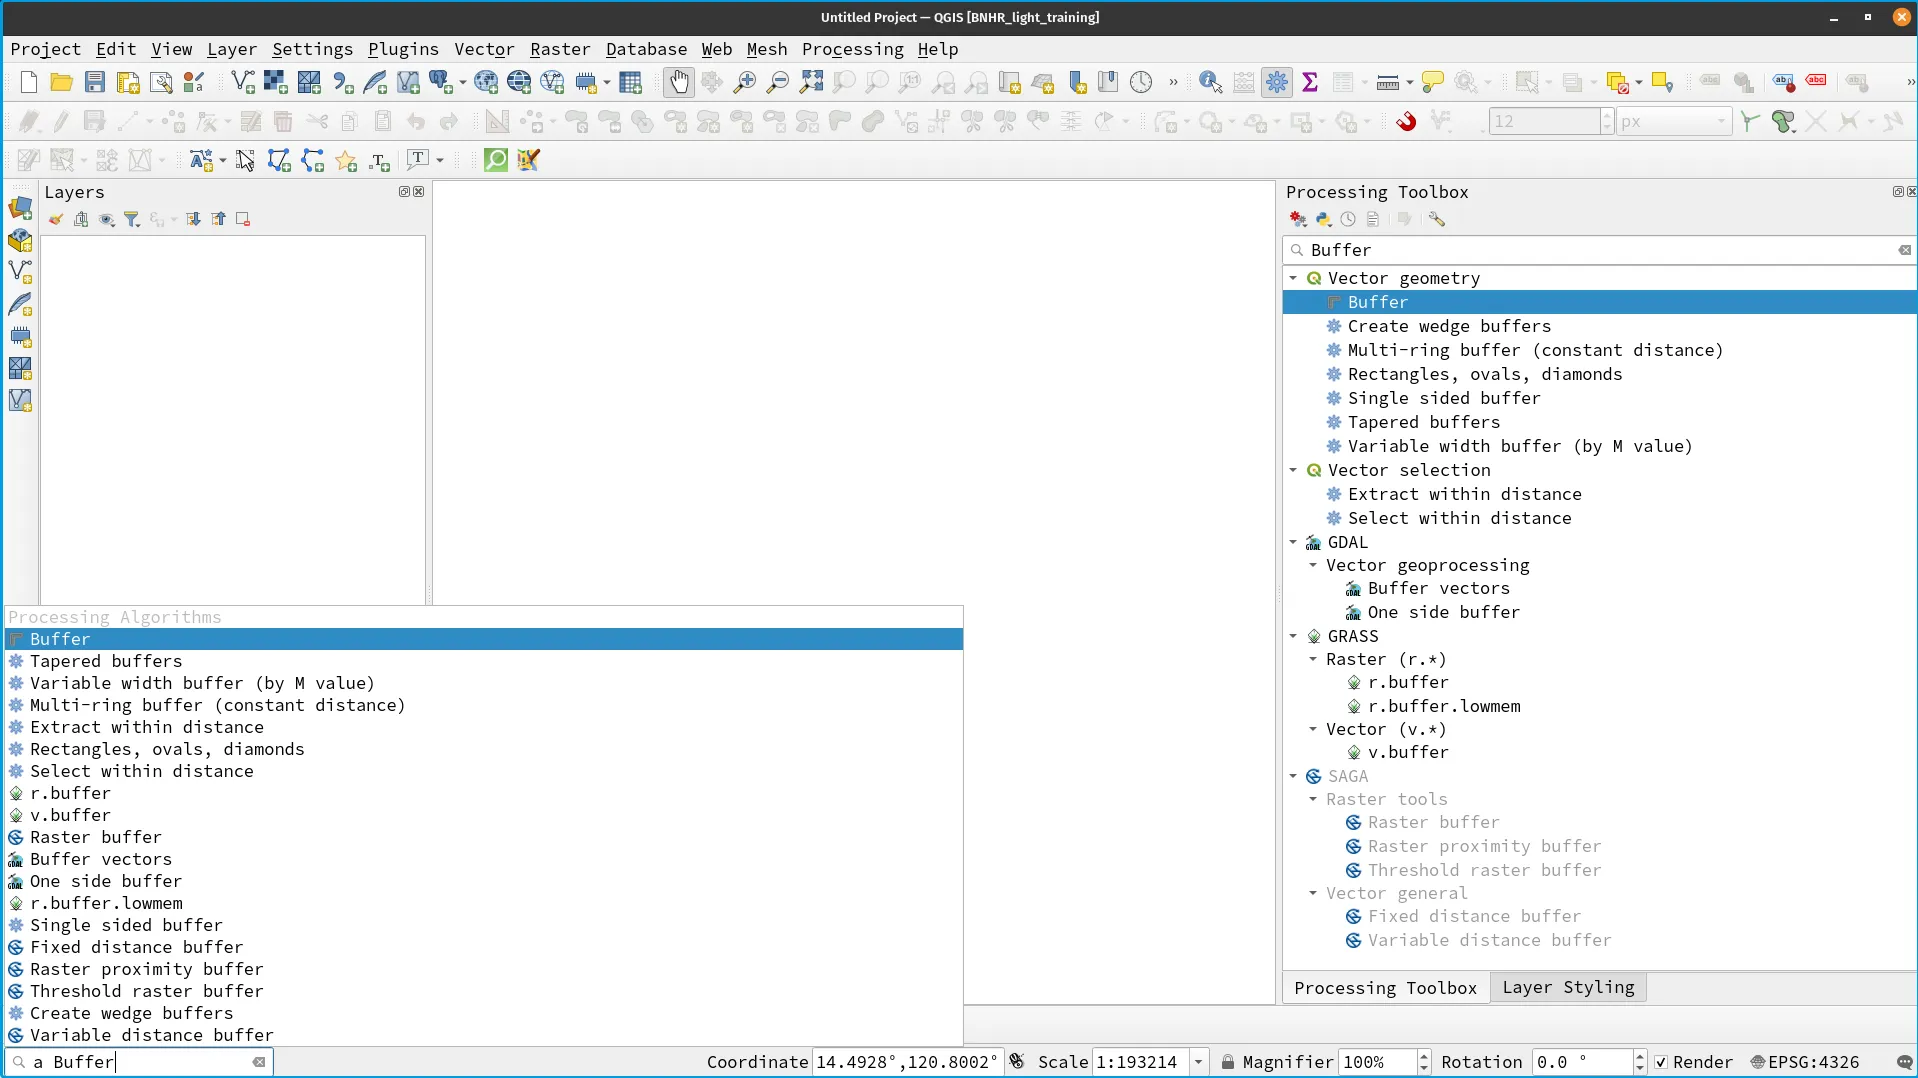
Section titled “How to find processing algorithms”There are many ways to find and run processing algorithms in QGIS. The three most common ones are:
- Searching the Menu bar
- Searching the Processing Toolbox
- Using the Locator bar
- Using the shortcut CTRL+ALT+T
Adding more processing
Section titled “Adding more processing”You can have more processing algorithms in QGIS by adding processing providers, processing scripts, processing plugins, and models. You can even create these yourself and share it with others.
Processing Providers
Section titled “Processing Providers”Processing providers are other applications (mostly other FOSS4G applications) that allow for their algorithms to be used in QGIS and the QGIS processing framework. This includes other powerful geospatial applications such as GRASS, SAGA, R, Orfeo ToolBox, WhiteBoxTools, and many more.
Processing scripts and plugins
Section titled “Processing scripts and plugins”QGIS also allows the use of plugins and scripts within the Processing Framework. These plugins and scripts can be used within a model, batch process, or another script, providing more powerful and scalable capabilities than stand-alone plugins that do not interact with the QGIS processing framework.
Models
Section titled “Models”You can also create re-usable models using the Graphical Modeler or model builder in QGIS. If an algorithm is part of the QGIS processing framework, it can be utilized in the Graphical modeler. As such, models—which are part of the framework—can also be used inside other models.
Python scripts
Section titled “Python scripts”Custom python processing scripts are also avaiable as part of QGIS’ processing framework.
Basic vector processing
Section titled “Basic vector processing”Reprojecting vectors
Section titled “Reprojecting vectors”There are several ways to reproject vectors in QGIS. The simplest is by exporting the layer and setting the new CRS there. Another way is by using the Reproject algorithm.
Merging and splitting vectors
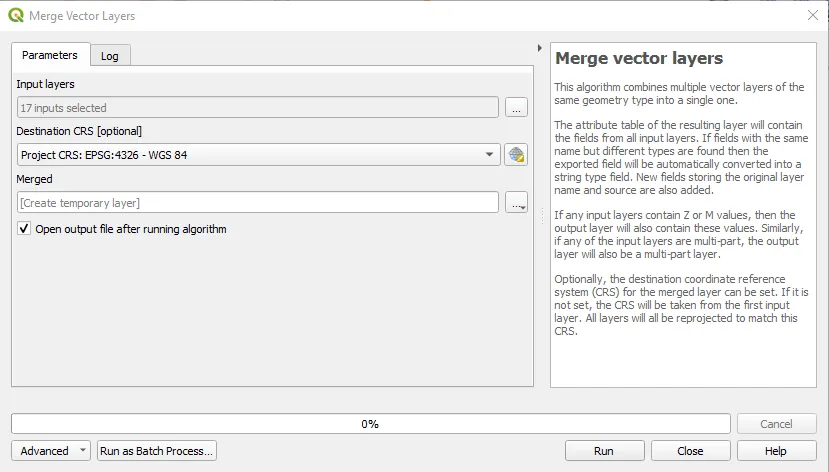
Section titled “Merging and splitting vectors”Let’s play a little scenario. Your boss wants you to create a map analyzing population for the entire NCR but you only have the individual layers for each city and municipality. He asks you to combine these layers into a single layer. You can do this by using the Merge vector layers algorithm.
Merging vectors is a common vector operation that combines several vector layers into one vector layer. This is useful when you want to create a larger dataset from multiple smaller datasets.
The Merge vector layers algorithm of QGIS combines multiple vector layers of the same geometry type into a single one. If attributes tables are different, the attribute table of the resulting layer will contain the attributes from all input layers. New attributes will be added for the original layer name and source.
Exercise 5.1.1. Merge individual city/municipality layers in Metro Manila to a single NCR polygon
Section titled “Exercise 5.1.1. Merge individual city/municipality layers in Metro Manila to a single NCR polygon”| Scenario | You’re a GIS analyst and your boss wants you to create a map showing population for NCR. |
|---|---|
| Data | Individual layers for each city and municipality |
| Steps | 1. Load the individual layers in QGIS 2. Merge individual city/municipality layers in Metro Manila to a single NCR polygon |
| Processing Algorithm | Merge vector layers |
- Load the 17 layers for each of the cities and municipality in NCR.
- Open the Merge vector layers by searching in the Locator Bar (CTRL + K) or via Vector ‣ Data Management ‣ Merge vector layers in the Menu bar
- Click on the Input layers and select the 17 layers you loaded. If you already loaded the aforementioned layers in QGIS, you may select them directly in the selection window that appears. If not, you can add them by using the Add File(s)… or Add Directory… buttons.
- Click Run.
- You should see a layer named Merged added to the Layer panel. Rename this layer to ncr_municities.
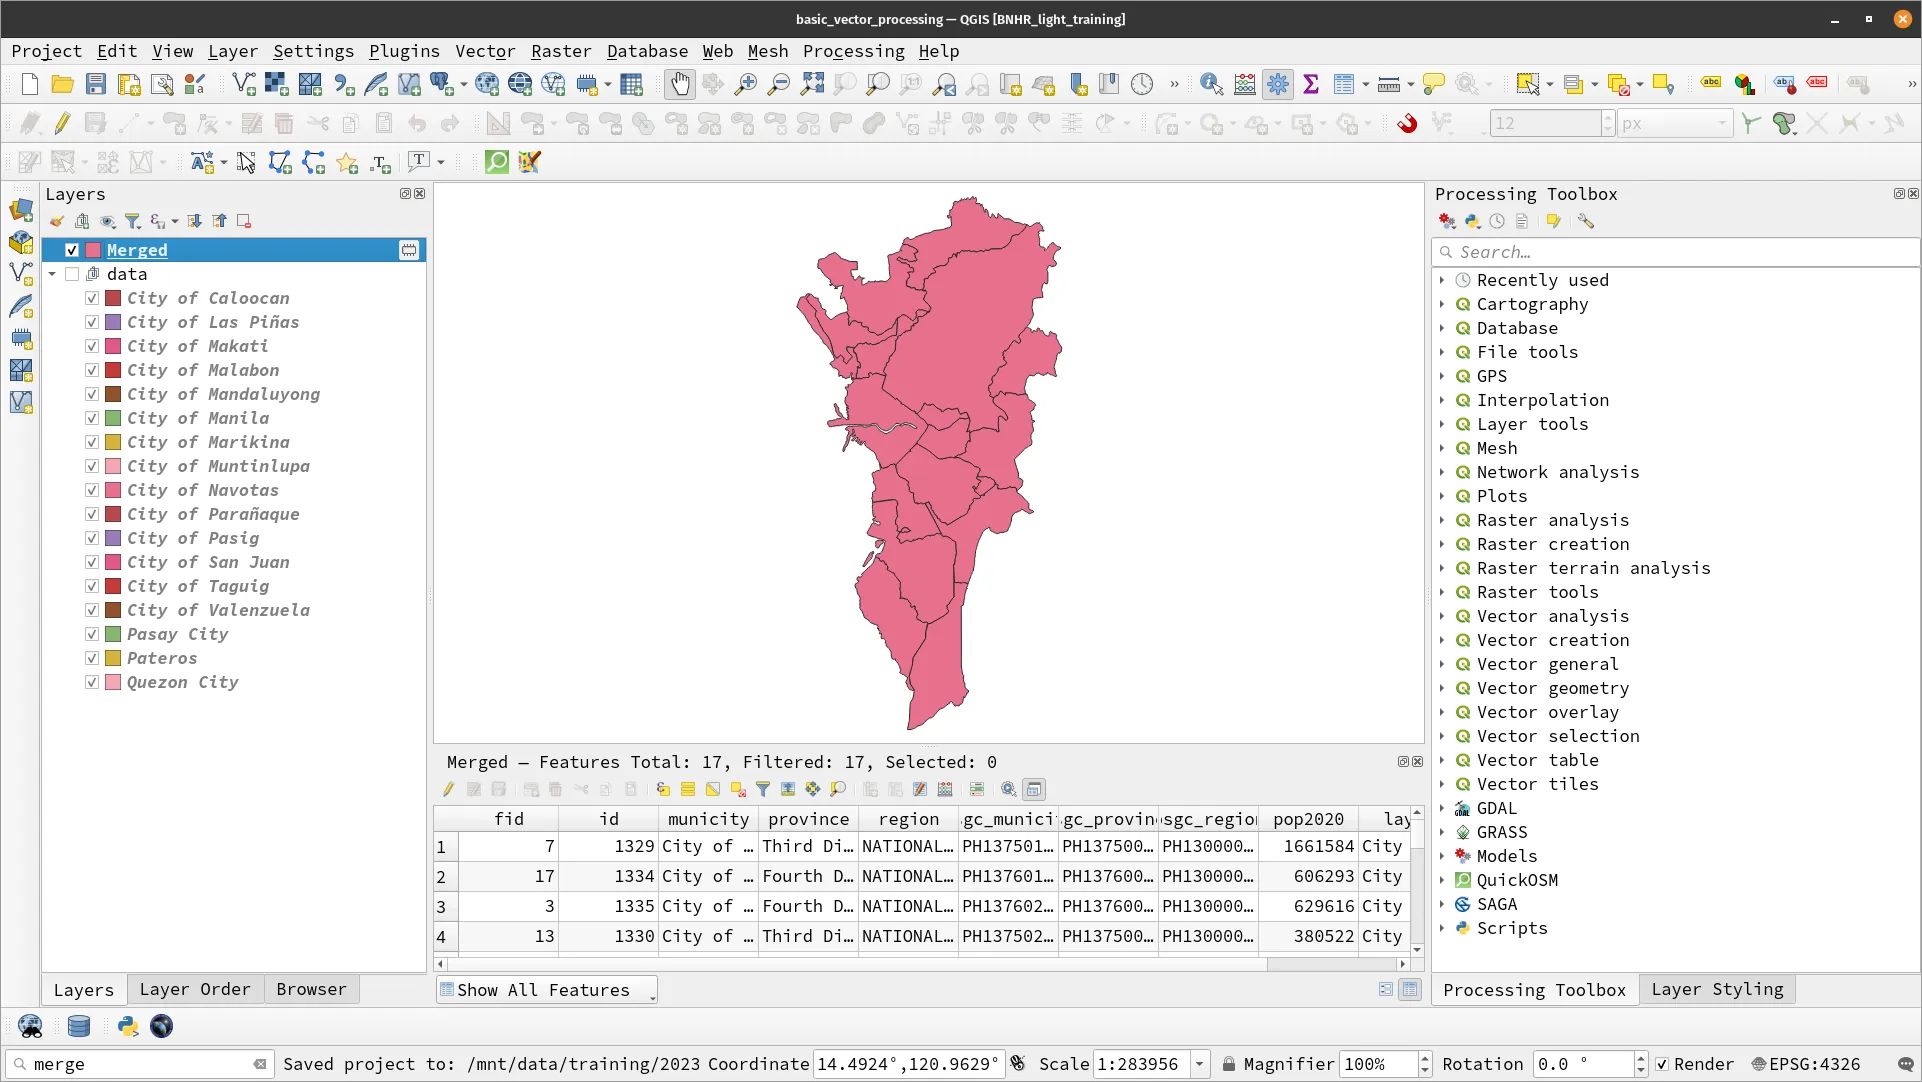
If you open the attribute table of this layer, it should have the same attributes as the other 17 layers.
At this point, you may want to save your work as a project (CTRL + S) and use the Memory Layer Saver plugin to make your layers in memory persistent or export your ncr_municities as a vector file (e.g. as geopackage or geojson).
Splitting vectors
Section titled “Splitting vectors”If we can merge vectors, it’s only natural that we can split vectors as well. The Split vector layer algorithm takes a vector layer and an attribute then generates a set of vector layers in an output folder.
- Each of the layers created in that folder contains all features from the input layer with the same value for the specified attribute.
- The number of files generated is equal to the number of different values found for the specified attribute.
Dissolving vectors
Section titled “Dissolving vectors”Great work on merging those vectors! However, your boss forgot to mention that you need to map the districts in NCR and not the cities and municipality. He asks you if you can do that and you say “Of course, there’s a processing algorithm for it.”
The act of dissolving layers involves merging or combining features (geometries) based on their attributes.
The Dissolve algorithm in QGIS Processing takes a vector layer and combines their features into new features. One or more attributes can be specified to dissolve features belonging to the same class (having the same value for the specified attributes), alternatively all features can be dissolved in a single one.
All output geometries will be converted to multi geometries. In case the input is a polygon layer, common boundaries of adjacent polygons being dissolved will get erased.
Exercise 5.1.2. Dissolving then merged NCR polygon to create a per-district layer
Section titled “Exercise 5.1.2. Dissolving then merged NCR polygon to create a per-district layer”| Scenario | Your boss forgot to mention that you need to map the districts in NCR and not the cities and municipality. |
|---|---|
| Data | Layers from last step |
| Steps | 1. Dissolve the merged NCR polygon to create a per-district layer |
| Processing Algorithm | Dissolve |
- Open the Dissolve algorithm from the Locator Bar or via Vector ‣ Geoprocessing tools ‣ Dissolve in the Menu Bar. Notice that if you type Dissolve in the Locator Bar, more than one algorithm might appear — Dissolve using GDAL, Dissolve using QGIS Processing, and v.dissolve if you have GRASS connected to QGIS. For this exercise, let’s use the native Dissolve algorithm
 using QGIS Processing (usually the second in the list).
 - Click on the Dissolve fields option and select province.
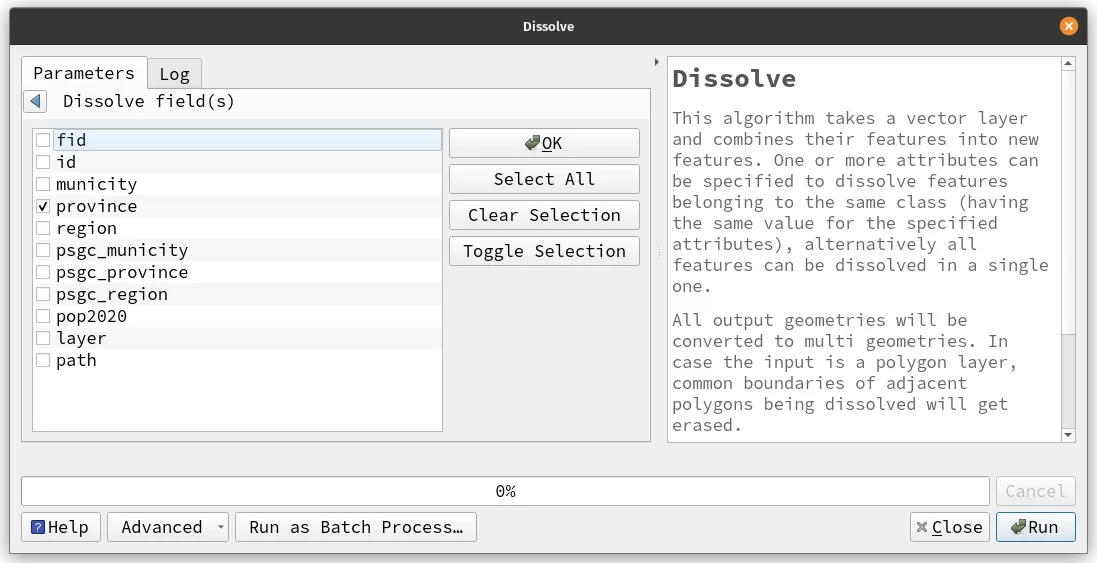
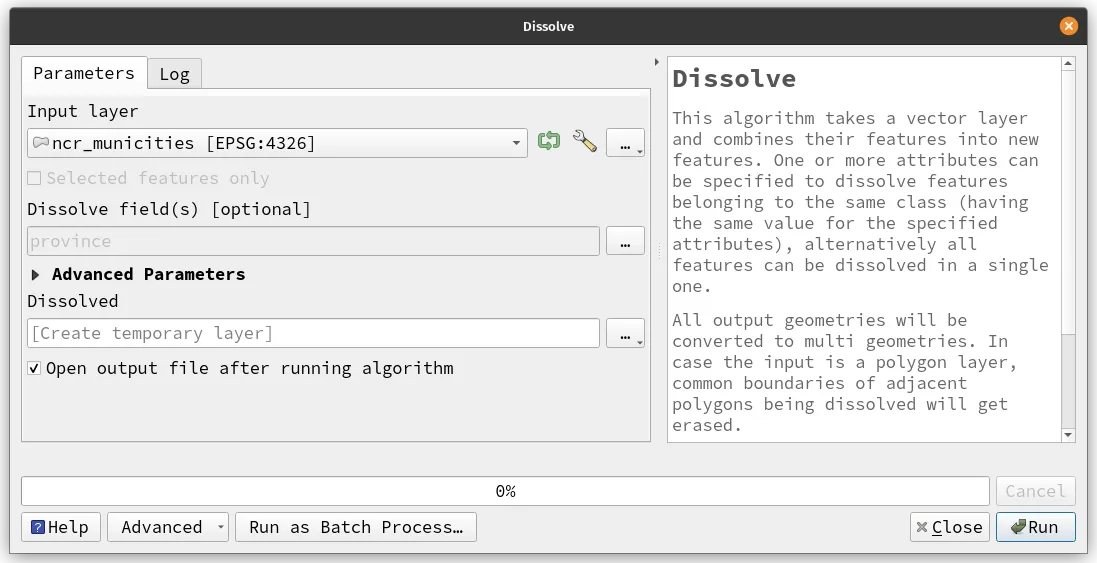
- Click Run.
- You should see a layer named Dissolved added to the Layer panel. Rename this layer to ncr_districts.
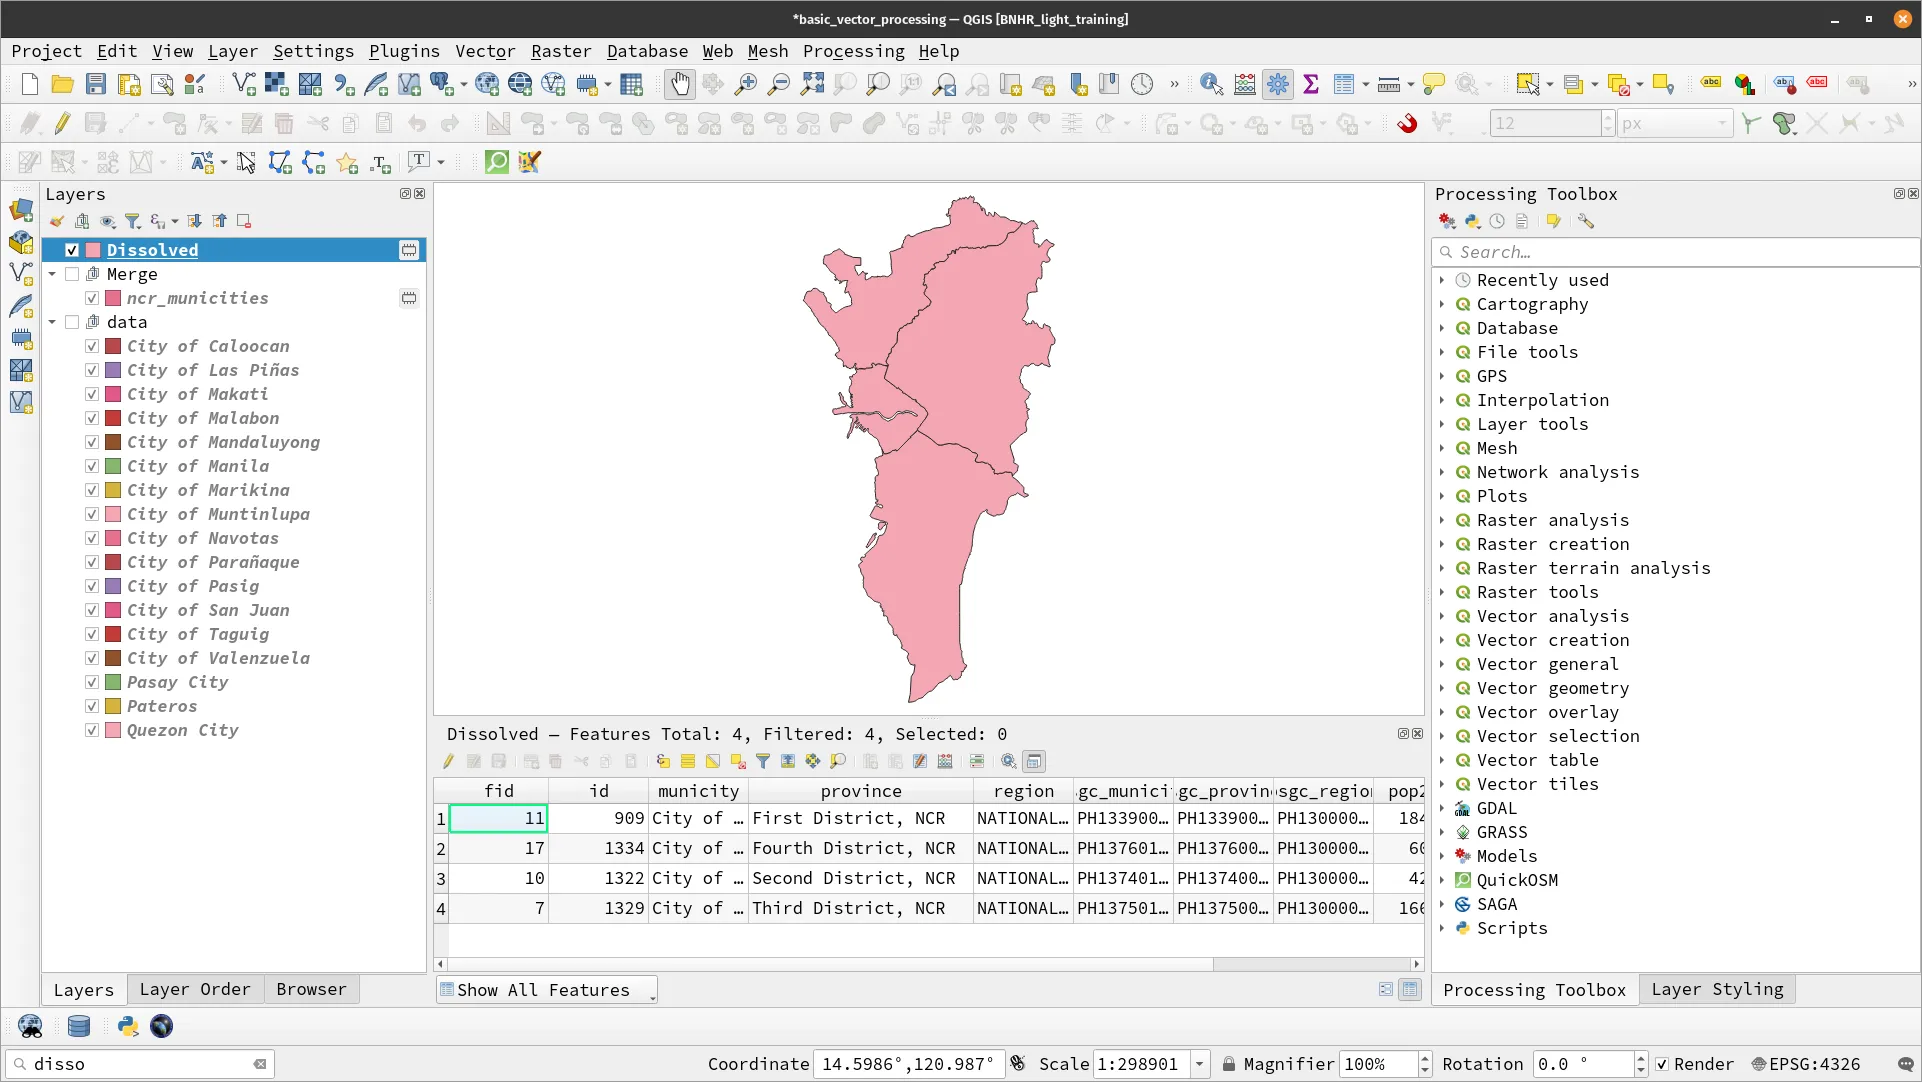
If you open the attribute table of the ncr_districts layer, you might notice that there are still municity and psgc_municity attributes that don’t provide useful information (i.e. the features now correspond to districts and not municities). You may delete or remove these attributes.
Aggregating vectors
Section titled “Aggregating vectors”You send your output to your boss hoping to rest but he sends it back to you immediately. There’s a problem. The goal of your project is to map the population per district but if you check the attribute table of ncr_districts, you will notice the problem. Dissolve combines geometries but does not combine attributes. That’s why the attributes for each feature in ncr_districts only correspond to the first feature in that district (based on the original ncr_municities layer).
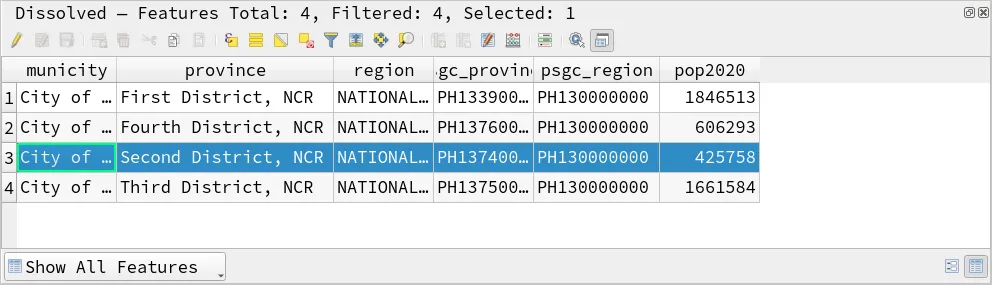
Thankfully, there’s an algorithm that can merge the geometries of a vector layer while also summarizing its attributes—Aggregate.
The Aggregate algorithm can be used to dissolve boundaries, remove overlaps, and merge adjacent polygons while aggregating the attributes associated with each feature. It is commonly used in data preprocessing for spatial analysis as well as for general data management tasks. With the Aggregate algorithm, you can easily summarize data for different levels of analysis such as administrative boundaries or land use types. Additionally, the algorithm can be used in combination with other processing tools, plugins, and scripts to create more advanced data workflows.
Exercise 5.1.3. Aggregating the merged NCR polygon and getting the total population per district
Section titled “Exercise 5.1.3. Aggregating the merged NCR polygon and getting the total population per district”| Scenario | You need to compute the correct population data per district. |
|---|---|
| Data | Merged vector layer |
| Steps | 1. Aggregate the merged NCR polygon using the district field to create a per-district layer with aggregated (sum) of population |
| Processing Algorithm | Aggregate |
- Open the Aggregate algorithm from the Locator Bar or via Processing Toolbox.
- Remove other unnecessary fields by selecting them and clicking the
 symbol.
 - Apply the following parameters.
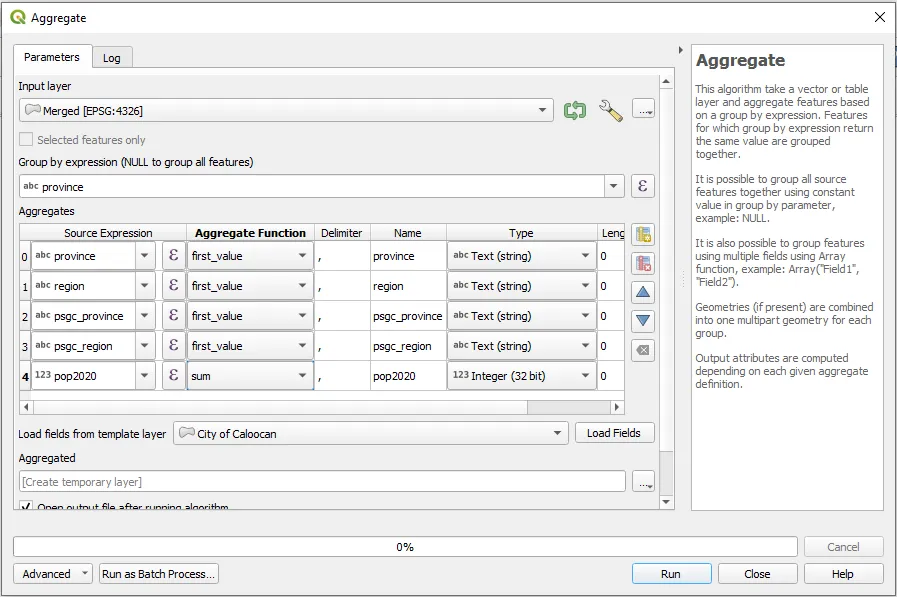
- Click Run.
- You should see a layer named Aggregated added to the Layer panel. Rename this layer to ncr_districts_pop.
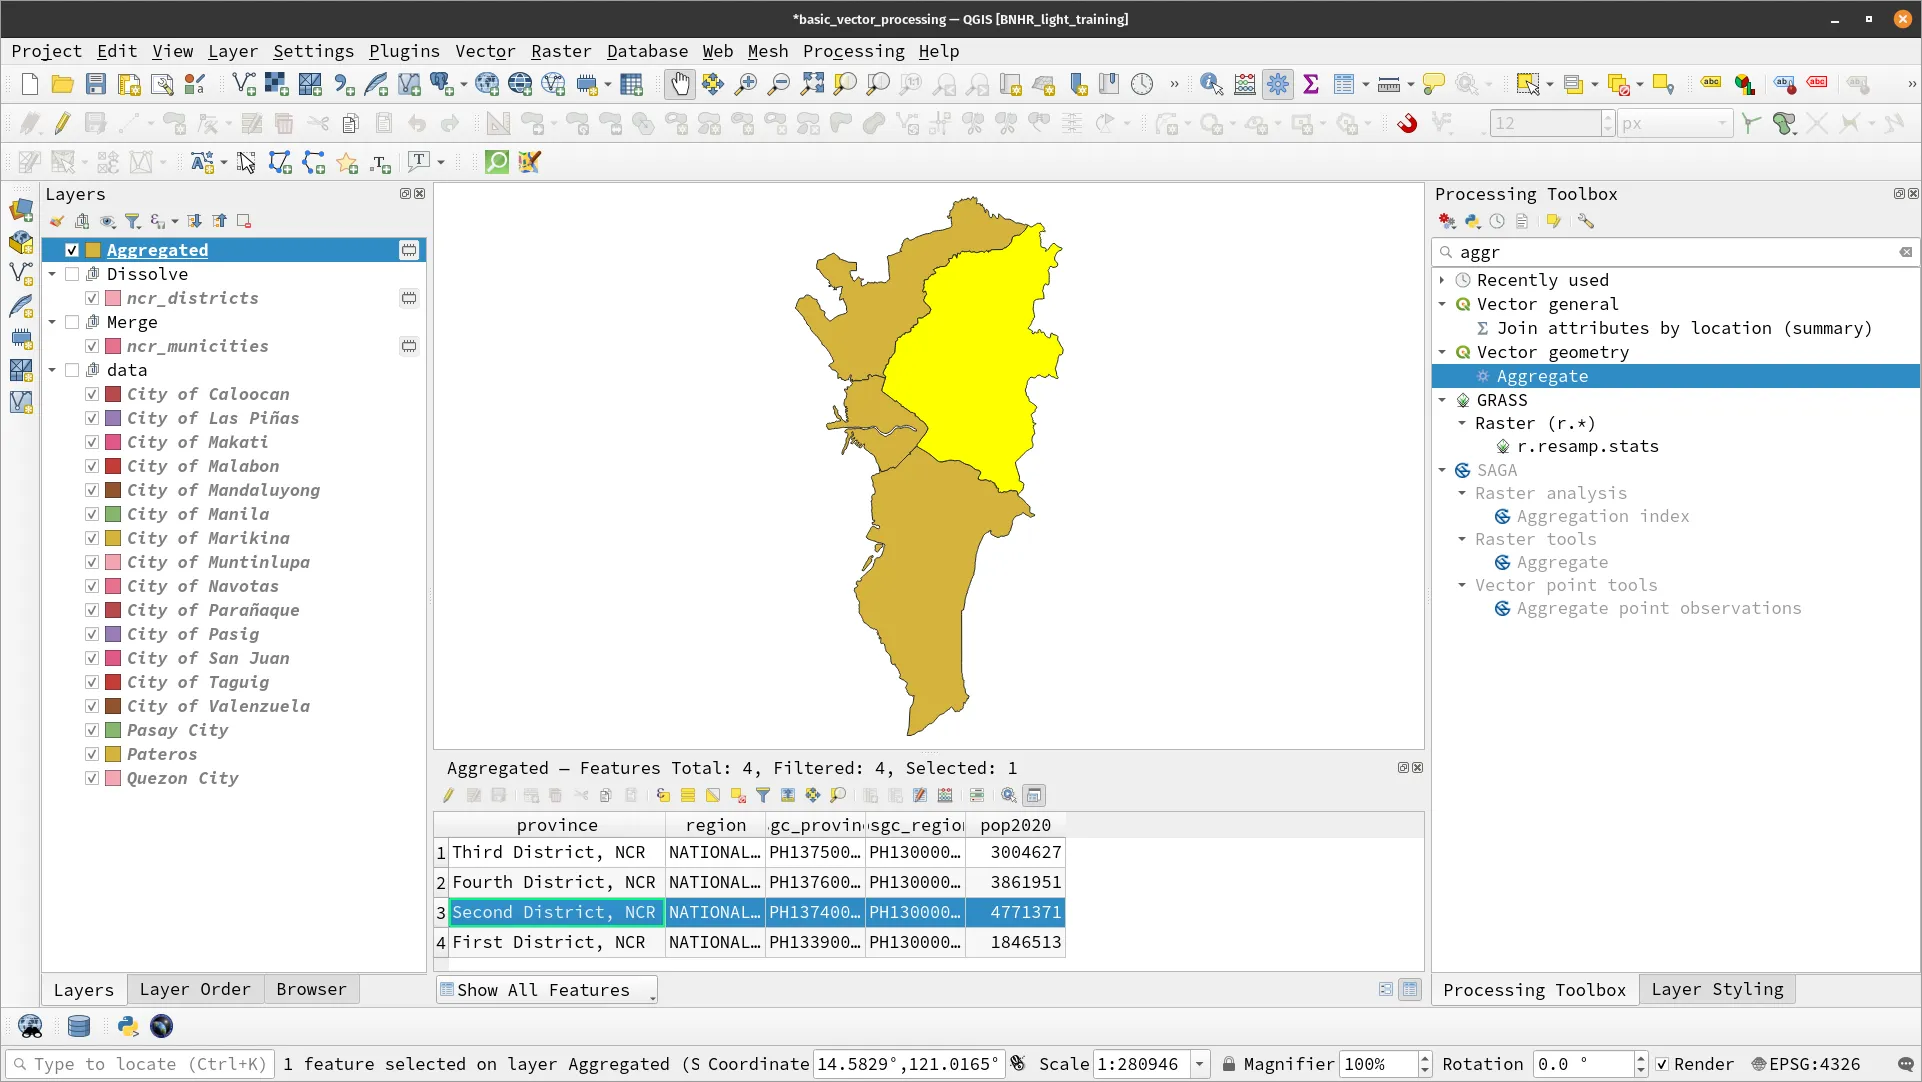
Congratulations! You now have the layer you need to map the population per district in NCR!
Interpolation
Section titled “Interpolation”One last request from your boss. You have data estimating the population density at certain points in Metro Manila and you need to interpolate the data in order to create a map for the entire region.
Thankfully, QGIS also has a lot of interpolation functions.
Interpolation in QGIS is a process of estimating values for unknown locations based on the values of known locations. It is commonly used in GIS to create continuous surfaces from discrete points or lines. QGIS provides several interpolation algorithms such IDW (Inverse Distance Weighting), kriging, TIN (Triangulated Irregular Network), and more. These algorithms differ in how they interpolate values and their suitability for different types of data.
To perform interpolation in QGIS, you need to have a layer with points or lines containing attribute data to be interpolated. In your case, that would be the points of known population density inside NCR.
You can access the interpolation tools through the Processing Toolbox or the Interpolation plugin. Once you select the appropriate algorithm and specify the input layer, you can set the interpolation parameters such as cell size, distance exponent, and number of neighbors as well as the kinds of output. Interpolation in QGIS can be used in a variety of applications such as creating elevation maps, temperature maps, rainfall maps, and more.
| Scenario | You have data estimating the population density at certain points in Metro Manila and you need to interpolate the data in order to create a map for the entire region. |
|---|---|
| Data | ncr_sampled_popden |
| Steps | 1. Interpolate population density in NCR |
| Processing Algorithm | Heatmap (Kernel Density Estimation) |
Exercise 5.1.4. Interpolating population density in NCR
Section titled “Exercise 5.1.4. Interpolating population density in NCR”- Load the ncr_sampled_popden layer.
- Look for an appropriate interpolation algorithm. In this case, let’s use a simple heatmap or kernel density estimation.
- Add the following parameters:
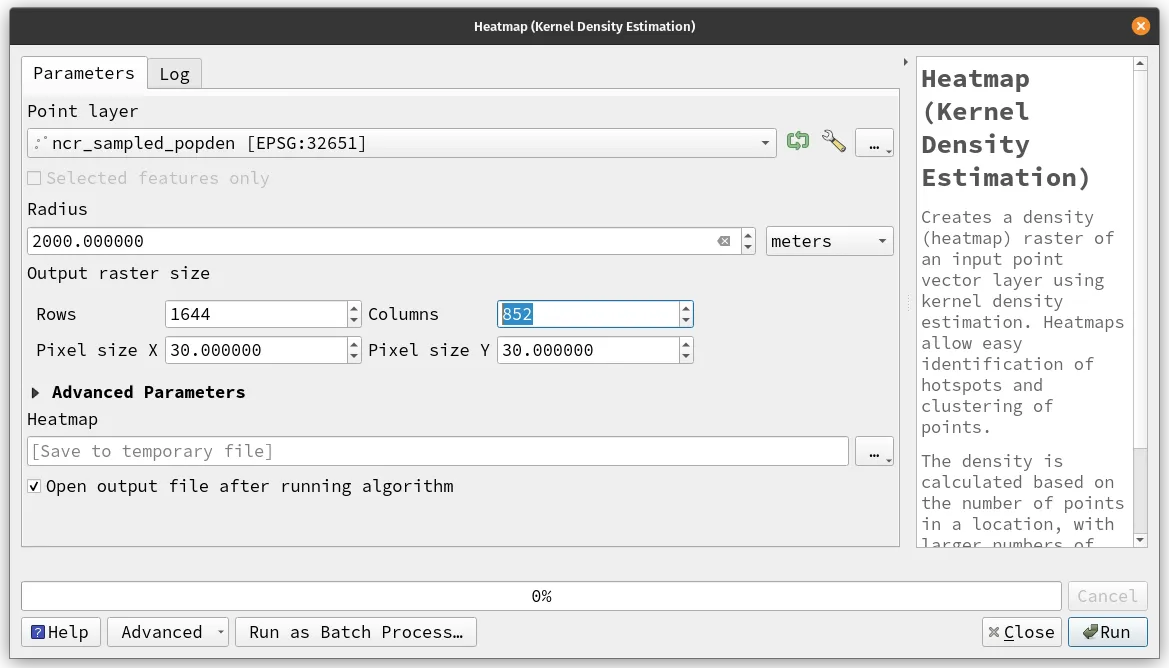
- Click Run.
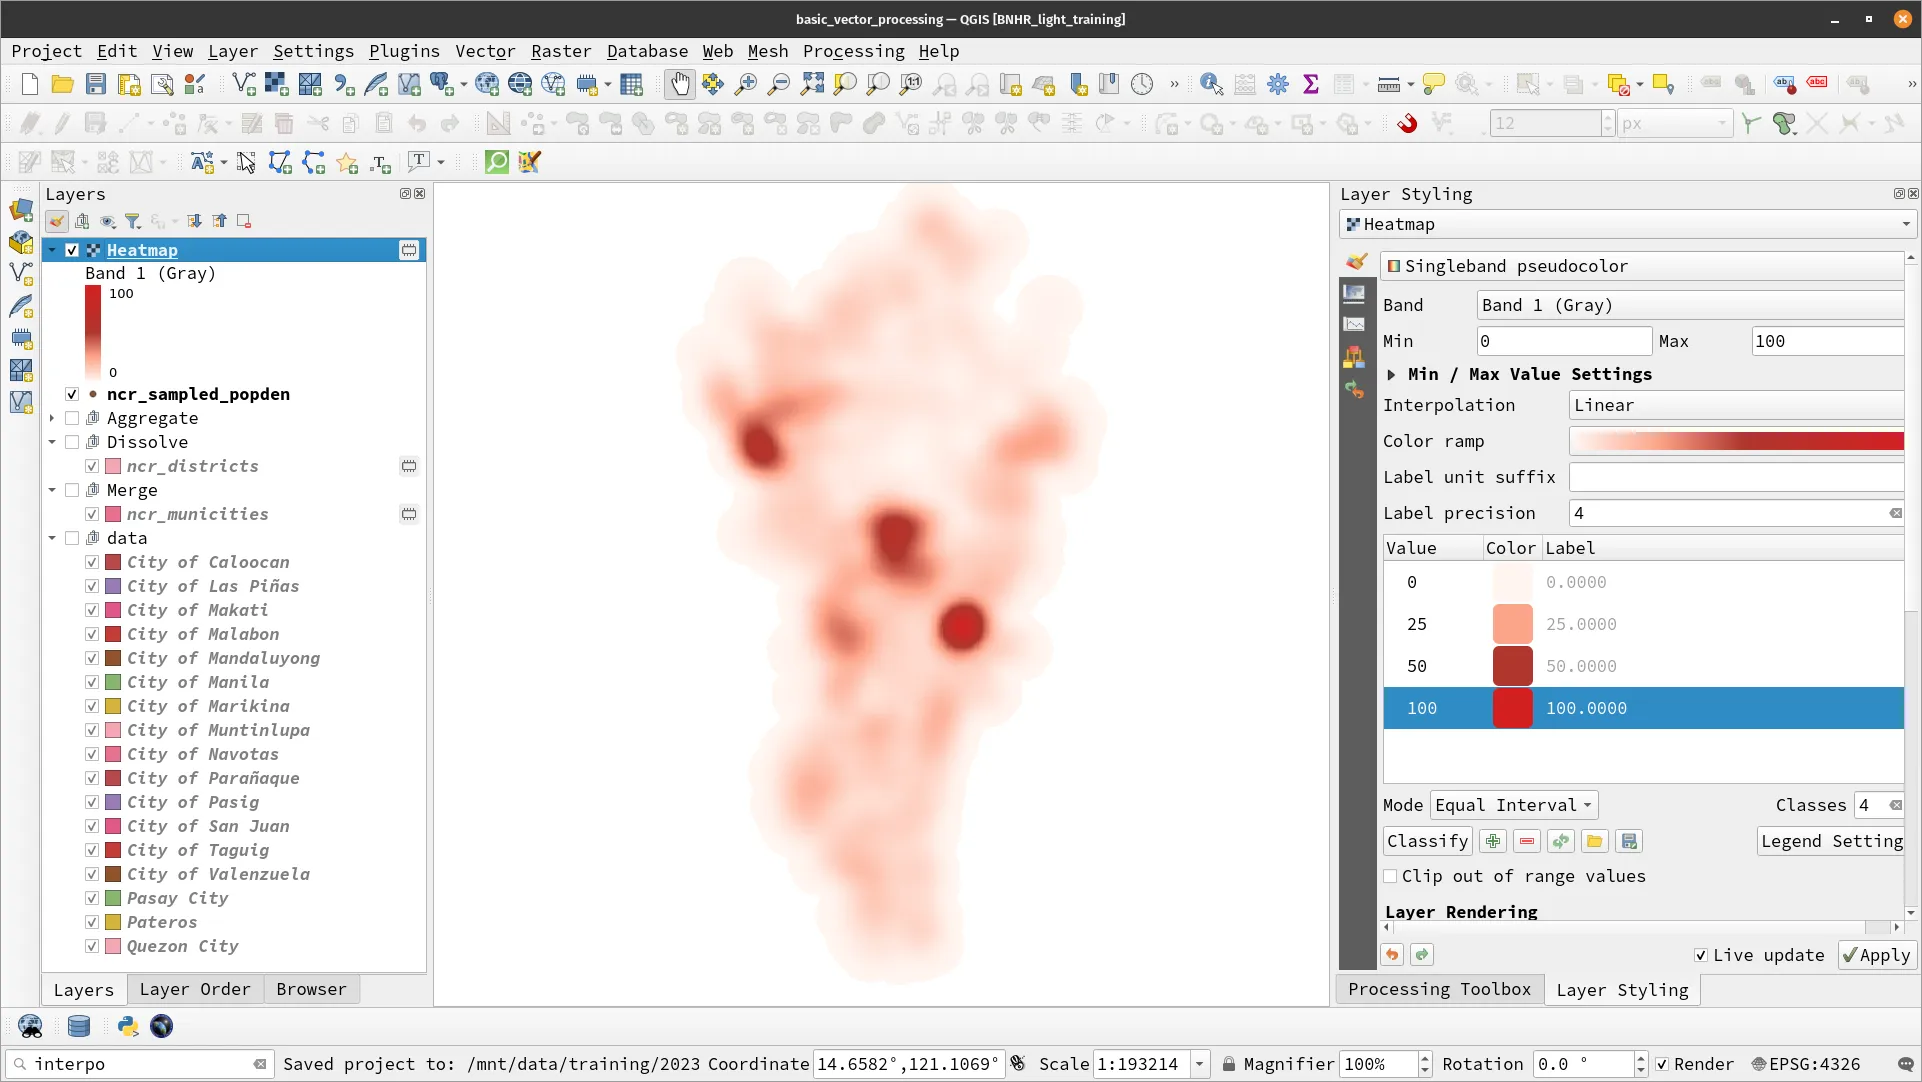
- There should be a new raster named Heatmap in your Layer panel. Rename this to ncr_interpolated_popden
- Style the raster and compare it with the ncr_popden_meta layer from module 4.
Basic raster processing
Section titled “Basic raster processing”QGIS also provides a wide range of raster processing capabilities. You can perform common raster operations such as reclassifying, merging, and clipping. You can also perform more advanced processing like terrain analysis using digital elevation models (DEMs), remote sensing image processing, and raster-to-vector conversion.
For Exercises 5.2.X, you will use the rasters in the data subfolder in the BNHR_QGIS-Essentials_Module_5 folder.
| Scenario | Your boss has another request. This time, you need to work with rasters to output a simple risk map. |
|---|---|
| Data | flood hazard vector (floodhazard insidebnhr_qgis_essentials_05.gpkg) elevation raster (elevation.tif) population density raster (popden.tif) |
| Steps | 1. Load all the layers in QGIS. 2. Rasterize flood hazard layer. 3. Clip the DEM (elevation) to the extent of the flood hazard vector. 4. Reclassify the elevation and population rasters to get standard values (1-3) 4.a. Using the Raster calculator 4.b. Using Reclassify by Table algorithm 5. Compute the risk using a simple R = Hazard * Population * Elevation formula. |
| Processing Algorithm | Clip Rasterize Reclassify Raster calculator |
Reprojecting rasters
Section titled “Reprojecting rasters”Similar to vectors, the simplest to reproject a raster is by exporting the layer and setting the new CRS there. Another way is by using the Warp (reproject) algorithm.
Clipping rasters
Section titled “Clipping rasters”Clipping is a fundamental process in raster analysis that involves extracting a portion of a raster dataset based on a defined boundary or extent. This is a common task when working with large raster datasets that cover a larger area than needed.
Clipping allows you to reduce the size of a dataset, remove irrelevant information, and focus on a specific area of interest.
Exercise 5.2.1. Clipping the elevation raster to the extent of the flood hazard
Section titled “Exercise 5.2.1. Clipping the elevation raster to the extent of the flood hazard”- Load all three layers in QGIS.
- Notice that the area covered by the DEM is relatively larger than the flood hazard layer. Let’s use the flood hazard vector file to clip the DEM so that they have the same extent. This will make our analysis simpler and easier in the next steps.
- Open the Clip raster by extent processing algorithm.
- Use the flood-hazard layer as the Clipping Extent by clicking on the barbeque menu ► Calculate from Layer ► Flood Hazard
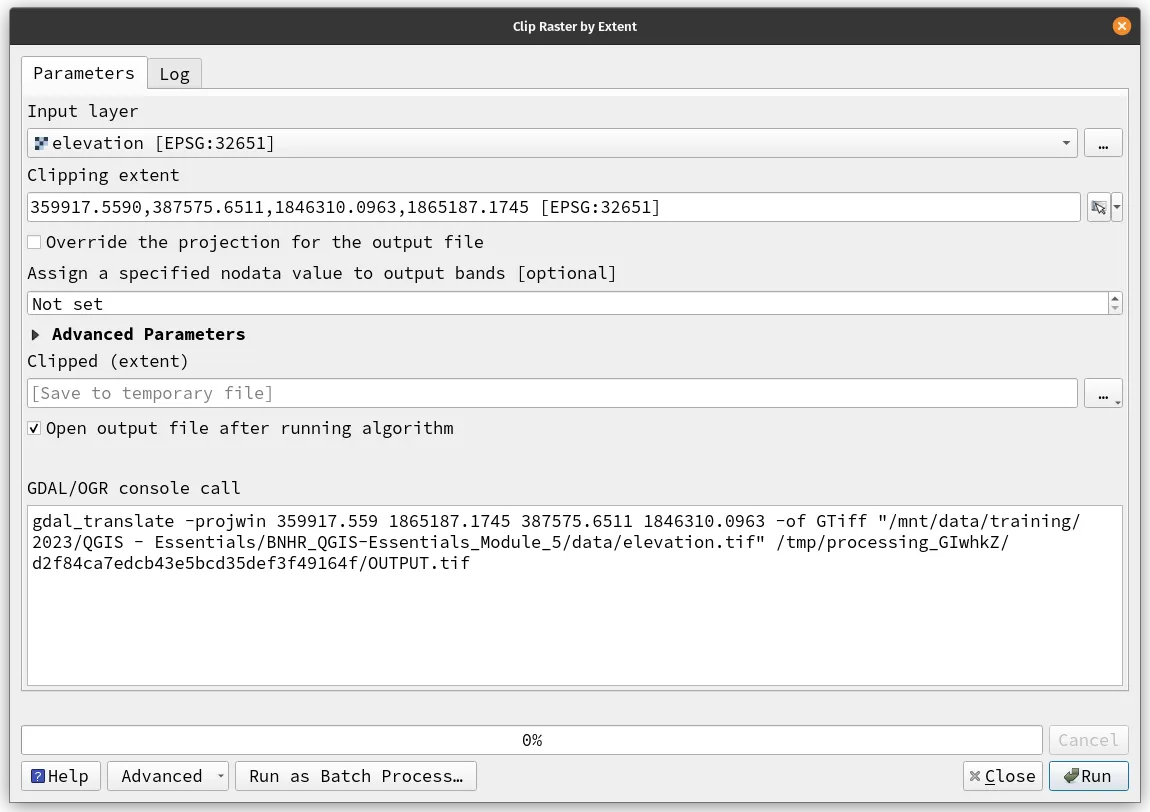
- Notice that both the SRTM layer and the flood hazard layer are in EPSG:32651.
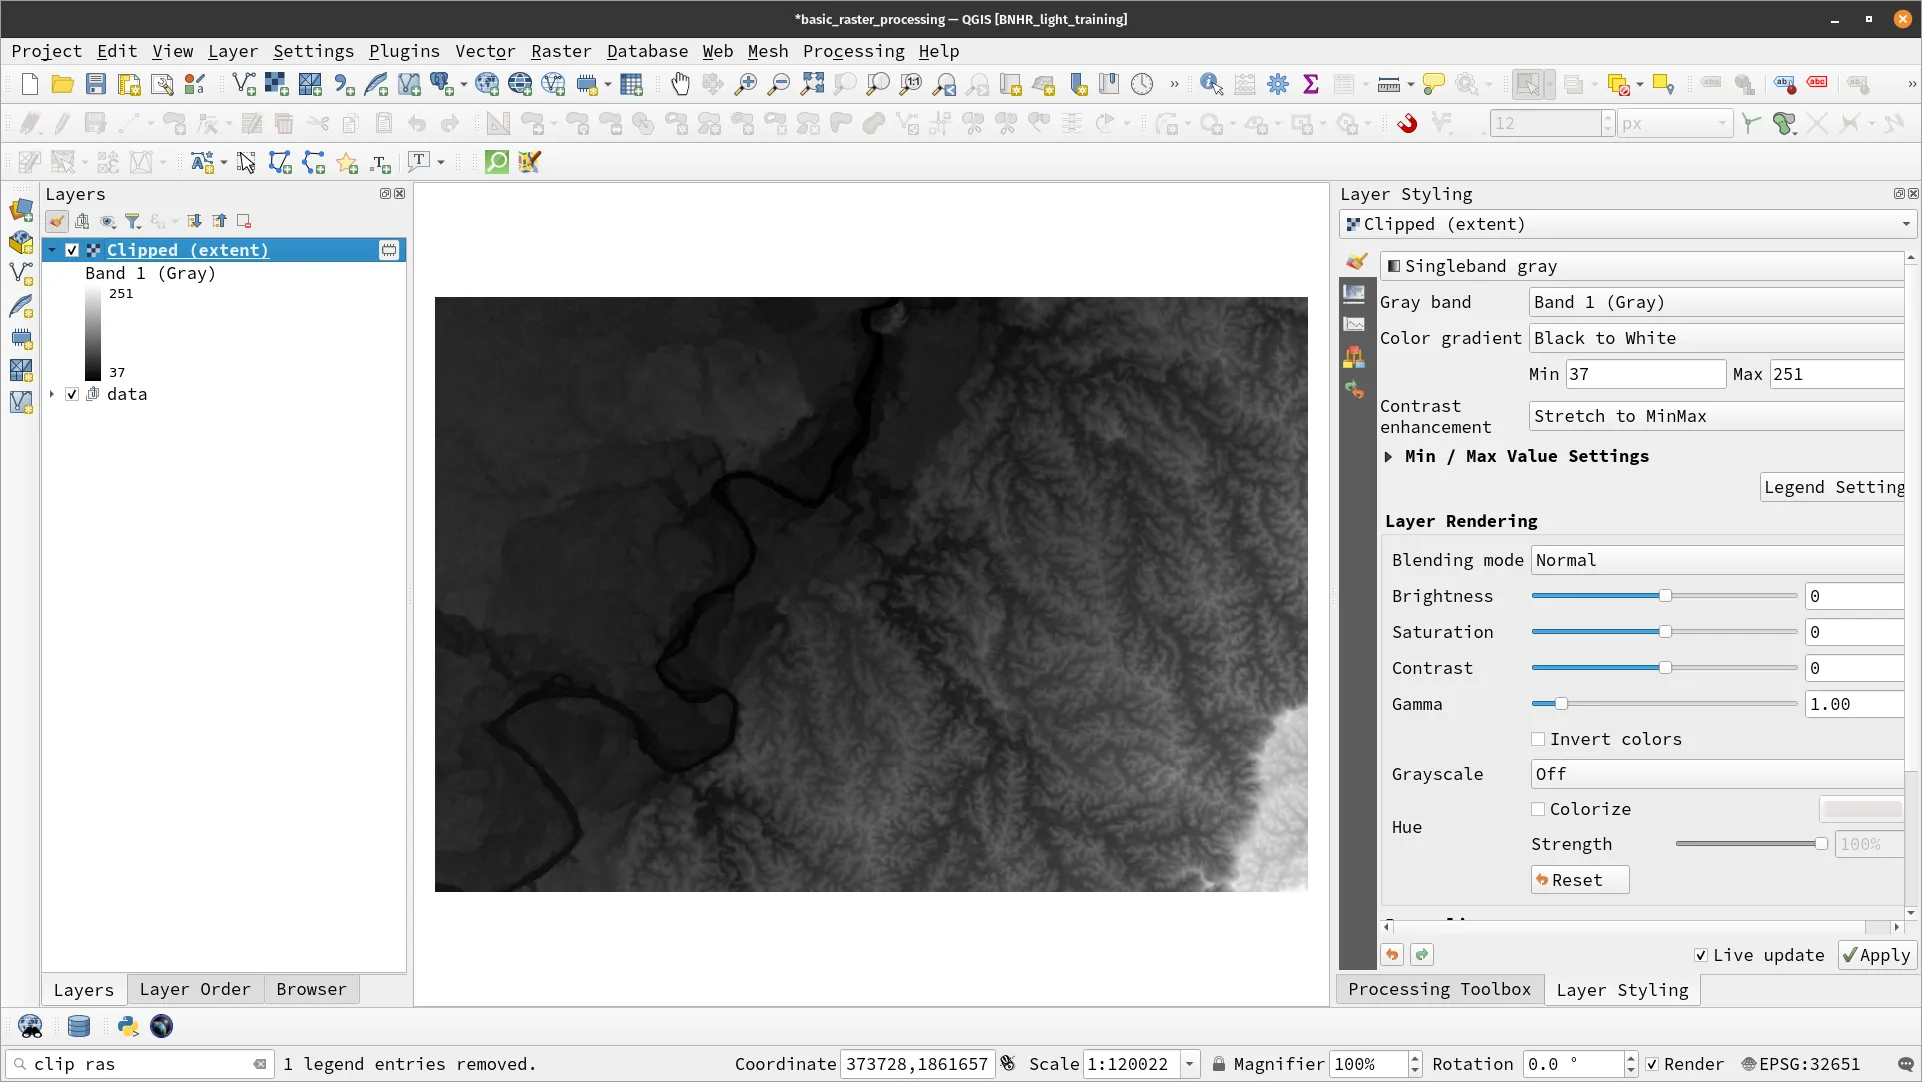
- The output should look like below. Rename the layer clipped-elevation.
Vector to raster conversion
Section titled “Vector to raster conversion”Vector to raster conversion can be useful when working with raster-based algorithms or when a raster dataset is needed for further analysis.
Exercise 5.2.2. Converting the flood hazard vector to a raster
Section titled “Exercise 5.2.2. Converting the flood hazard vector to a raster”- Open the attribute table and take note of the Var and corresponding Hazard Level values.
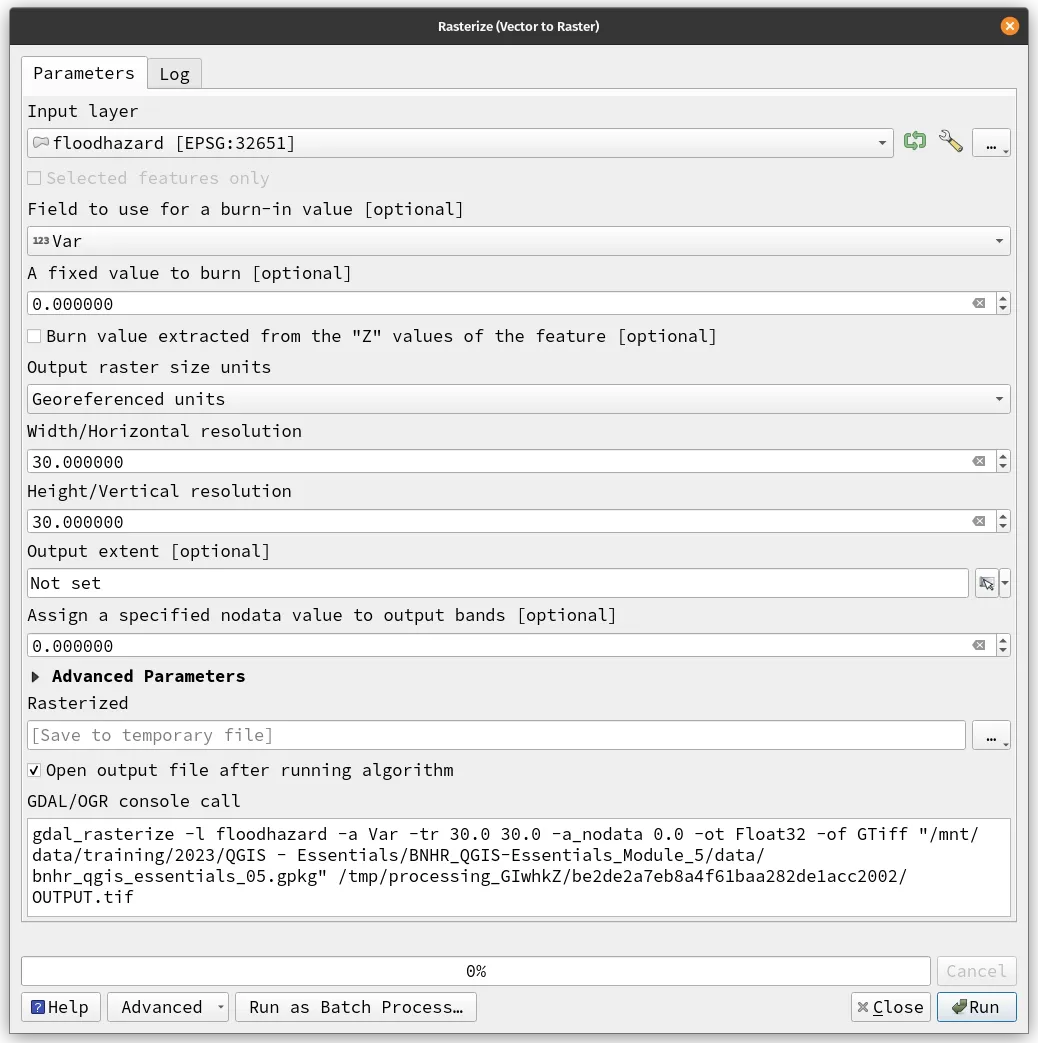
- Open the Rasterize (vector to raster) algorithm. You can also find it at Raster ‣ Conversion ‣ Rasterize
- Add the following parameters.
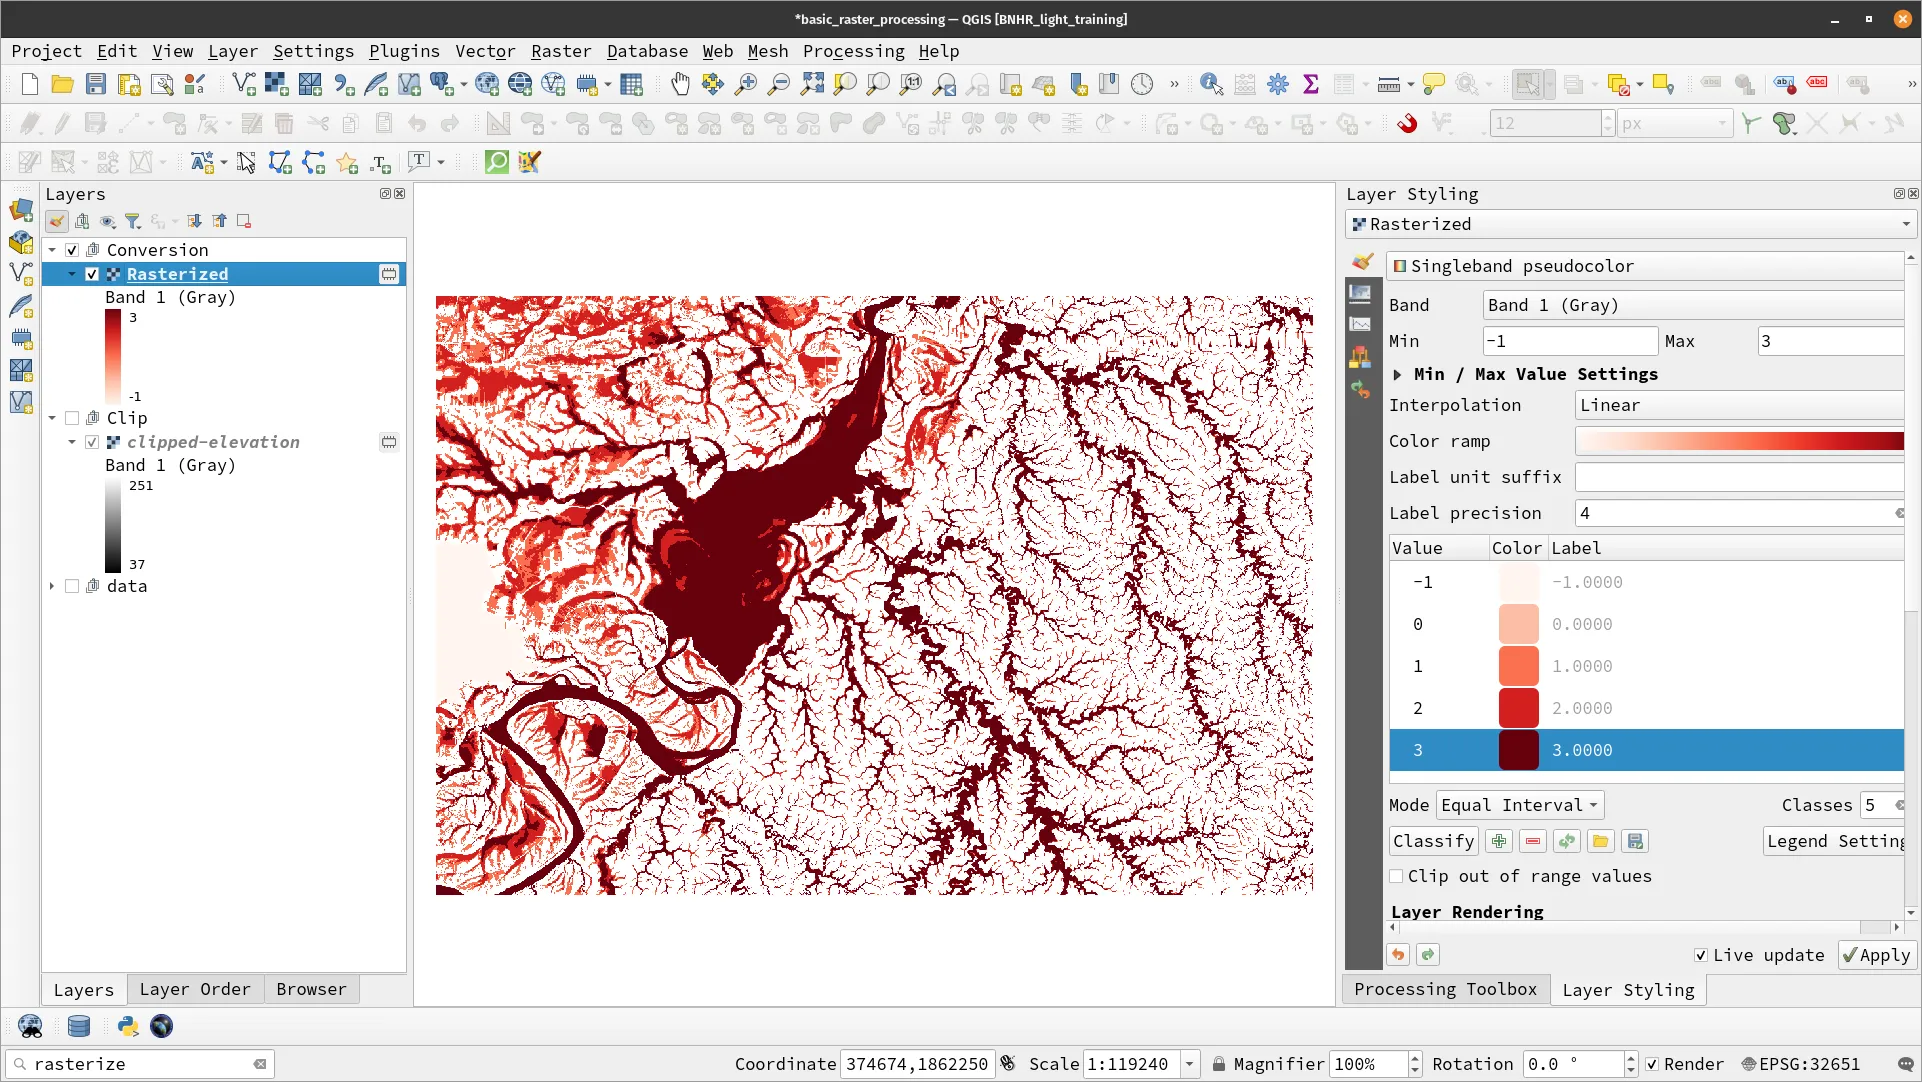
- You should have a Rasterized layer. Rename this to rasterized_floodhazard and apply some symbology. Your map canvas should look like below.
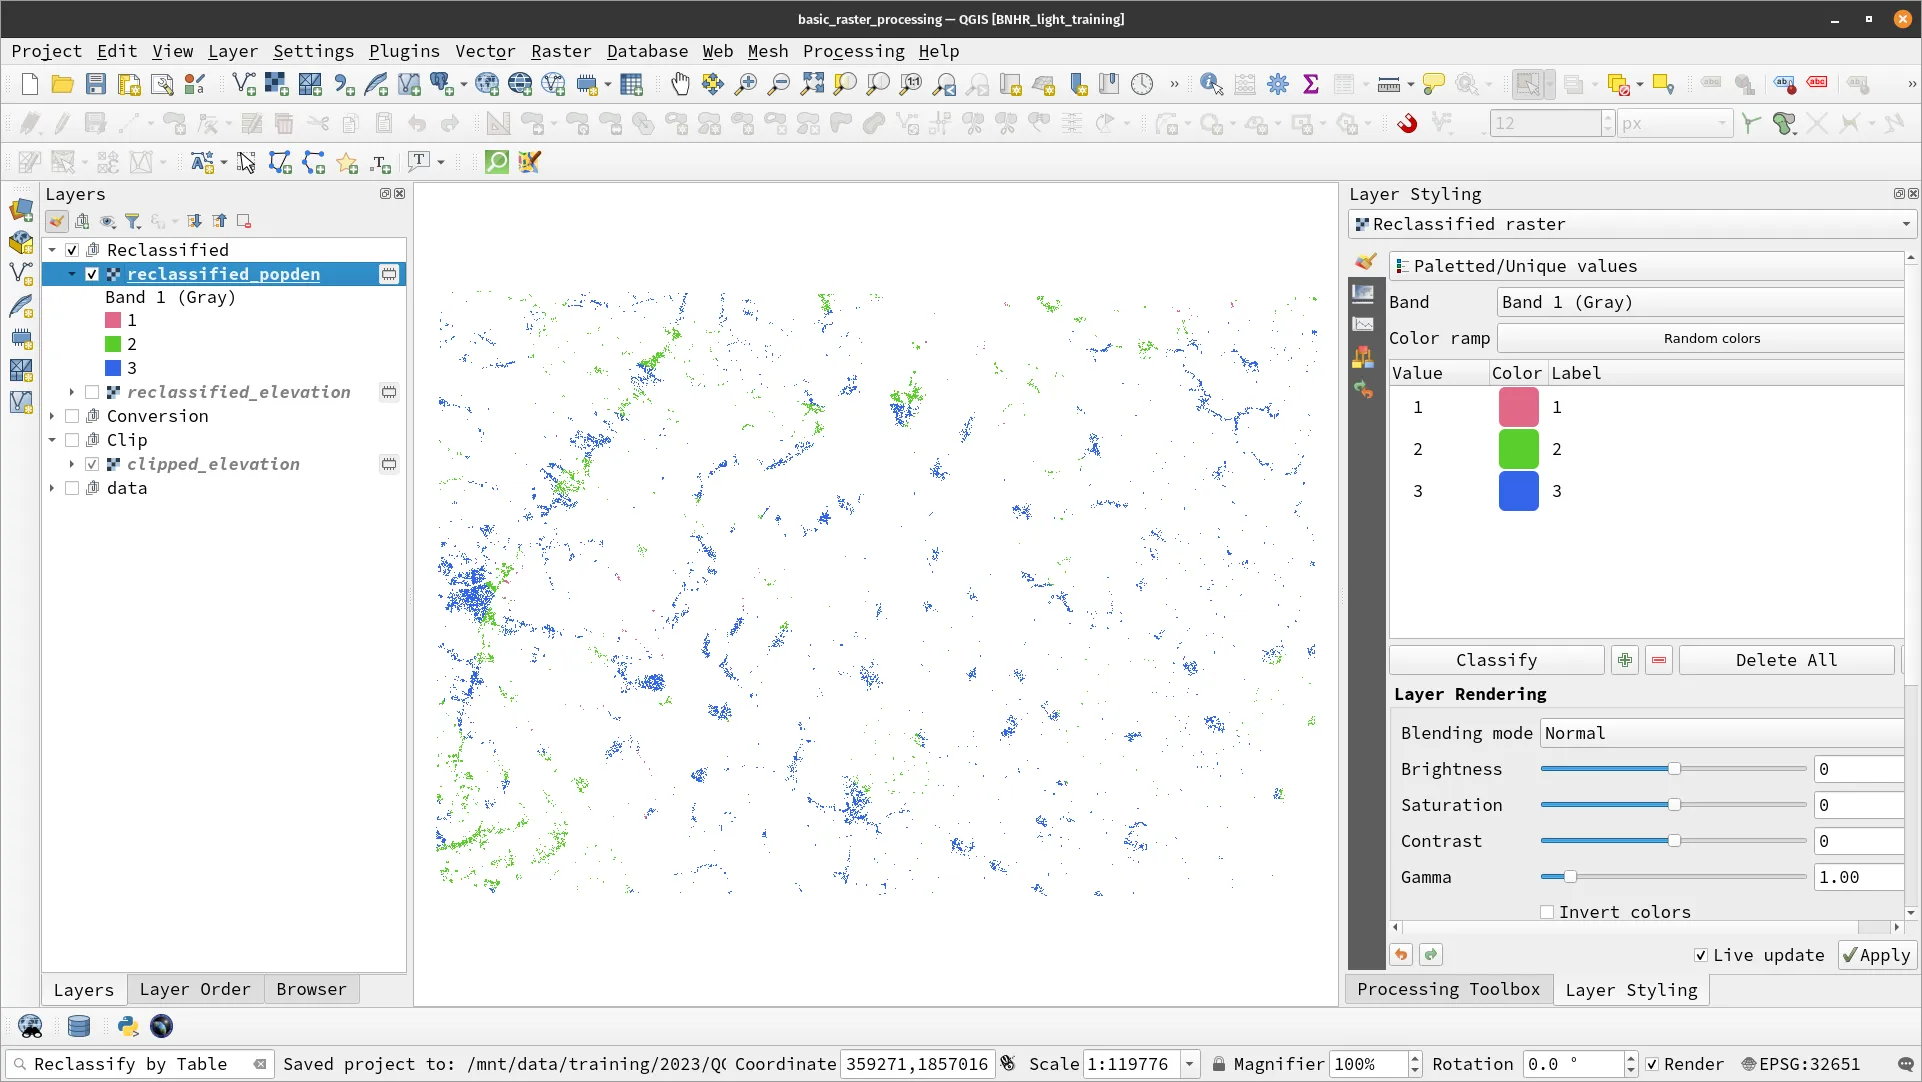
Raster reclassification
Section titled “Raster reclassification”Exercise 5.2.3. Reclassifying the elevation using the Reclassify by Table algorithm
Section titled “Exercise 5.2.3. Reclassifying the elevation using the Reclassify by Table algorithm”Let’s reclassify elevation raster based on its elevation using the Reclassify by table algorithm.
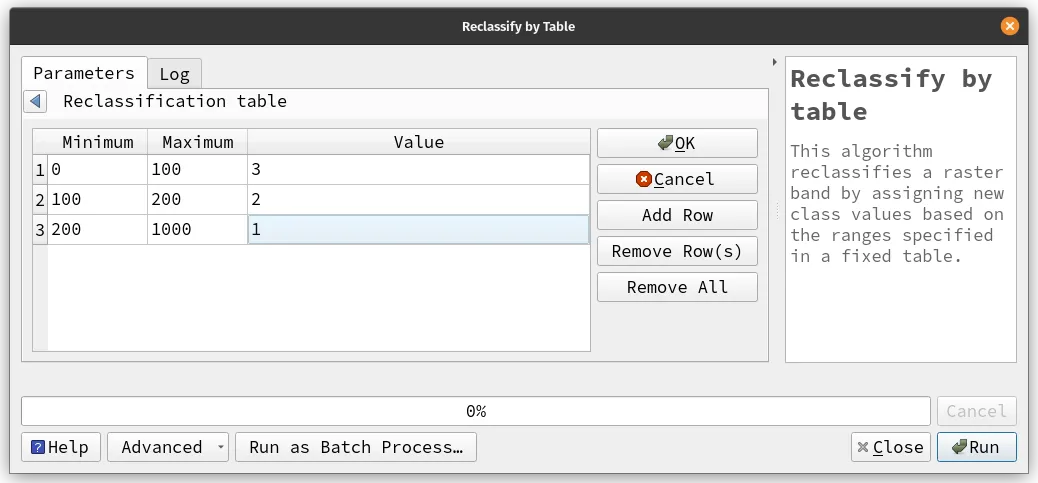
| Old value | New value |
|---|---|
| 0 < x ≤ 100 | 3 |
| 100 < x ≤ 200 | 2 |
| 200 < x ≤ 1000 | 1 |
- Open the Reclassify by Table algorithm.
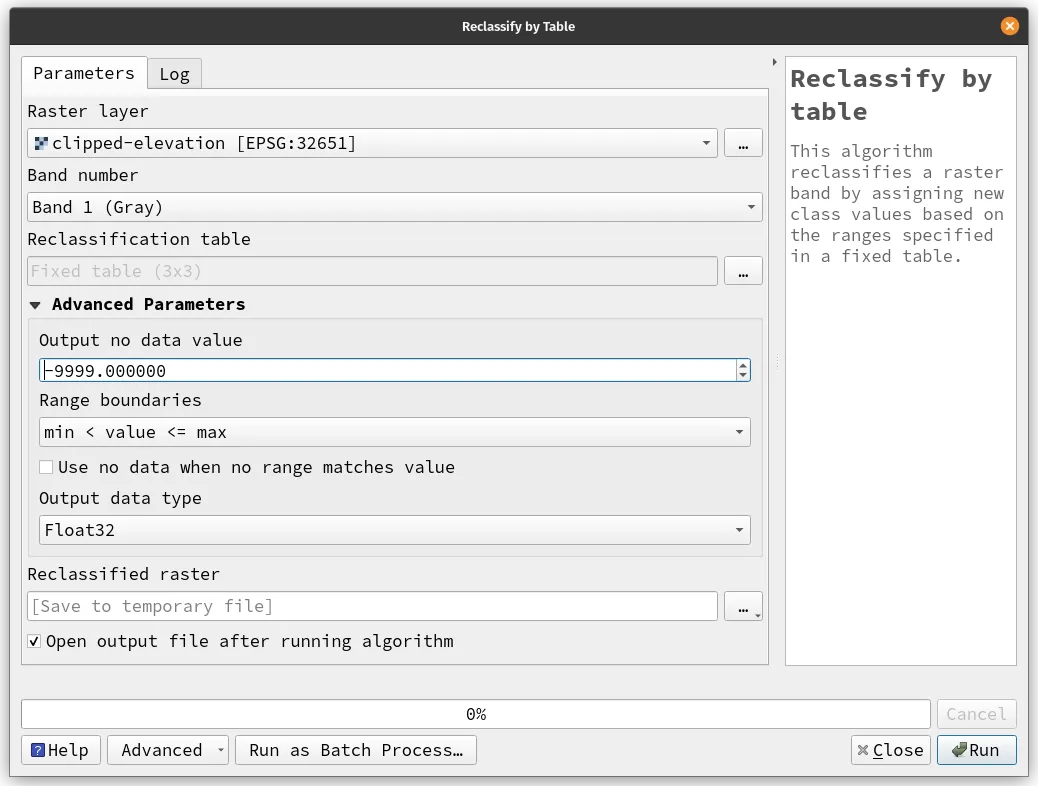
- In the Reclassification table, add the same rows as the table above.
- Click Run.
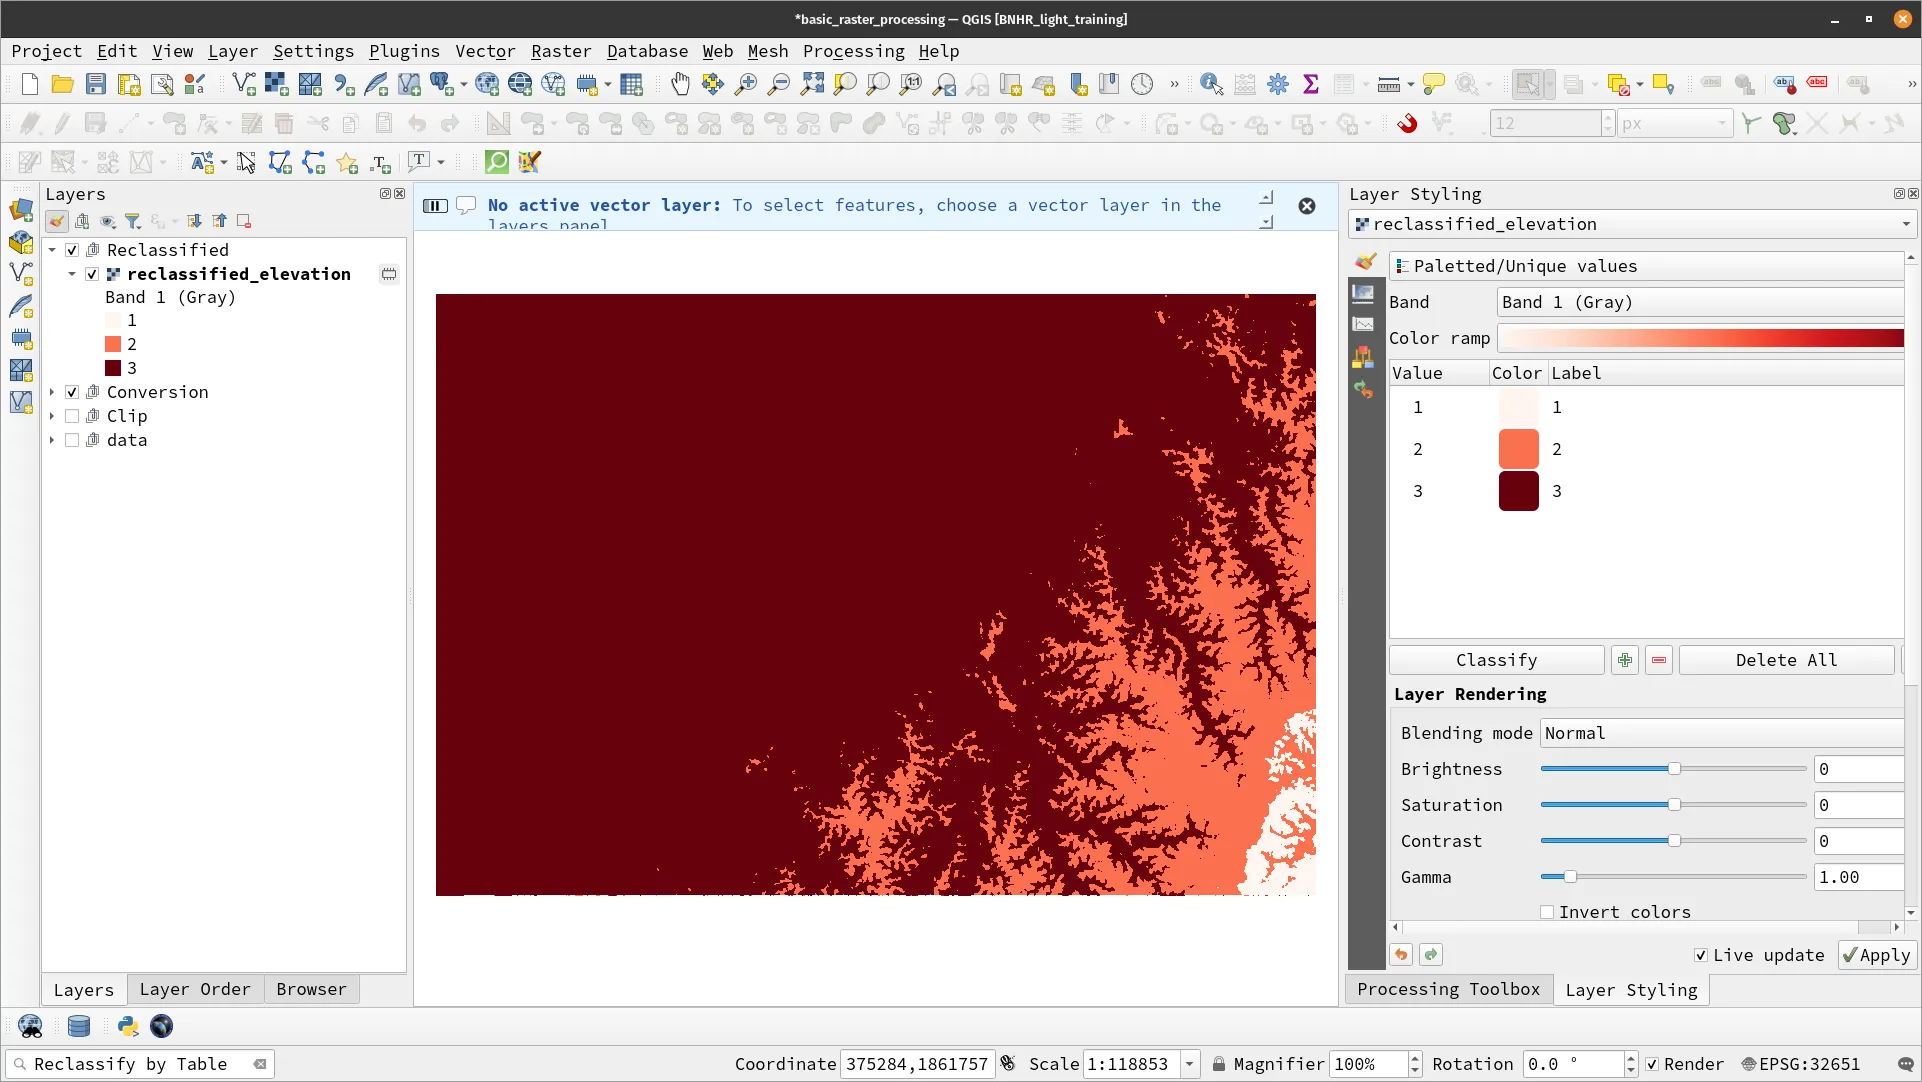
- You should have a reclassified layer named Reclassified loaded in QGIS.
- Rename the output reclassified_elevation.
Exercise 5.2.4. Reclassifying the population density raster
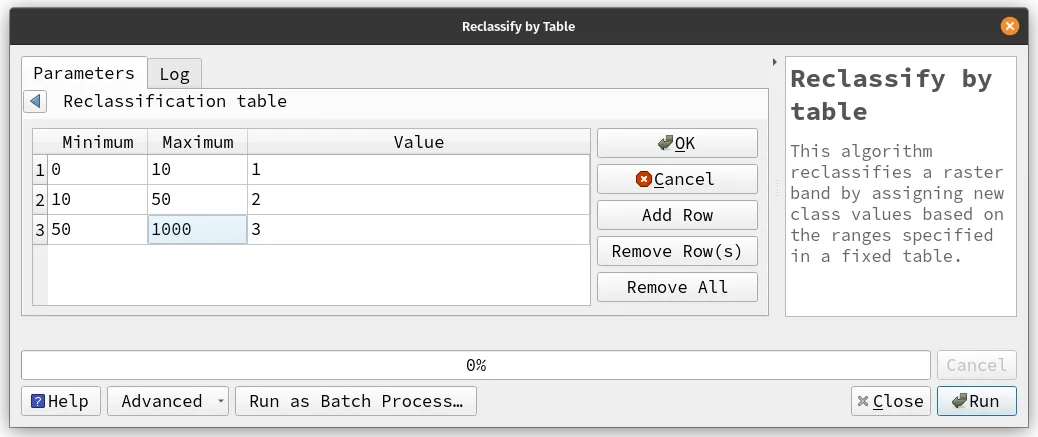
Section titled “Exercise 5.2.4. Reclassifying the population density raster”Let’s reclassify the popden raster based on the following table:
| Old value | New value |
|---|---|
| 0 < x ≤ 10 | 1 |
| 10 < x ≤ 50 | 2 |
| 50 < x ≤ 1000 | 3 |
- Do the same steps as in Exercise 5.2.3. and rename the output reclassified_popden.
The raster calculator
Section titled “The raster calculator”The Raster Calculator is one of the most useful tools in QGIS when working with rasters. Aside from raster arithmetic, it also allows for boolean operations, comparisons, etc. In fact, you can use the Raster Calculator to reclassify rasters if you use the proper expressions.
Exercise 5.2.5. Reclassifying the Flood Hazard using the Raster Calculator
Section titled “Exercise 5.2.5. Reclassifying the Flood Hazard using the Raster Calculator”For the flood hazard, we want to reclassify the values so that values less than or equal to 0 become 0 while everything else remains the same
- Open the Raster Calculator in the Locator bar, via Raster ‣ Raster calculator… in the Menu bar, or under Raster analysis ‣ Raster calculator in the Processing Panel. Several other raster calculators should be available to you depending on the Processing providers activated in your QGIS instance. I tend to prefer the Raster calculator in the Processing Panel.
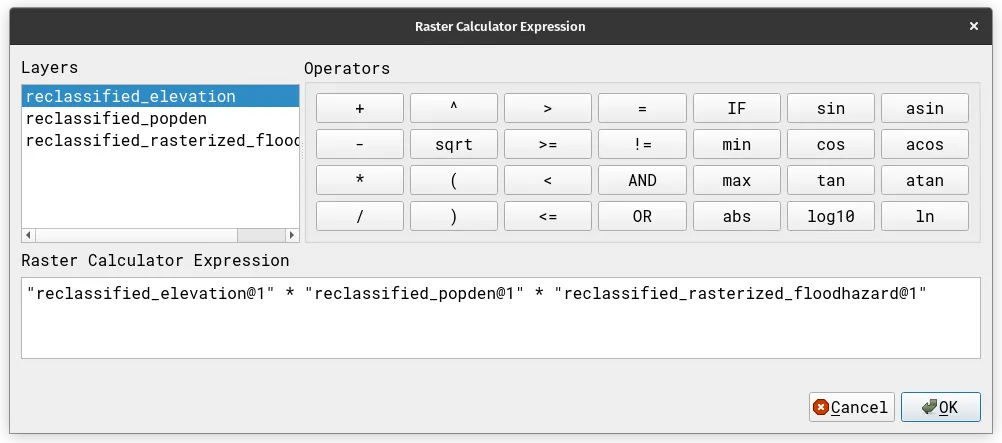
- The following dialog will appear:
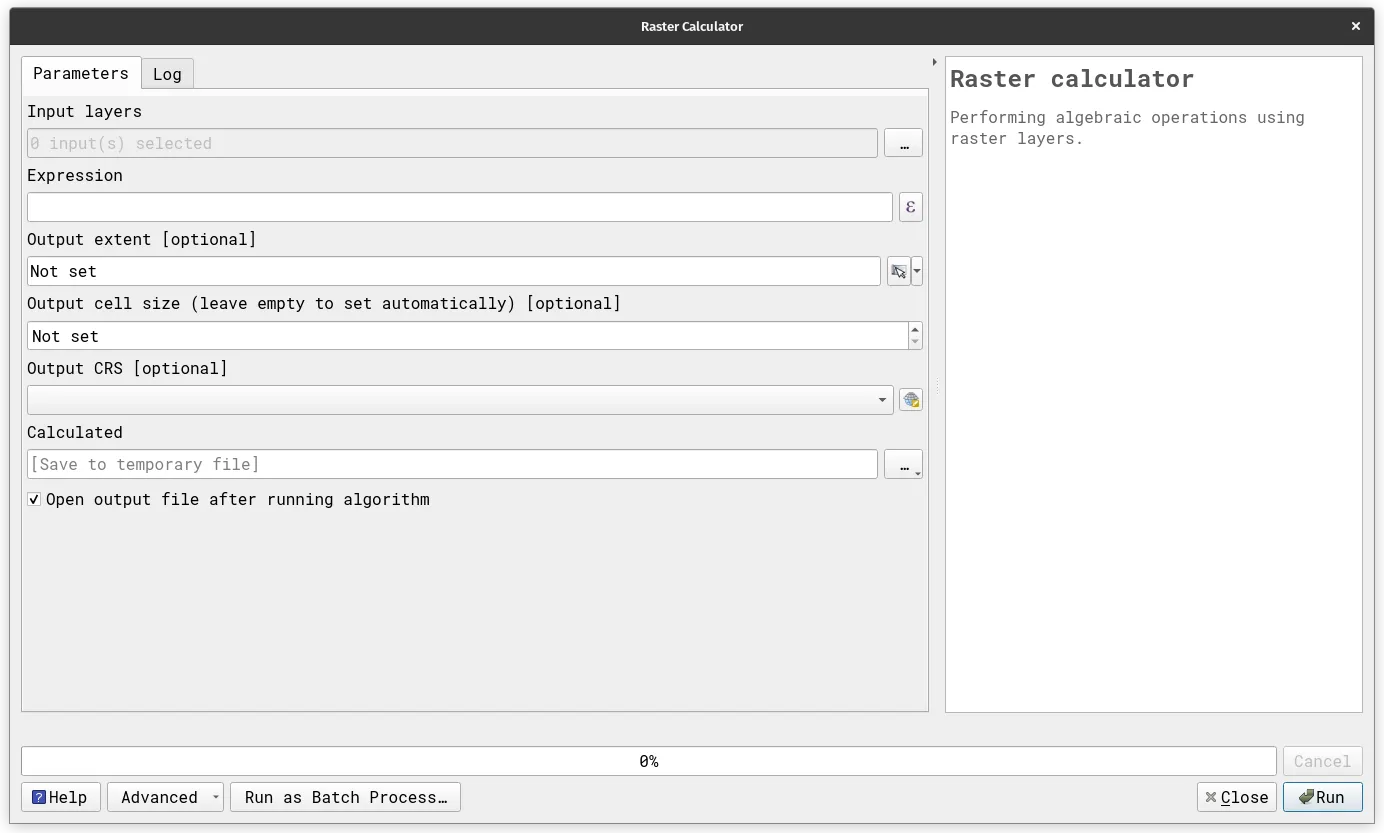
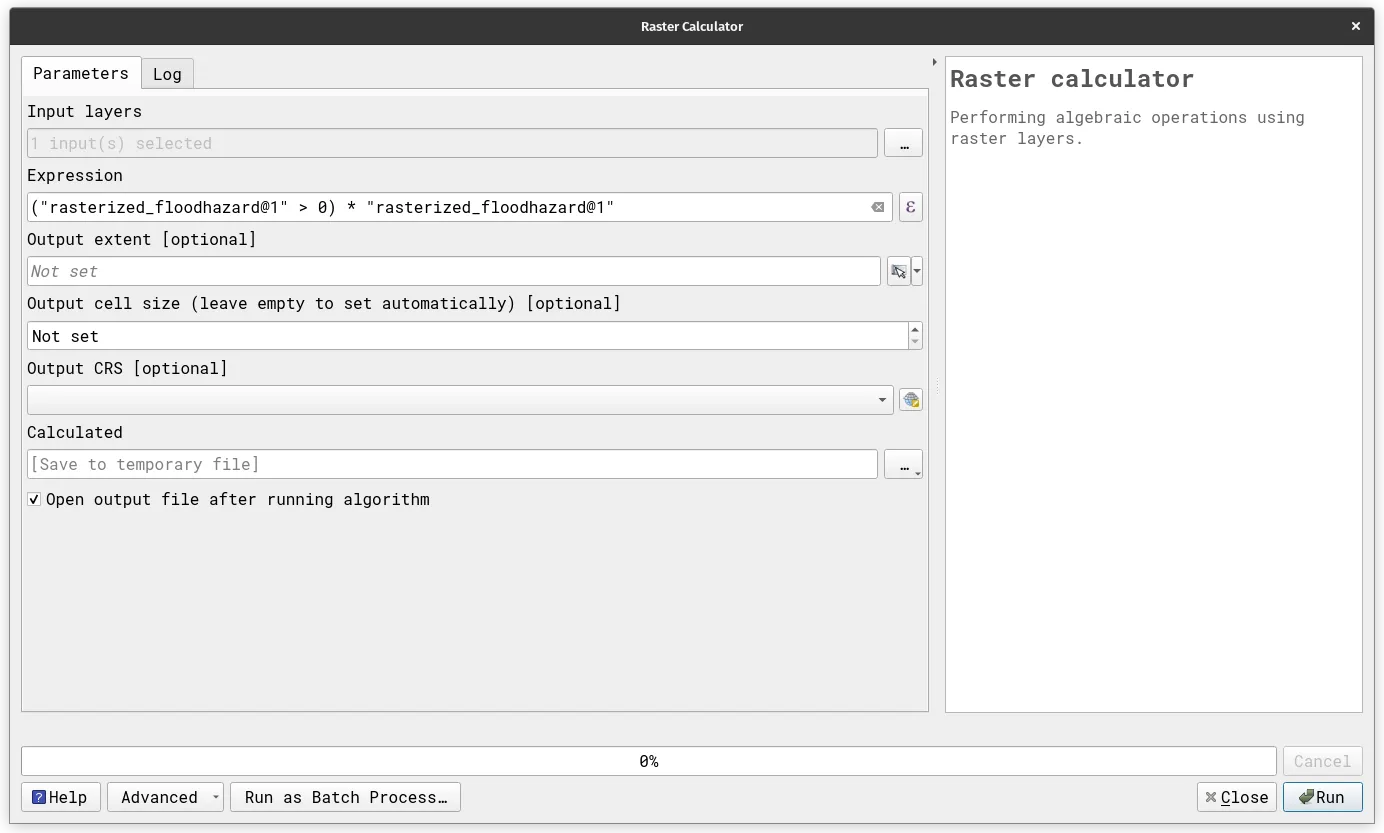
- Using this new dialog, you first need to select the Input layers that will be included in your calculation. In your case, add rasterized_floodhazard as Input layer.
- Click on Expression.
- Use the following expression:
("rasterized_floodhazard@1">0) * "rasterized_floodhazard@1"
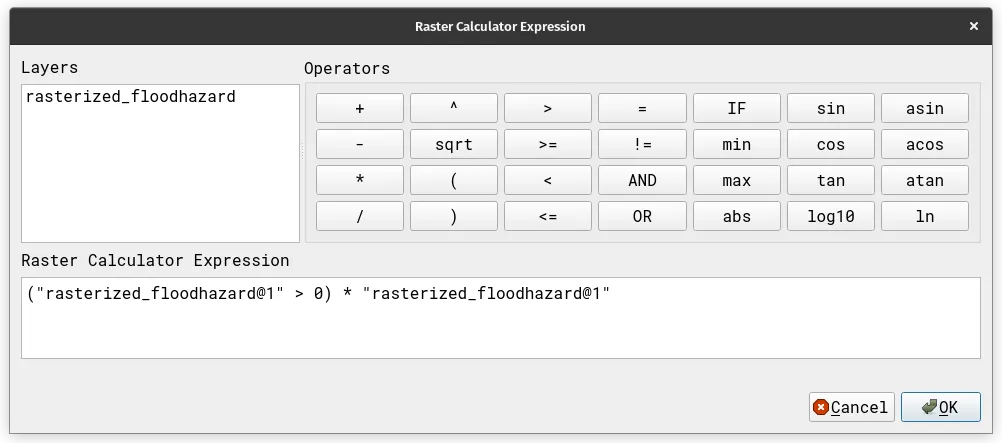
- Rename the output reclassified_rasterized_floodhazard.
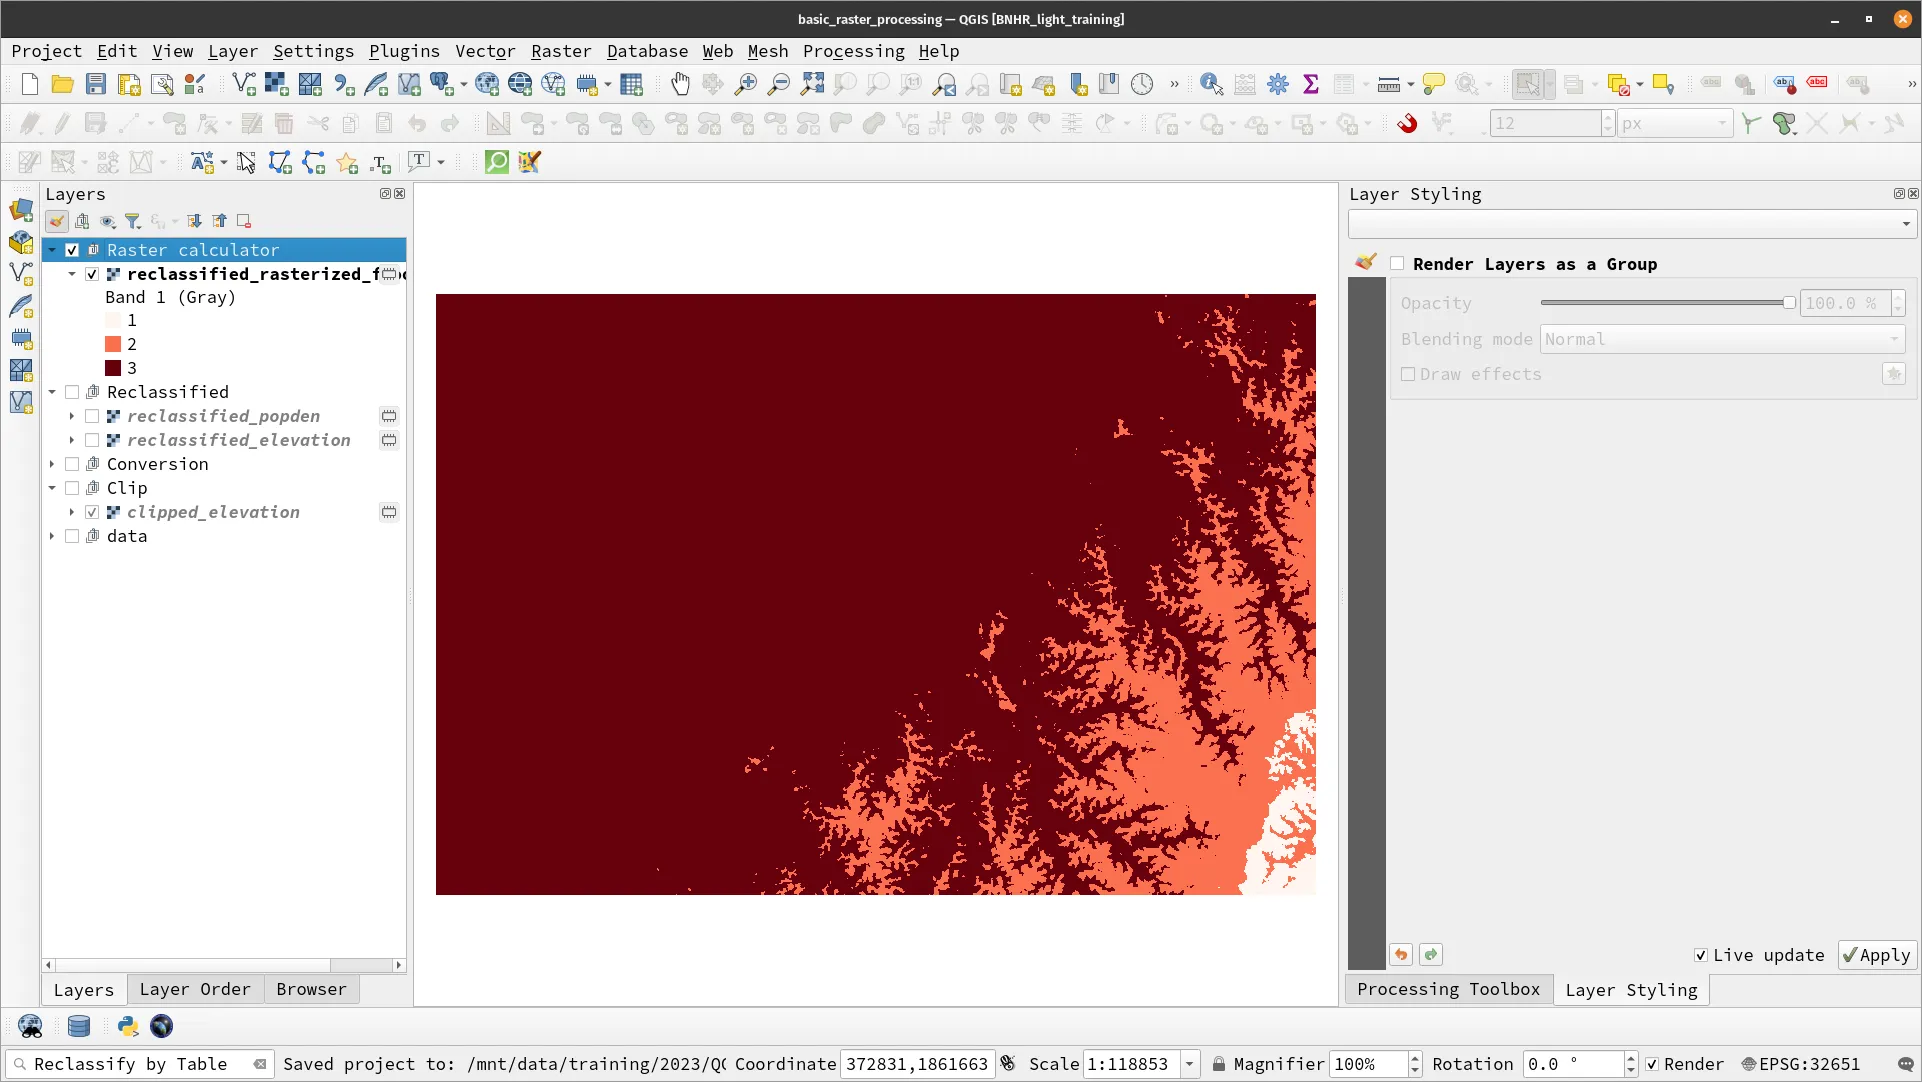
Exercise 5.2.6. Risk computations using the Raster Calculator
Section titled “Exercise 5.2.6. Risk computations using the Raster Calculator”Let’s say that our simple model for risk includes multiplying the hazard, population density, and elevation of the area. In mathematical terms, R = H * P * D where H, P, and D are our reclassified values. This is easy to do in the Raster Calculator:
- Open the Raster Calculator.
- Add the following Input layers: reclassified_rasterized_floodhazard, reclassified_popden, and reclassified_elevation
- Use the following expression:
"reclassified_rasterized_floodhazard@1" * "reclassified_popden@1" * "reclassified_elevation@1"
- Your final output should look like below. Rename it risk.
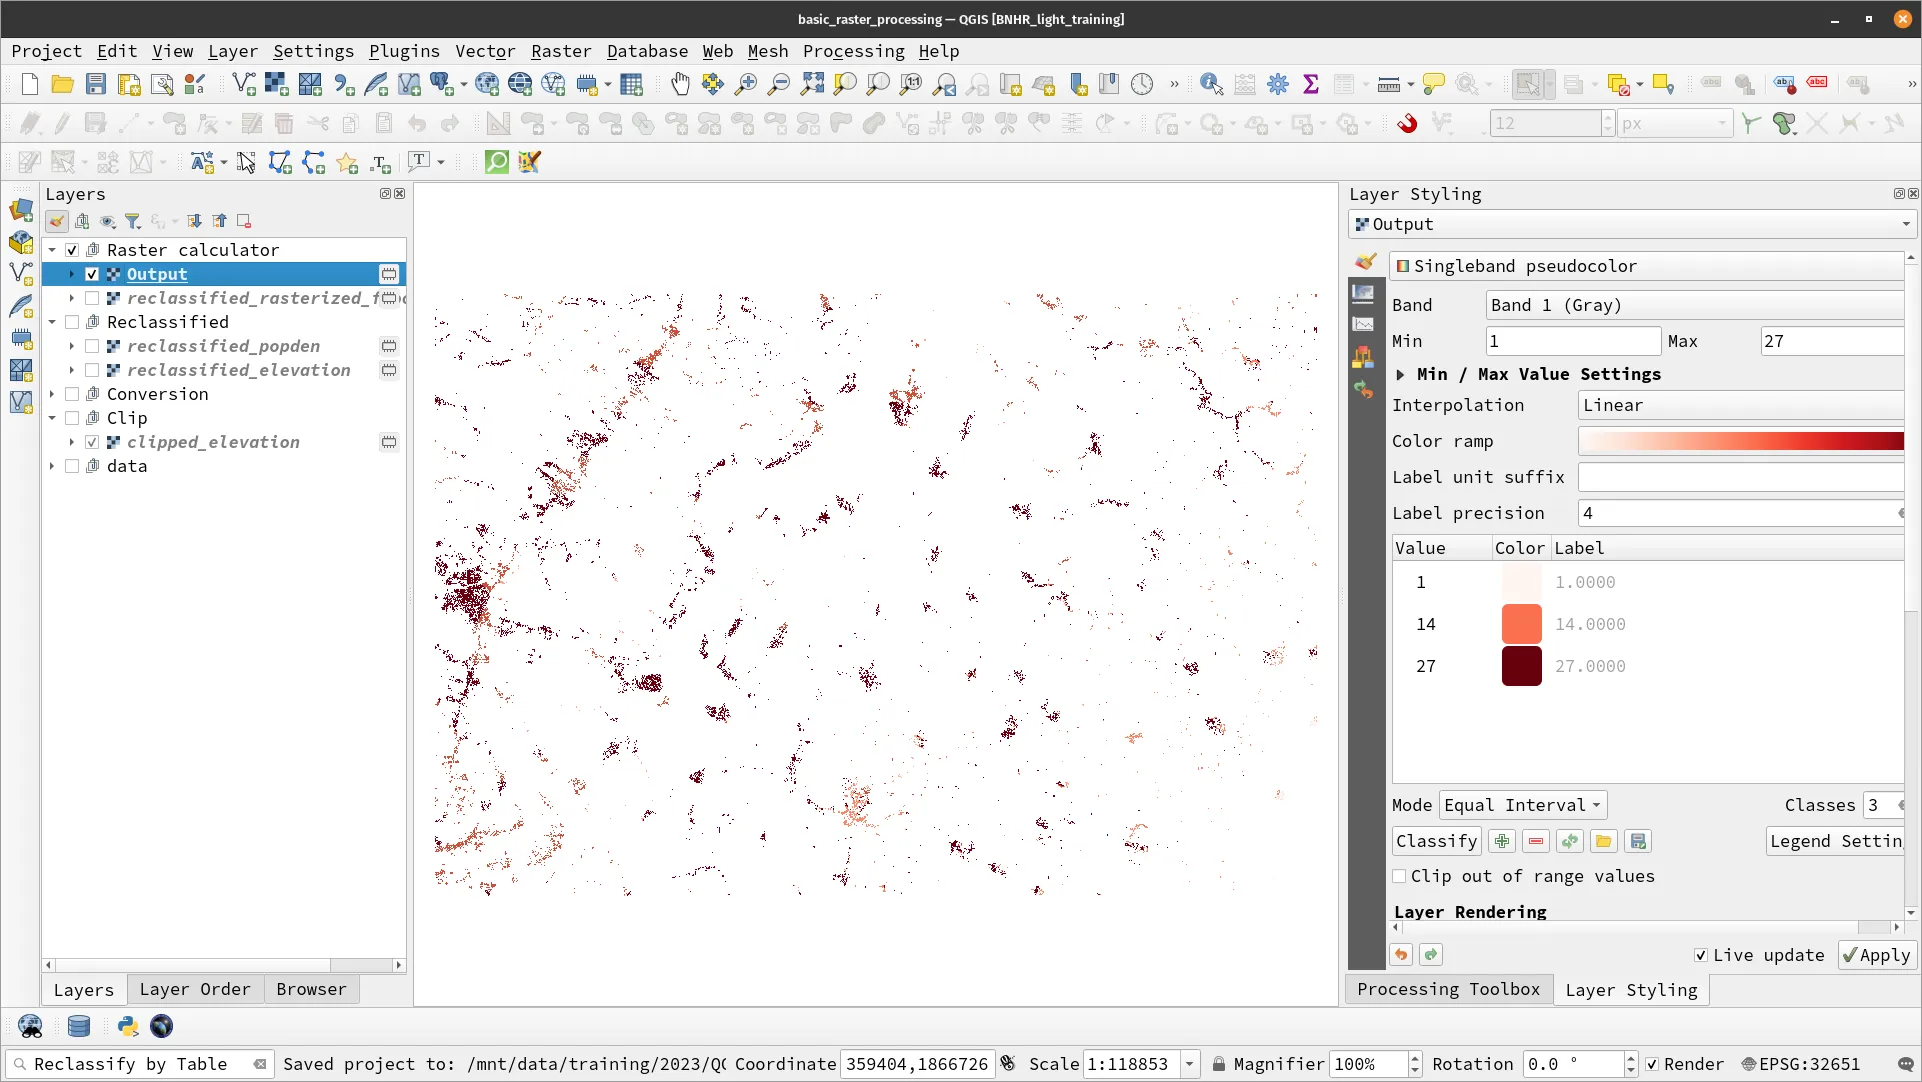
And you’re done!
More processing and analysis
Section titled “More processing and analysis”Some other processing and analysis techniques in QGIS include:
- Zonal Statistics: calculates statistics for a specified zone or region within a raster layer. This is useful for calculating summary statistics such as mean, median, and standard deviation within a specific region.
- Raster and Vector Sampling: the process of extracting pixel values from a raster layer at specific locations. This is useful when you want to get values from a raster at certain points or locations, such as for environmental monitoring or analyzing point data against a raster or vector layer.
- Weighted overlay analysis: commonly used GIS technique that combines multiple raster layers into a single output layer. Each input raster is assigned a weight based on its relative importance to the analysis. For example, a weighted overlay analysis might combine layers showing slope, soil type, and proximity to water sources to identify areas of high landslide risk.
- Site-suitability analysis: identifying the most suitable location for a certain activity or land use based on various criteria or factors such as those done using the Multi-Criteria Decision Analysis approach.
- Network analysis: allows you to model and analyze networks such as roads, waterways, and pipelines. For example, you can use network analysis to determine the best path between two points on a road network. You can also perform service area analysis to determine which areas are accessible within a given time or distance from a set of facilities such as hospitals or schools.
- Graphical Modeler: allows you to create complex processing workflows by visually connecting processing algorithms. For example, you can create a workflow that takes in multiple vector layers, performs a series of analyses on them (such as merging, clipping, and buffering), and outputs the final result. The workflow can be saved and re-run on different data inputs, automating repetitive tasks and saving time.
- Extending with Python and PyQGIS: allows you to develop custom plugins and scripts to automate repetitive tasks, add new features, and enhance the functionality of QGIS. Even users with little or no programming experience can benefit from Python scripting by using the built-in Processing Toolbox algorithms or creating custom processing scripts using graphical models in the Graphical Modeler.
- Remote sensing in QGIS: aside from its built-in algorithms, there are plugins and processing providers (such as GRASS) that allow QGIS to become a powerful remote sensing, image analysis, and image classification tool. A good example is the SCP Tools or Semi-Automatic Classification Plugin that provides a user-friendly interface for image processing, classification, and validation inside QGIS.
Quiz and discussion questions
Section titled “Quiz and discussion questions”- Why should you be familiar with the Processing Framework?
- When should you use Dissolve and when should you use Aggregate?
- Do you think we need to minimize creating stand-alone plugins and have most plugins be processing plugins?
Certification and support
Section titled “Certification and support”Contact us or sign-up to our courses if you are interested in having this as an instructor-led or self-paced course.