
QGIS Expressions
Introduction
This module is designed to give you an introduction to QGIS expressions—what they are, how they are used, where they are used, and why they are so awesome!
At the end of this module, you should have an understanding about how expressions work in QGIS and some hands-on experience with using them in real-world applications.
What you should already know
Since this is a beginner module, no previous knowledge of GIS or QGIS is required. However, familiarity with the QGIS interface as discussed in QGIS: Essentials - Introduction to QGIS, how to load different kinds of layers as discussed in QGIS: Essentials - Introduction to layers in QGIS, and how to run processing algorithms as discussed in QGIS: Essentials - Basic geospatial processing techniques are preferred.
Introduction to QGIS Expressions
This chapter introduces QGIS Expressions and provides a brief overview of their capabilities. It is aimed at beginners who want to learn the basics of using expressions in QGIS. It also covers the basics how to write and use expressions in QGIS.
What are expressions
QGIS Expressions are a powerful tool for working with data in QGIS. They allow you to create dynamic and interactive maps, automate tasks, and perform spatial analysis. Expressions also provid a way of creating custom calculations or filters that can be applied to your data.
Expressions are written in a scripting language and can be used in various parts of QGIS such as labels, symbology, and data-driven styling. They are essentially formulas or equations that you can use to perform calculations or modify things in QGIS. You can think of them as spreadsheet (e.g. Excel, Calc) formulas or SQL queries but are specific to QGIS.
QGIS expressions are divided into categories that include:
- Aggregates Functions
- Color Functions
- Conditional Functions
- Geometry Functions
- Record and Attributes Functions
- String Functions
- And many more
Benefits of using expressions
QGIS Expressions provide a powerful toolset for working with data within QGIS. By using expressions, you can automate complex workflows, customize symbology and labeling, and perform calculations on attributes and geometry.
Increased efficiency
One of the major benefits of using expressions in QGIS is that they can greatly increase your efficiency when working with data. Expressions allow you to automate tasks that would otherwise require manual data entry or complex calculations. This can save you a significant amount of time and effort, especially when working with large datasets.
For example, you can use expressions to calculate areas, lengths, and other geometric properties of features in your data, instead of having to manually calculate these values for each feature. You can also use expressions to filter and classify data based on complex conditions, without having to create multiple queries or filters
Increased flexibility
Another benefit of using expressions is that they provide increased flexibility in working with your data. You can use expressions to create custom labeling and symbology rules as well as custom calculations and analysis tools. This allows you to tailor your workflow to your specific needs and goals rather than being limited by the default functionality of QGIS.
For example, you can use expressions to create custom color ramps and gradients or to label features based on multiple attributes. You can also use expressions to create dynamic forms and input dialogs that adapt to user input and allow for more flexible data entry.
Aside from this, expressions allow you to work with data in real-time without the need to create new fields or tables in your data. This can save you time, effort, and disk space. For example, let’s say you have a layer that contains a column of temperature data in degrees Celsius but you want to compute statistics for it or visualize the data using Fahrenheit. Instead of creating a new field, you can simply use the expression (“celsius” * 1.8) + 32, where “celsius” is the name of the Celsius temperature column, in places where you want to use the Fahrenheit value.
Improved Visualizations
Finally, using expressions can also lead to improved visualizations of your data. By using expressions to create custom labeling and symbology rules, you can better highlight important features or patterns in your data.
For example, you can use expressions to create data-driven styling, such as adjusting the color of your map features based on attribute values or displaying labels only for certain features. This can make your maps more informative and easier to read.
You can also use expressions to create more sophisticated and dynamic visualizations. This is specially true when used in conjunction with the QGIS Atlas.
Where can you use expressions
Expressions can be used in various contexts to manipulate and analyze data in QGIS such as:
- Field calculations: Expressions can be used to calculate field values based on other fields in the same or different layers. This can be helpful for performing complex calculations or for manipulating data in specific ways.
- Labeling: Expressions can be used to customize labels for features on a map. This can include formatting labels in a specific way or including information from multiple fields in a single label.
- Styling: Expressions can be used to customize the appearance of features on a map. This can include changing the color, size, or shape of features based on specific attributes or conditions.
- Selections and Fileters: Expressions can be used to select or filter features based on specific attributes or conditions. This can be helpful for isolating specific subsets of data for further analysis or visualization.
- Data-defined parameters: Expressions can be used to define parameters for various aspects of data visualization, including symbology, labeling, and map layout. This can be helpful for automating data visualization workflows and ensuring consistency across multiple maps or projects.
How to use Expressions
The Expression string builder
The Expression string builder is the interface that allows you to use expressions to interact with QGIS. It is available in many parts of QGIS and can be accessed when:
- clicking the button,
- selecting features with the Select by Expression (
 ) tool,
 - editing features using the Field Calculator (
 ),
), - manipulating parameters using Data defined overrides (
 ),
), - using a geometry generator symbol layer, or
- doing processing with the QGIS Processing Framework.
The Expression string builder user interface includes:
-
Expression tab where you can write and check the expression to use. It shows a searchable list of predefined functions that you can use as well as several quality of life features to help you use the correct expressions—e.g. a help panel telling you information about the function such as syntax, arguments, and examples; auto-complete; highlighting errors in your expresion; and preview of the results.
-
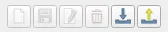
Above the expression editor, you can find a set of tools helps you write and manage your expressions
-
Under the expression editor, you find:
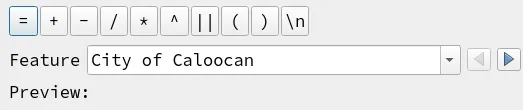
- basic operators to help you build the expression
- an indication of the expected format of output (when using with Data defined overrides)
- a live Preview of the expression output, evaluated on the first feature of the Layer by default. You can browse and evaluate other features of the layer using the Feature combobox
-
The function selector displays a searchable list of functions, variables, fields… organized in categories. Double-clicking an item adds it to the expression editor.
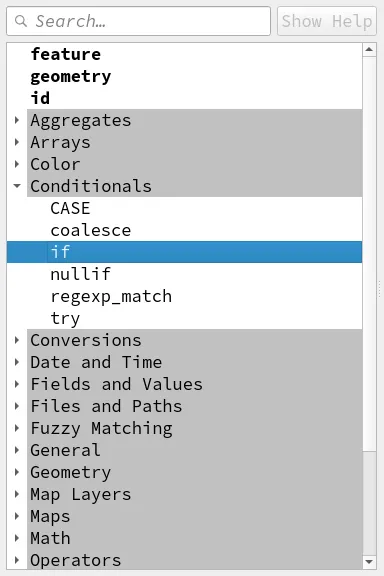
Figure 2. Function selector -
The help panel displays help for each selected item in the function selector.
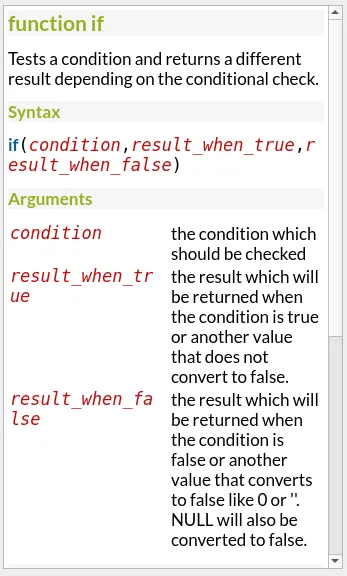
Figure 3. Help Panel -
A values widget appears when a field is selected in the function selector to help get the feature’s attributes.
-
-
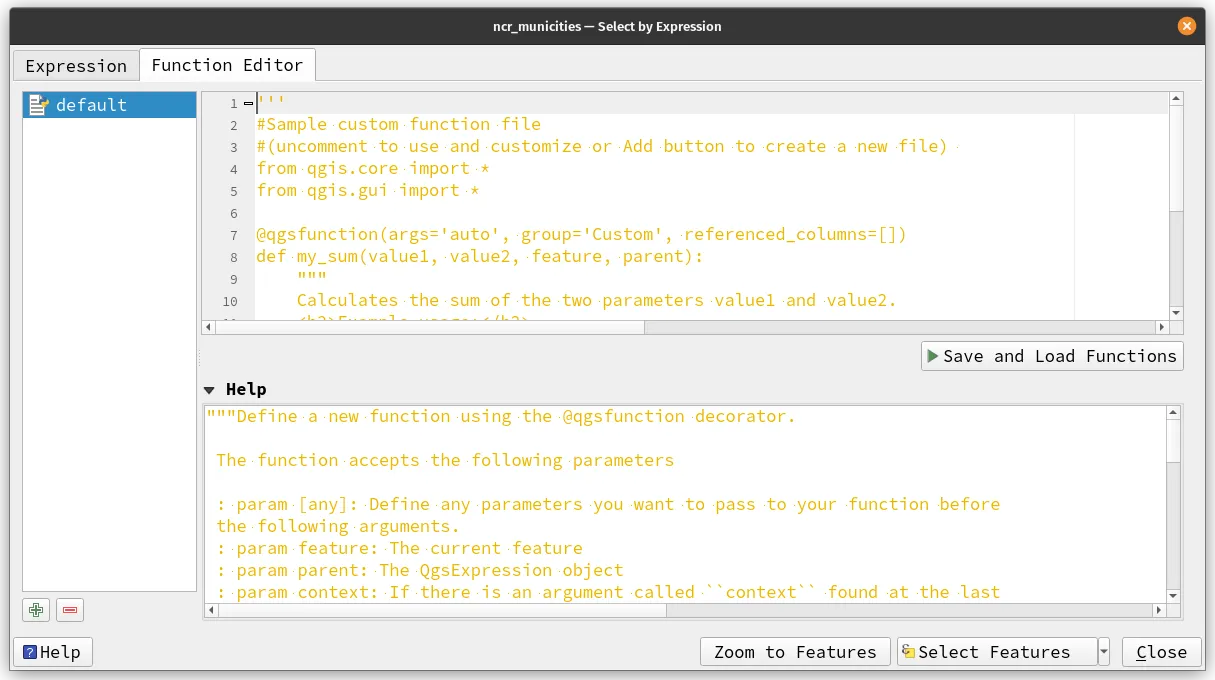
Function editor tab helps to extend the list of functions by creating custom ones—e.g. using Python.
Writing your first expression
Here are some basic rules to follow when writing expressions:
-
About quotes: quotes help expressions identify the kind of data that your text pertains to. For example:
- Single quotes will return the literal value inside them (‘this_string’). This is used for writing strings. Note that a number placed inside single quotes (‘143’) will be interpreted as a string.
- Double quotes will return the value of the text for use as a field (“this_field”). This is used when you want to value of a features attributes/fields in your expression.
- **No quotes **are generally used for numeric values. They can also be used for fields as long as the field name does not contain white spaces (this_field is correct but this field will read both this and field as individual fields).
-
Context defines how expressions are used. Although you can use functions anywhere expressions are allowed, how you use them will depend on the context of what you are trying to do. For example, you can use the expression
population/($area/10000)in the Field Calculator to compute for the population density but when using an Expression to select features that are above a certain population density, you need to add a comparison/boolean expression such that your final expression becomespopulation/($area/10000) > 200.
Exercise 4.1. Writing an expression to check if population density > 200
In this exercise, you will use an expression on the ncr_municities layer to select features that have a population density greater than 200. The layer only has a field for population (pop2020).
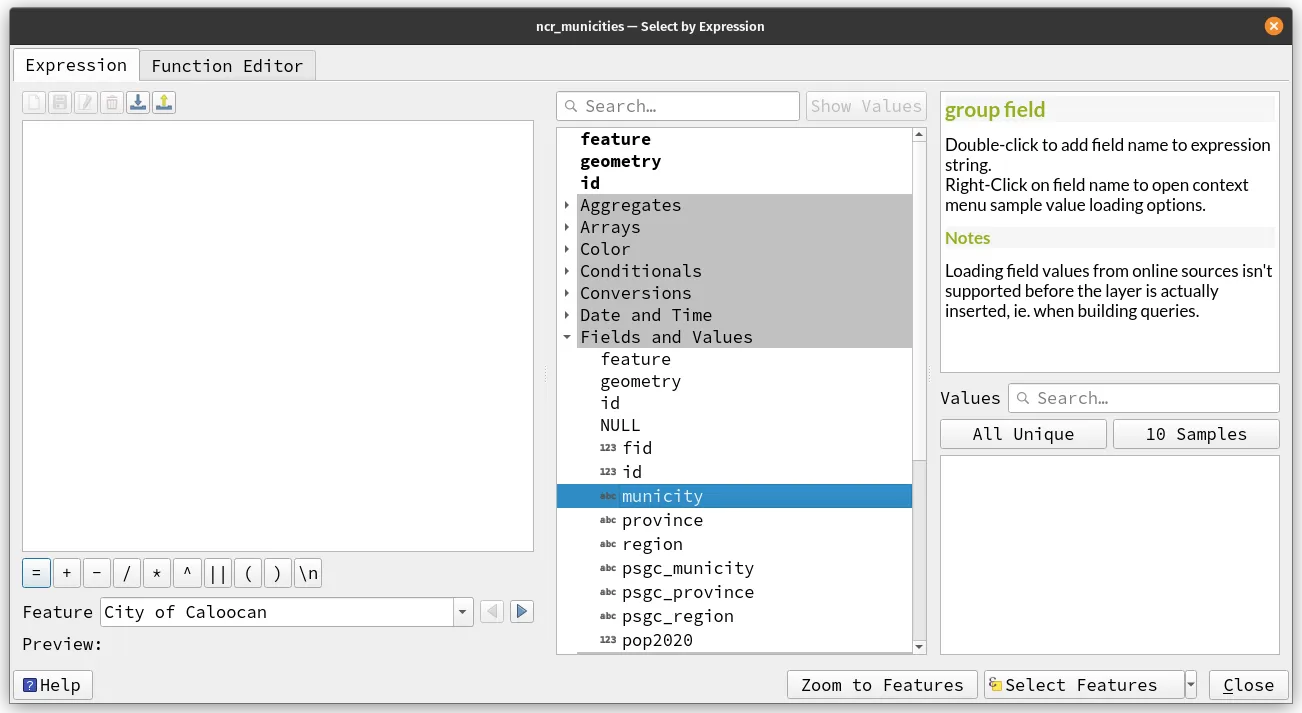
- Load the ncr_municities layer in QGIS and open the Select by Expression tool from the Selection Toolbar or from its attribute table.
- Write the following expression.
pop2020/($area/10000) > 200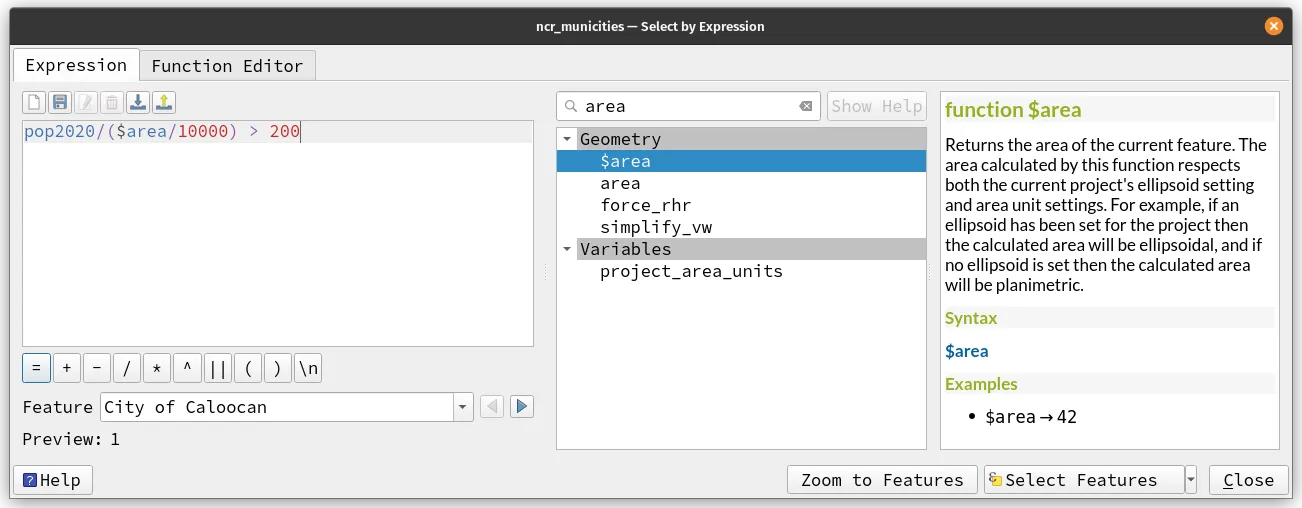
- Check the parts of the Expression string builder dialog. What do you notice?
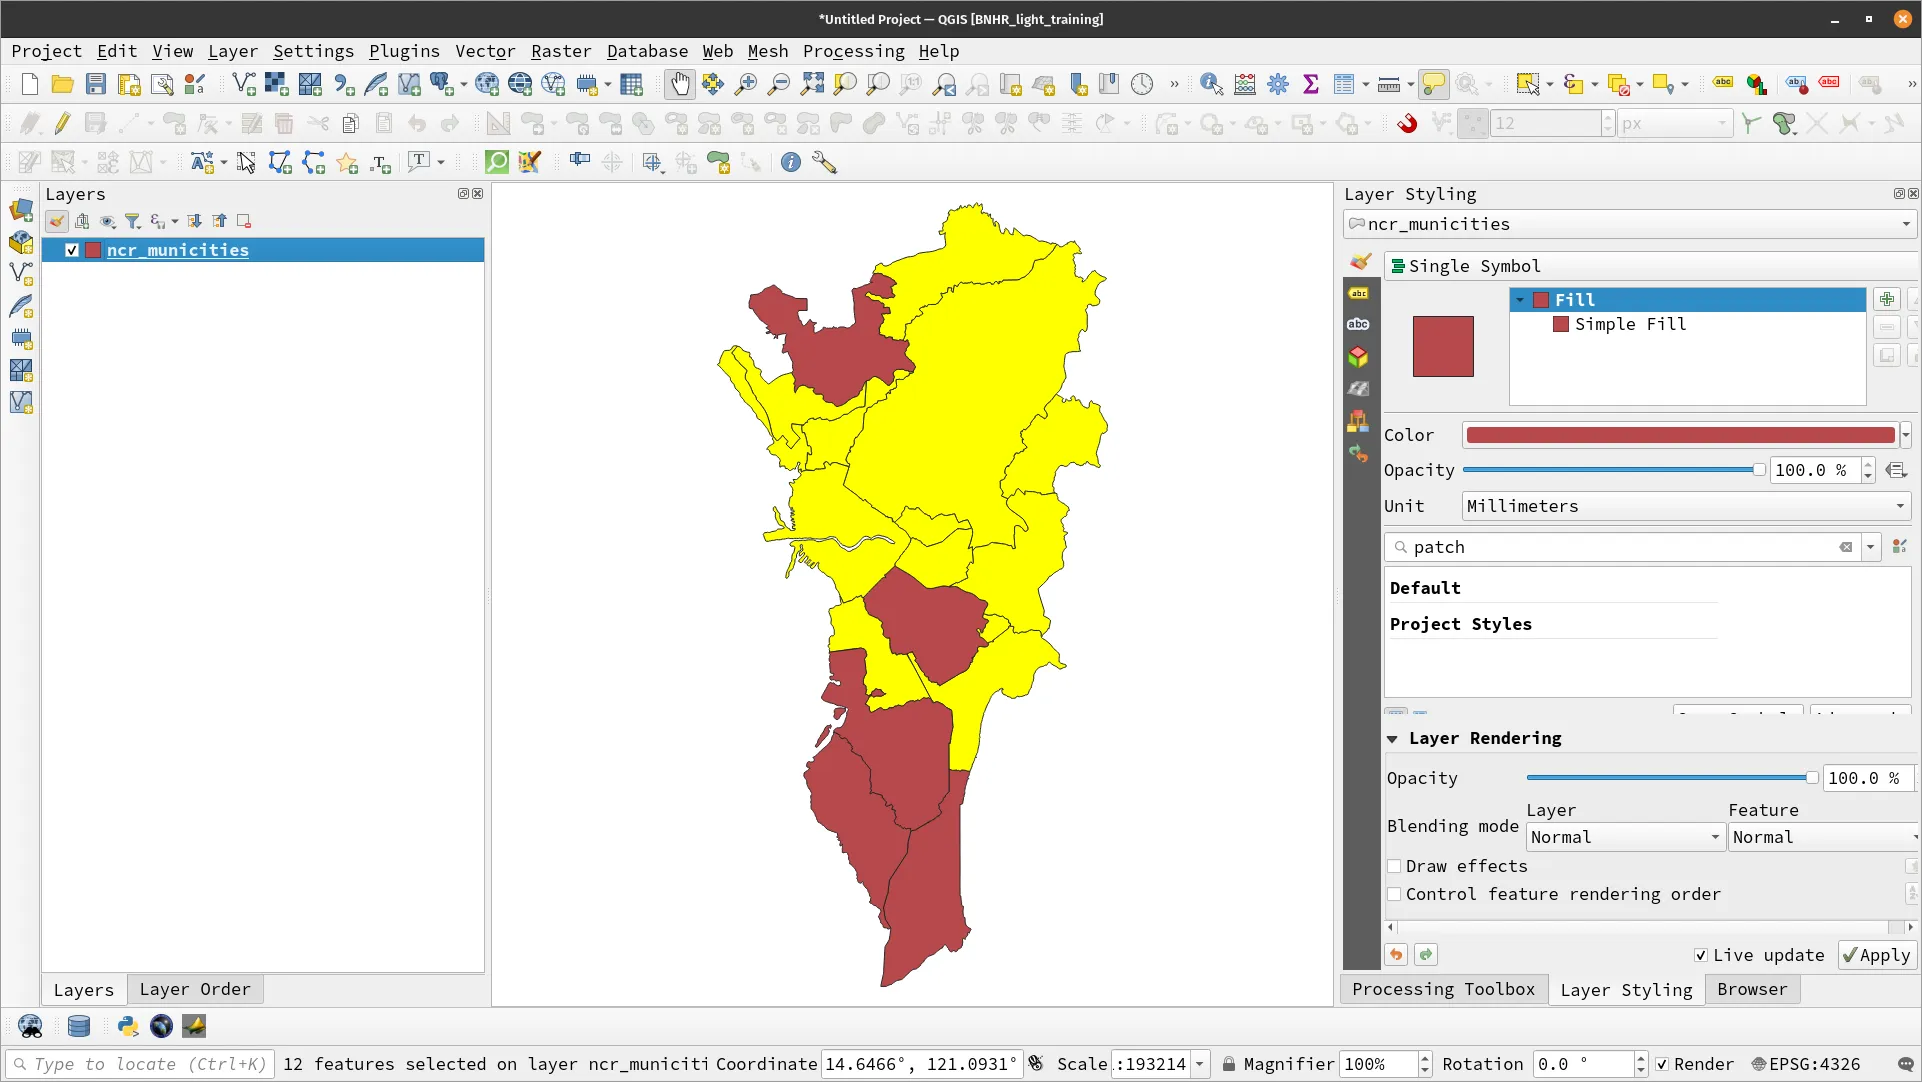
- Click Select Features. Your map canvas should appear like below.
Saving your expressions
In case you want to reuse expressions in the future or you just want quick access to expressions that you commonly use, you can click the Add current expression to user expressions (![]() ) button at the top of the Expression editor to save your expression. These will then be available under the User expressions group in the expressions list.
) button at the top of the Expression editor to save your expression. These will then be available under the User expressions group in the expressions list.
These expressions are saved together with the user profile (userprofile/QGIS/QGIS3.ini) and can be used in all expression dialogs inside all projects of that user profile.
You can also import or export the user expressions into or from the current user profile. These will be saved as a .json file.
Extending your expressions with Python
You can write your own functions using Python in the Function Editor tab of the Expression string dialog. This is useful when you need functionality that is not covered by the predefined functions.
Memory boosters and review
What are QGIS Expressions?
QGIS Expressions are a way to manipulate data and perform calculations within QGIS.
What are some advantages of using QGIS Expressions?
Advantages of using QGIS Expressions include the ability to perform complex calculations within QGIS, the ability to create dynamic symbologies and maps, and the ability to automate repetitive tasks.
What are some common uses of QGIS Expressions?
Field calculator, labeling, styling and symbology, selections and filters, data-defined parameters
What are some best practices for working with expressions in QGIS?
Use descriptive variable names, comment your code, and test your expressions on a small subset of data before applying them to the entire dataset.
What should you use if you want to use a string in an expression
Single quotes
Real world applications of expressions
All the data used in the exercises for this chapter can be found in the bnhr_qgis_expressions.gpkg inside the data folder.
Exercise 4.2. Auto-populating fields when digitizing based on another layer
One of the most common tasks in GIS is digitizing data—which is discussed further in the Working with Layers workbook, module 3. This task is often cumbersome and time-consuming, especially if you need to manually add fields to the features you digitize.
In this exercise, you will learn how to automate the task of filling out fields when digitizing. In particular, you will automatically get the values for the barangay and city based on where the digitized feature is located on the manila_barangays_gadm layer.
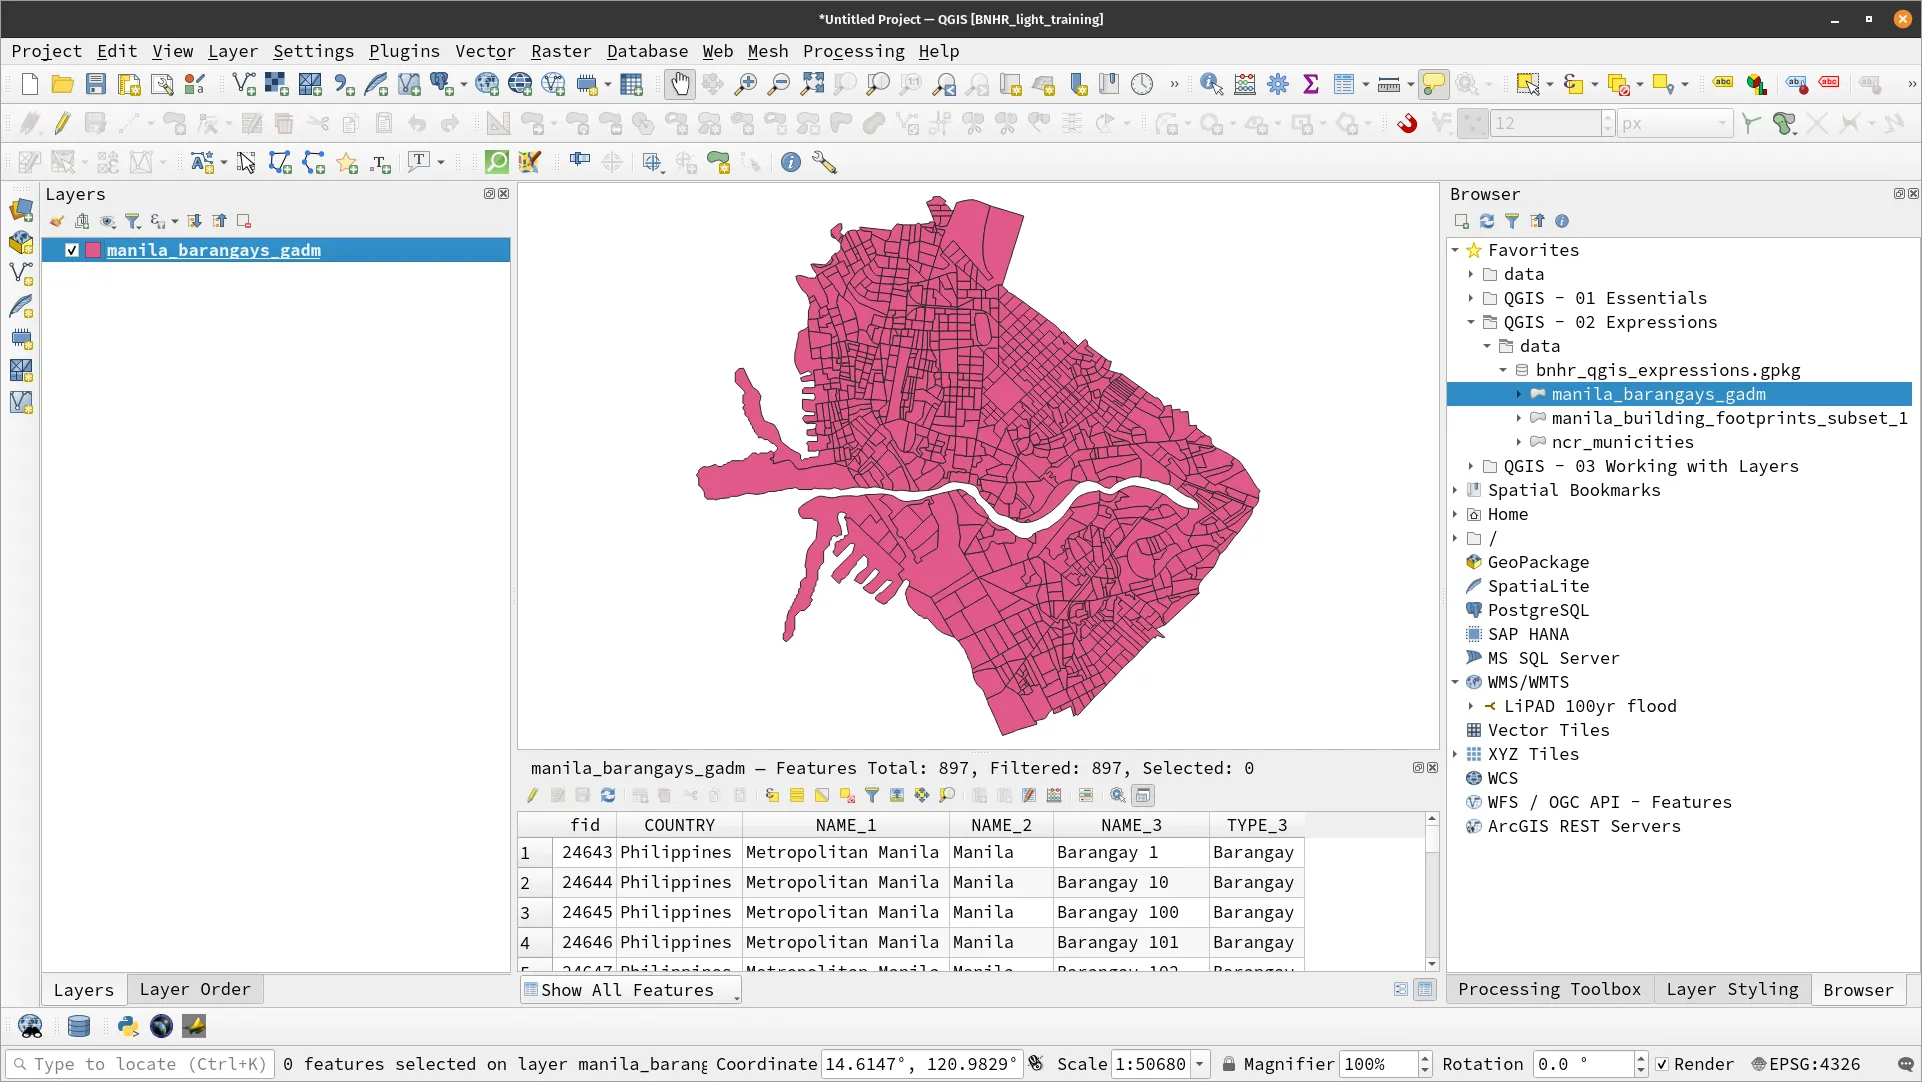
- Load the manila_barangays_gadm layer and look at its attribute table.
- Let’s digitize some buildings in Manila. First, create a temporary scratch layer using the Data Source Manager Toolbar (
 ) or from the Layer ‣ Create Layer ‣ New Temporary Scratch Layer menu.
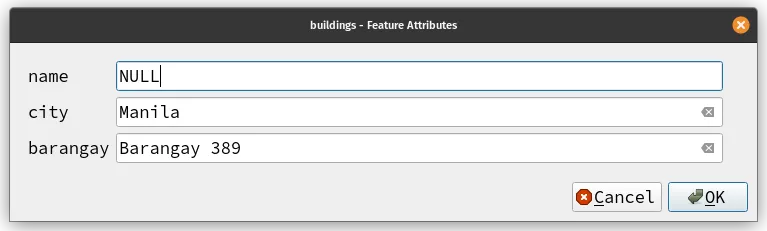
 - Use the following parameters and add three fields: name, city, barangay.
| Field Name | Data Type | Length |
|---|---|---|
name | string | 255 |
city | string | 255 |
barangay | string | 255 |
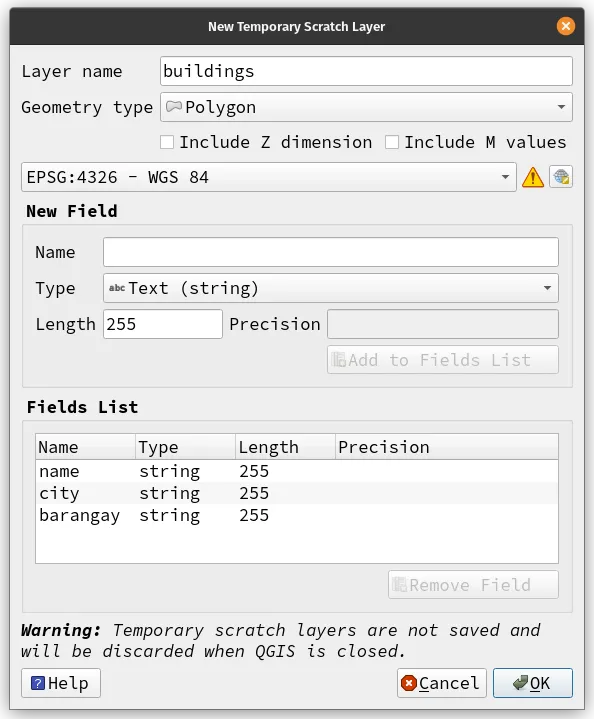
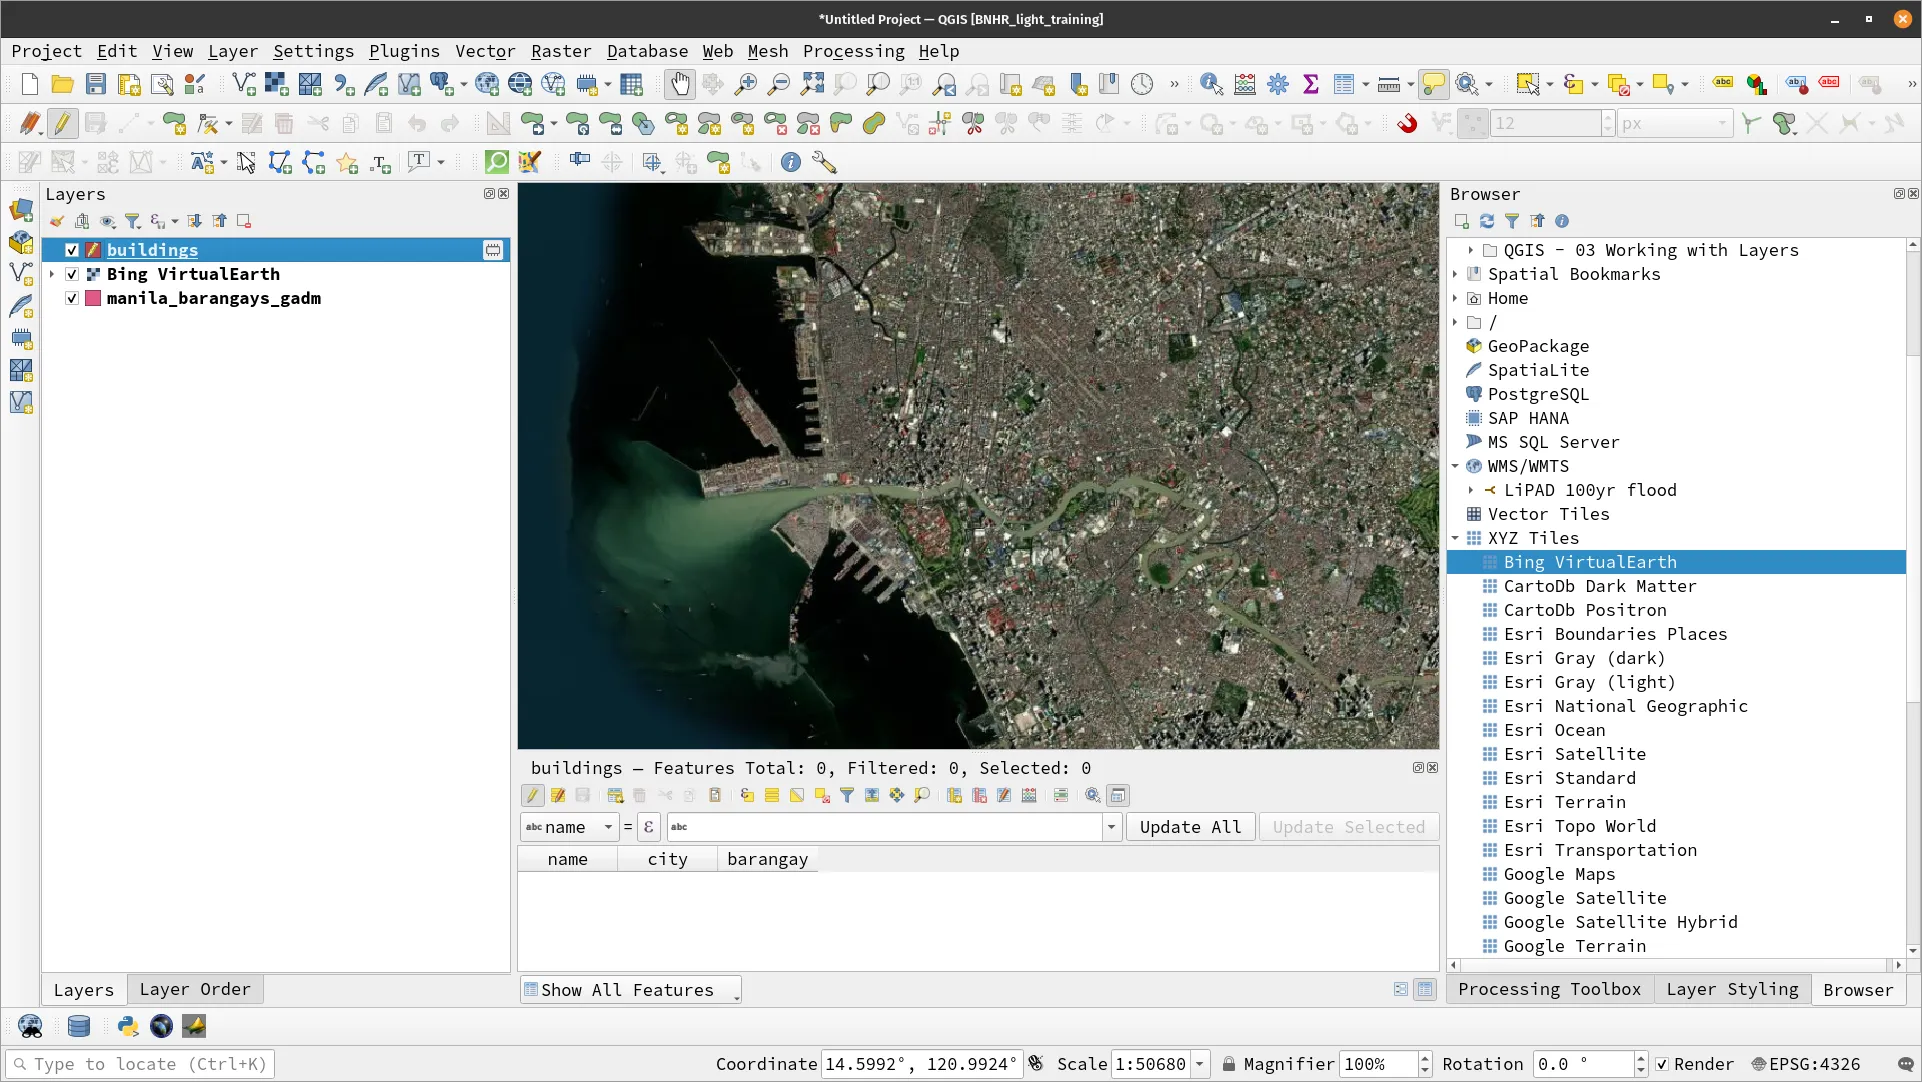
- Click OK. The buildings layer should be visible in your Layers panel. Don’t worry if it isn’t visible in the map canvas. That’s normal because the layer has no features yet. We’ll take care of that in the next steps.
- Load a satellite image like Bing Virtual Earth that we can use for digitizing.
- Before we add/digitize new features, let’s edit the properties of the buildings layer so that when we create a new feature, the city and barangay fields are automatically updated based on the value from the manila_barangays_gadm layer. To do this, we use expressions.
- Open the Layer Properties of buildings by right-clicking on the layer ‣ Properties.
- Go to the Attribute Form tab and click city under Fields, like below.
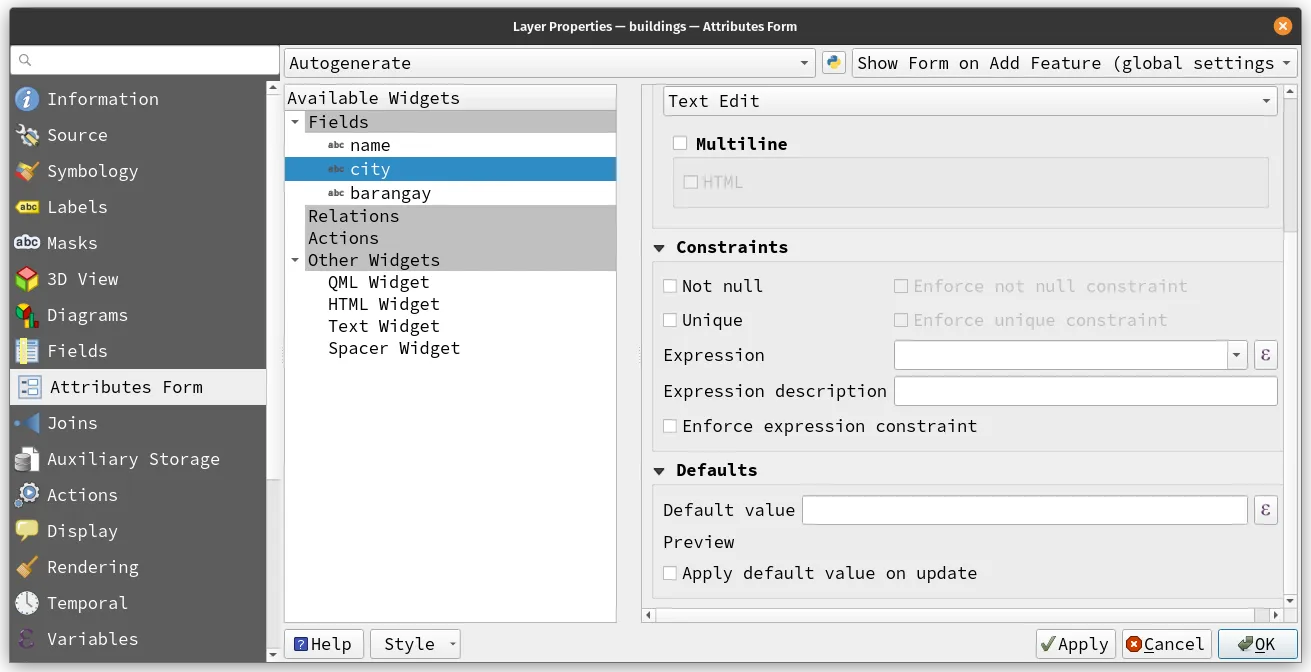
- Notice that we can specify a default value for the field. Notice further that this value can take the form of an expression (
 ).
). - Click on the Expression button () and apply the following expression.
aggregate(layer:= 'manila_barangays_gadm',aggregate:='concatenate',expression:=NAME_2,concatenator:=', ',filter:=contains($geometry, geometry(@parent)))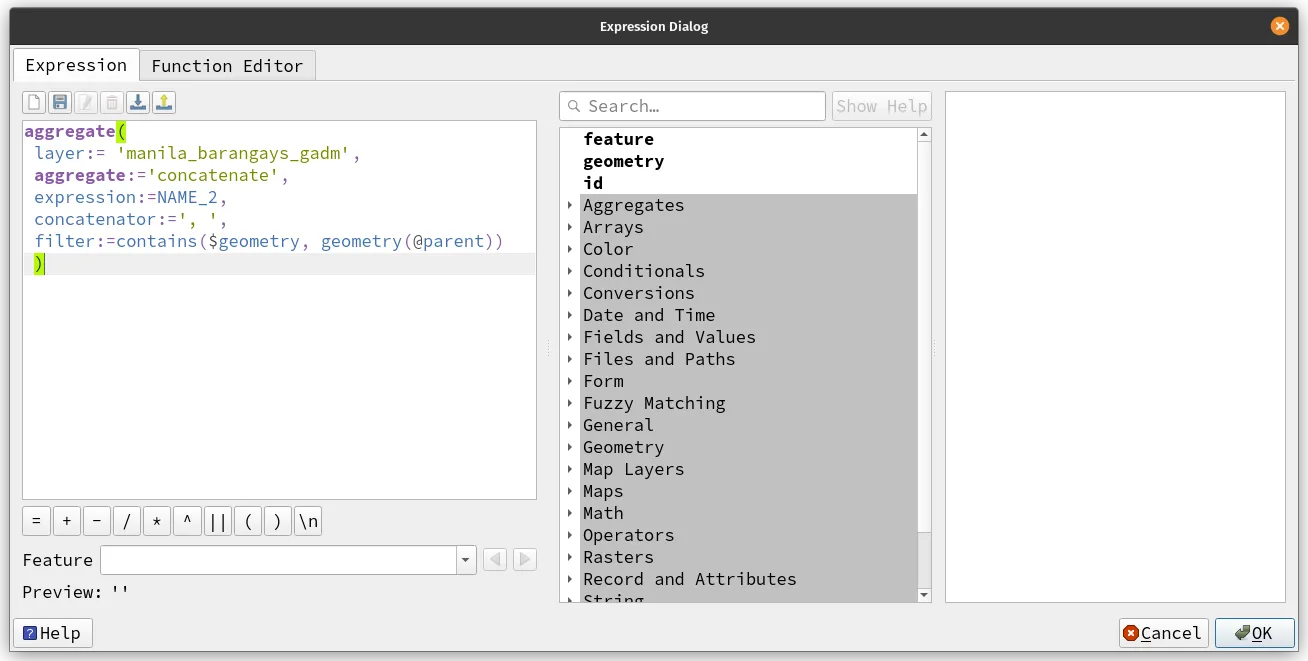
- Essentially, what this expression does is tell QGIS to get the query the NAME_2 field of the manila_barangay_gadm layer and aggregate the value/s (in this case concatenate) based on a spatial filter that we provided: geometry(@parent) refers to the geometry of the feature we will digitize and $geometry refers to the geometry of the features in the manila_barangay_gadm layer.
- Do the same for the barangay field using the following expression for the default value.
aggregate(layer:= 'manila_barangays_gadm',aggregate:='concatenate',expression:=NAME_3,concatenator:=', ',filter:=contains($geometry, geometry(@parent)))- Make sure to check Apply default value on update then click OK.
- Now let’s add/digitize new features in our buildings layer.
- Make sure the Editing mode is on for the buildings layer. You can do this by right-clicking on the layer ‣ Toggle Editing.
- Click on the Add Polygon Feature (CTRL + .) button (
 ) on the Digitizing Toolbar.
 - Find a building on the map that you want to digitize. Make sure that it’s inside of the manila_barangays_gadm layer. Draw the building on the map.
- Right click to finish digitizing/drawing. Notice that the values for the city and barangay fields were automatically filled.
- Repeat this process in other areas on the map.
Exercise 4.3. Finding adjacent polygons
In this exercise, you will use expressions to find the barangays that are adjacent to each barangay in the manila_barangays_gadm. For simplicity, we will define two barangays as adjacent if they “touch”.
What you will do is use expressions in the Field Calculator to create new fields with the following values:
- names of the adjacent barangays (adj), and
- number of adjacent barangays (num_adj).
- Create a copy of the manila_barangays_gadm layer (e.g. Export as new layer) and name it manila_barangays_gadm_new.
- Open the Field Calculator on the manila_barangays_gadm_new layer by clicking the Field Calculator button () from the Attributes Toolbar or in the attribute table of the layer.
- In the field calculator, add the following parameters for creating the adj field.
array_to_string(array_remove_all(aggregate(layer:= 'manila_barangays_gadm',aggregate:='array_agg',expression:=NAME_3,filter:=intersects($geometry, geometry(@parent))), "NAME_3"))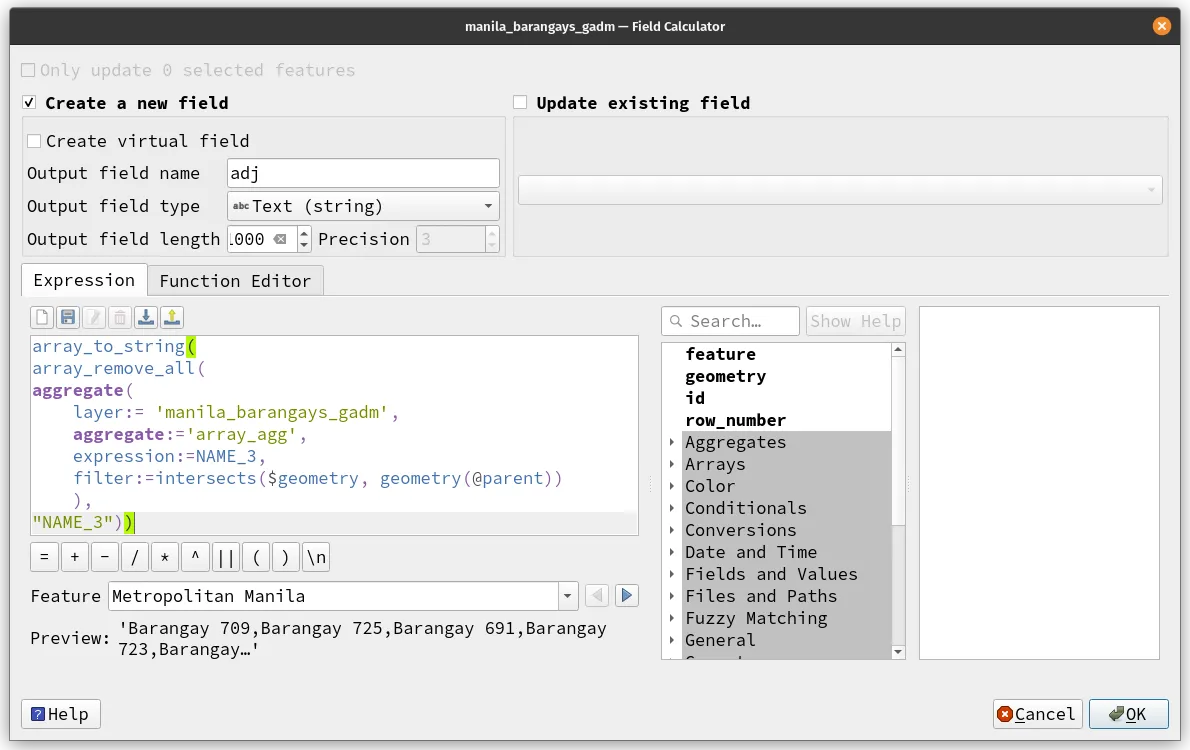
- What this expression does is apply a filter to get the barangay name (NAME_3) of all intersecting features to the current barangay using the array_agg aggregation function. The array_remove_all function removes the name of the current barangay from the array.
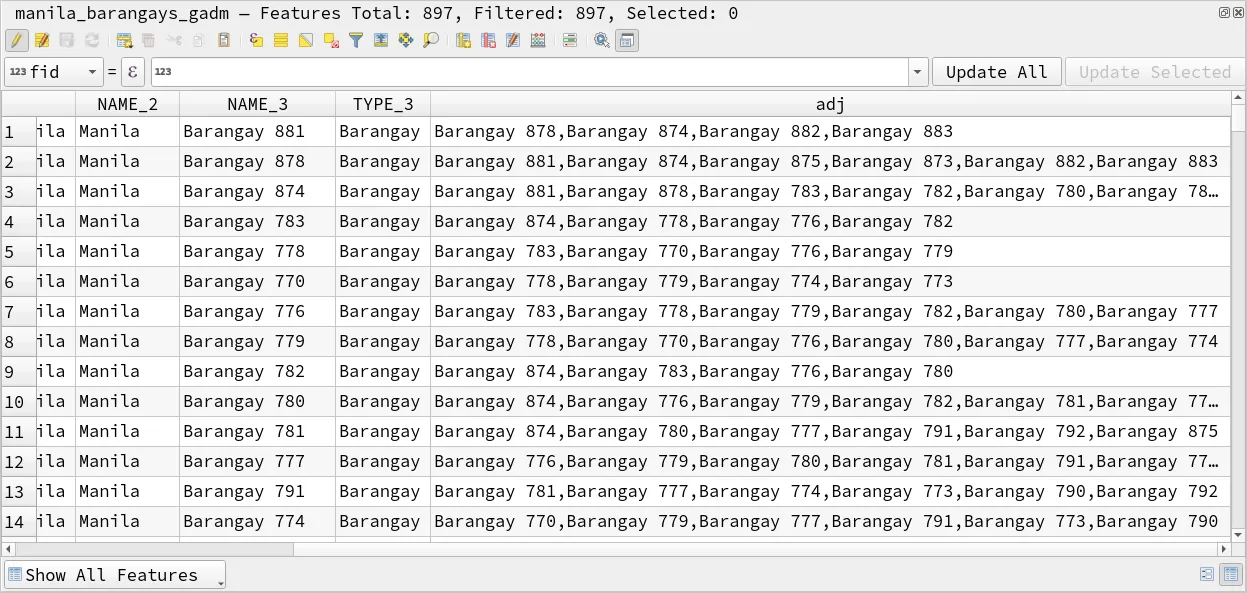
- Click OK and open the attribute table of the manila_barangays_gadm_new layer. You should find there a new field (adj) that contains a comma-separated list of all adjacent barangays to the current barangay. Don’t forget to save your edits.
- To verify our results, we can simply apply a select or filter with the values in the adj field.
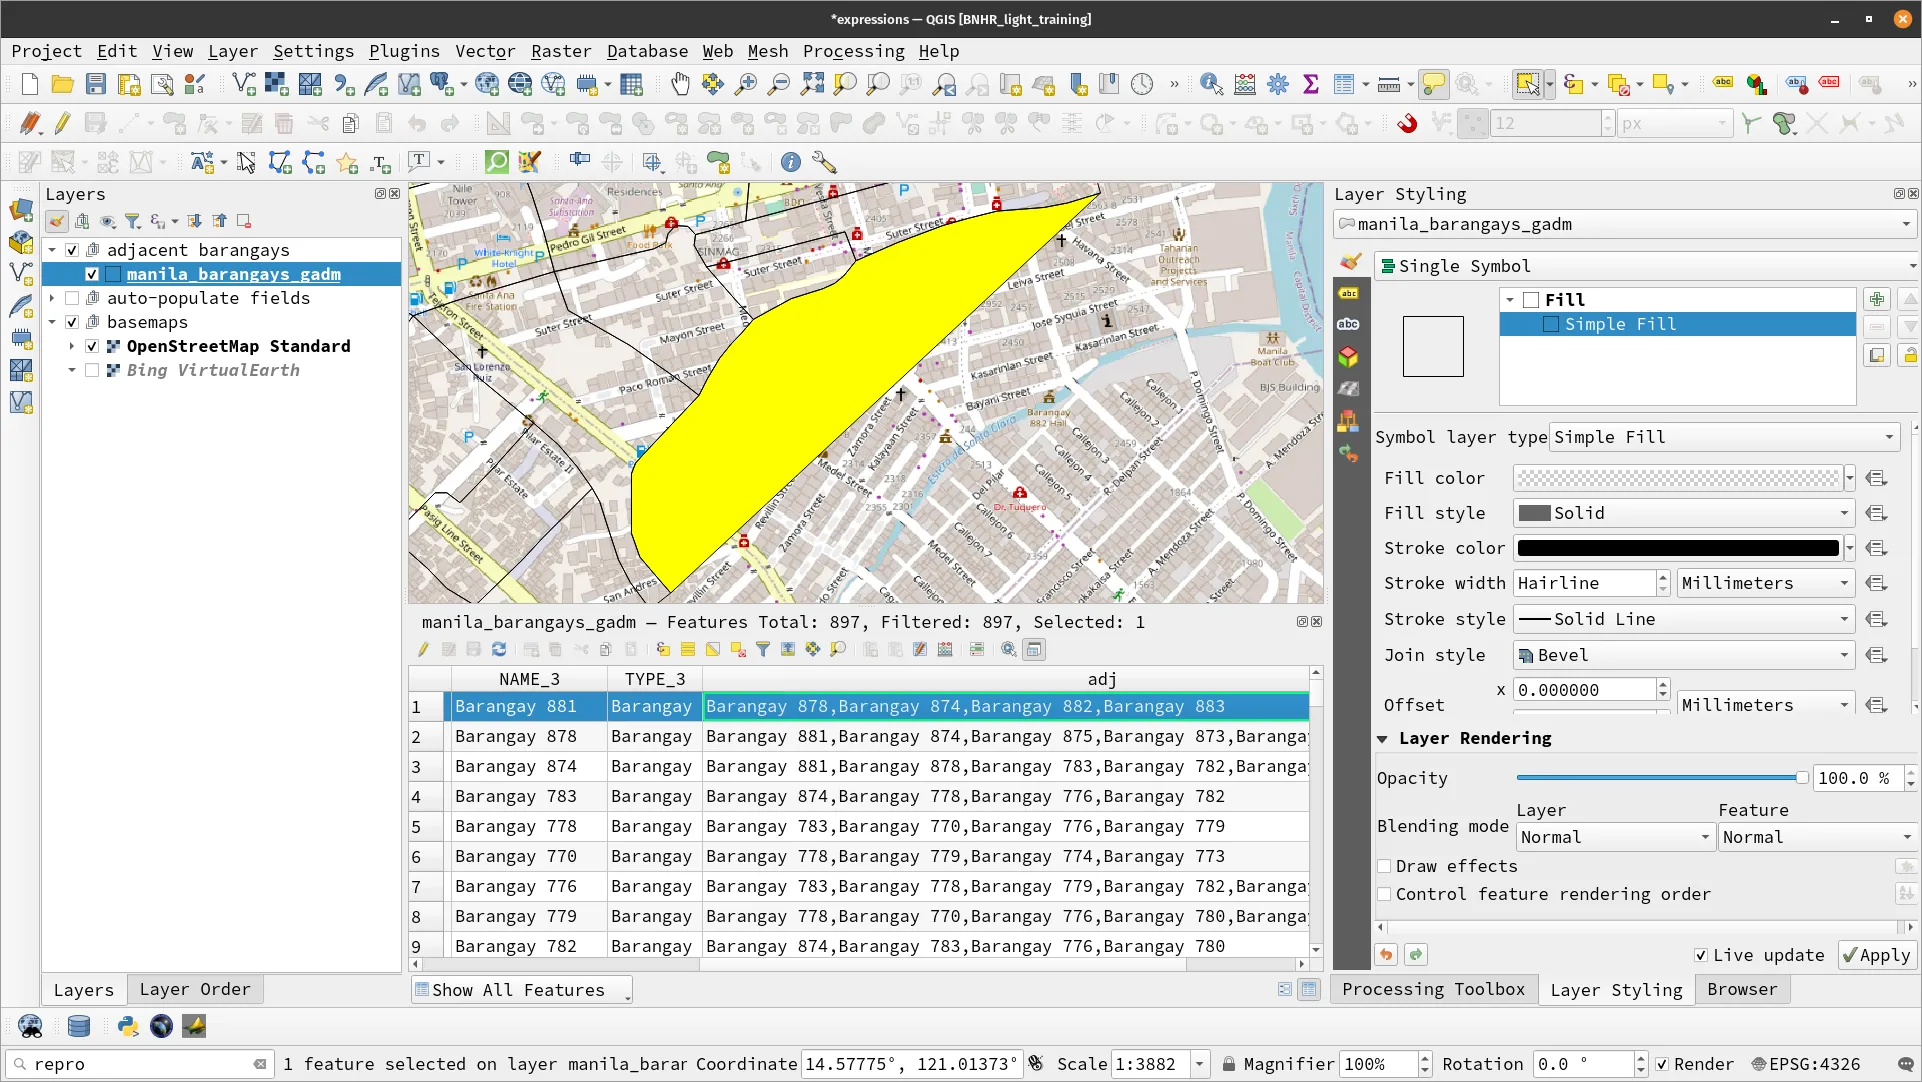
- Below is the feature for Barangay 881. Based on our computation, it has the following adjacent barangays: Barangay 878, Barangay 874, Barangay 882, Barangay 883
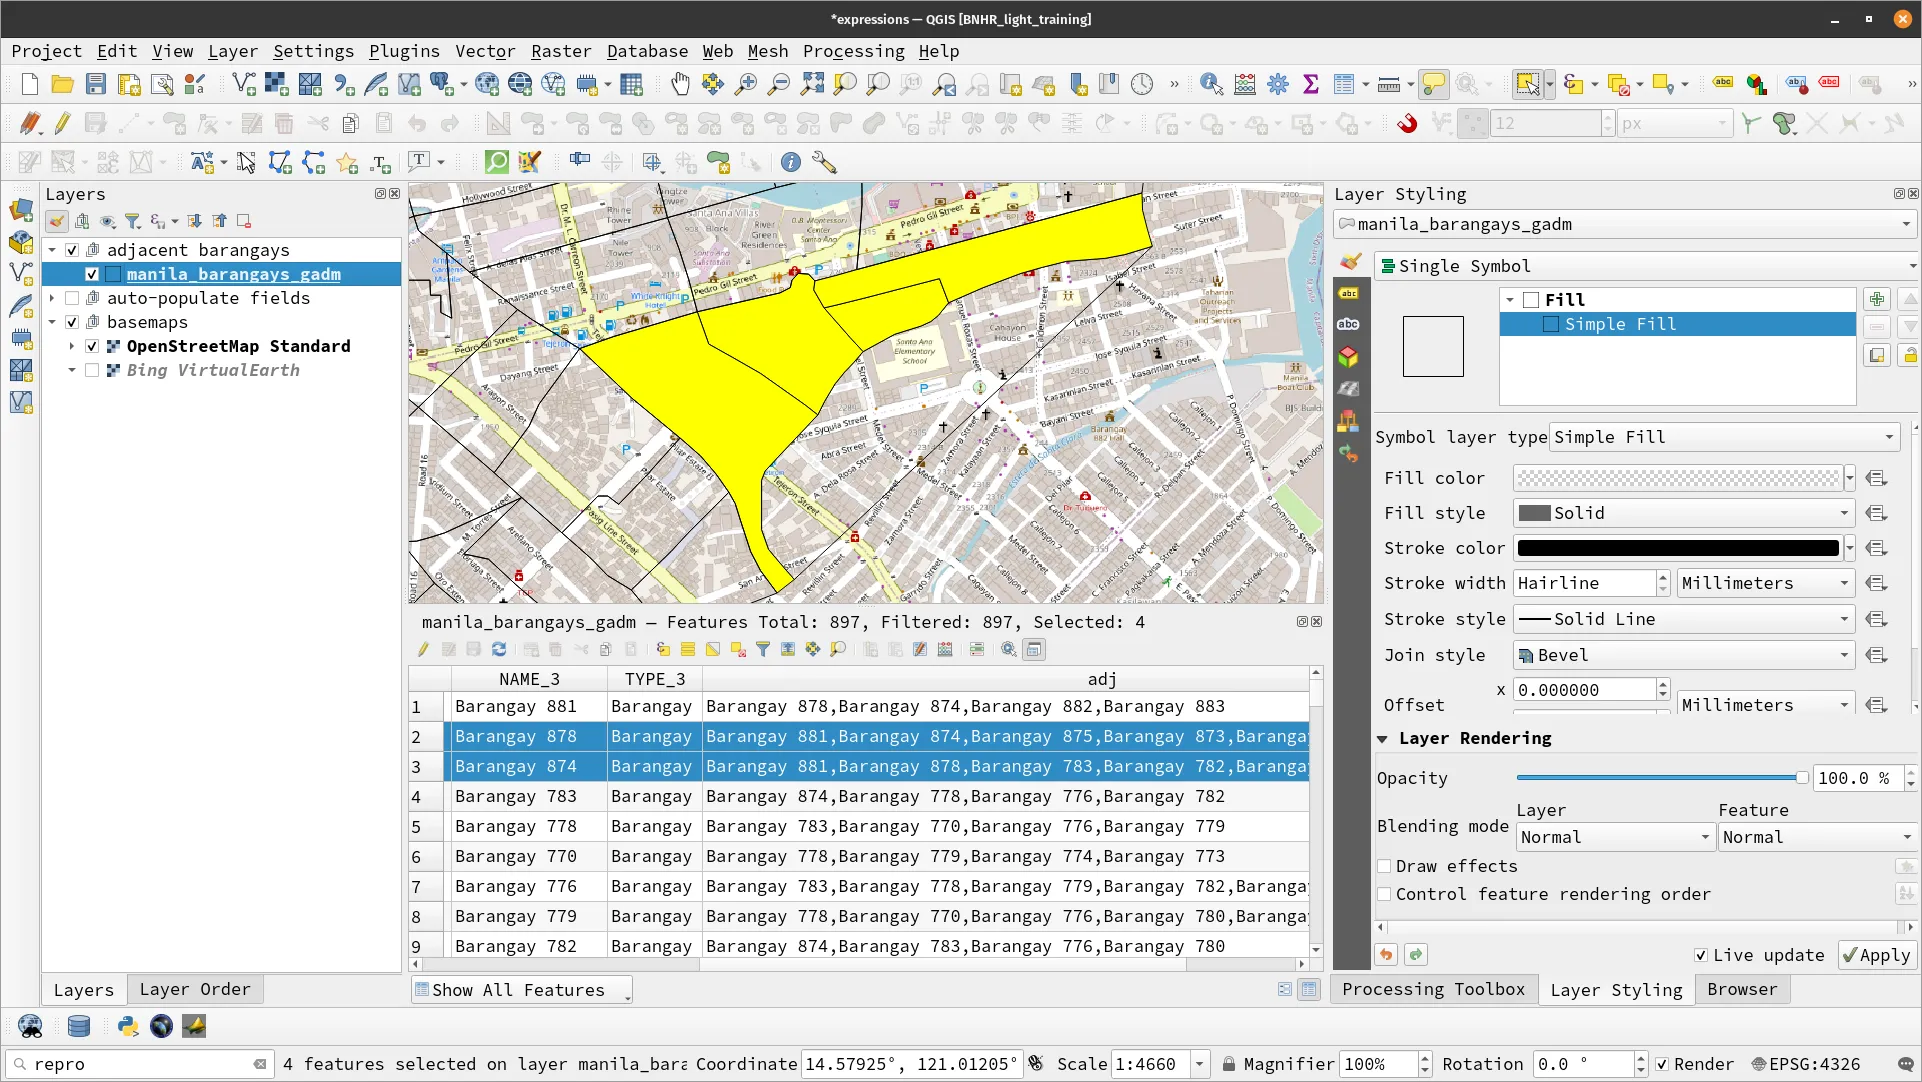
- We can apply a selection or filter to check if the adjacent barangays we obtained are indeed correct. Open the Select by Expression tool and put the following parameters:
NAME_3 IN ('Barangay 878','Barangay 874','Barangay 882','Barangay 883')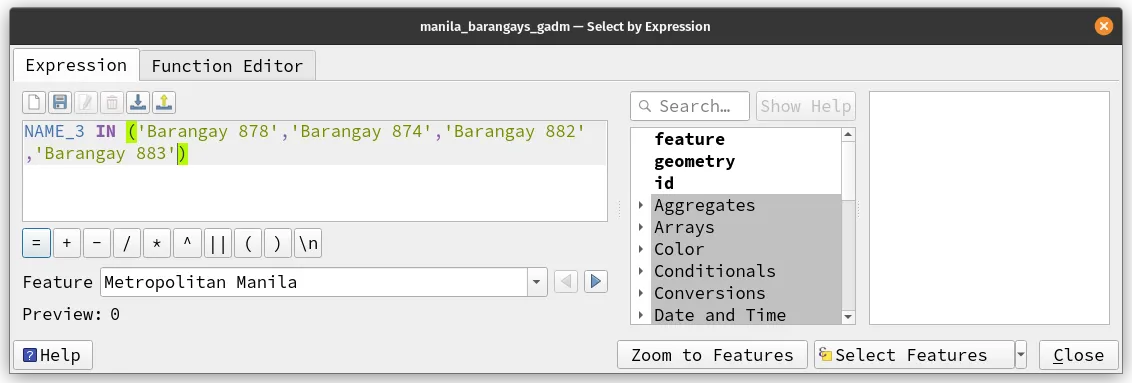
- Checking the results verifies our computation.
Exercise 4.4. Using expressions in styling
Aside from processing data, expressions also have a lot of uses in styling layers especially when using them for data-defined overrides and geometry generators
In this exercise, you will style the ncr_municities_pop layer as a cartogram showing two variables:
- The size of the cartogram will pertain to the population density of the city/municipality in 2020.
- The color of the cartogram will pertain to the average annual change in population between 1990 and 2020.
- Open the ncr_municities_pop layer and open its attribute table.
- Notice that the only variables we have, aside from the names of the areas, are population count in 1990, 2010, and 2020.
- First let’s start with the color of the map.
- The color of the cartogram will pertain to the average annual change in population in each city/municipality from 1990 to 2020. Mathematically, this can be computed using a simple formula like:
(pop2020 - pop1990) / (2020 - 1990)As mentioned before, you can think of expressions as formulas.
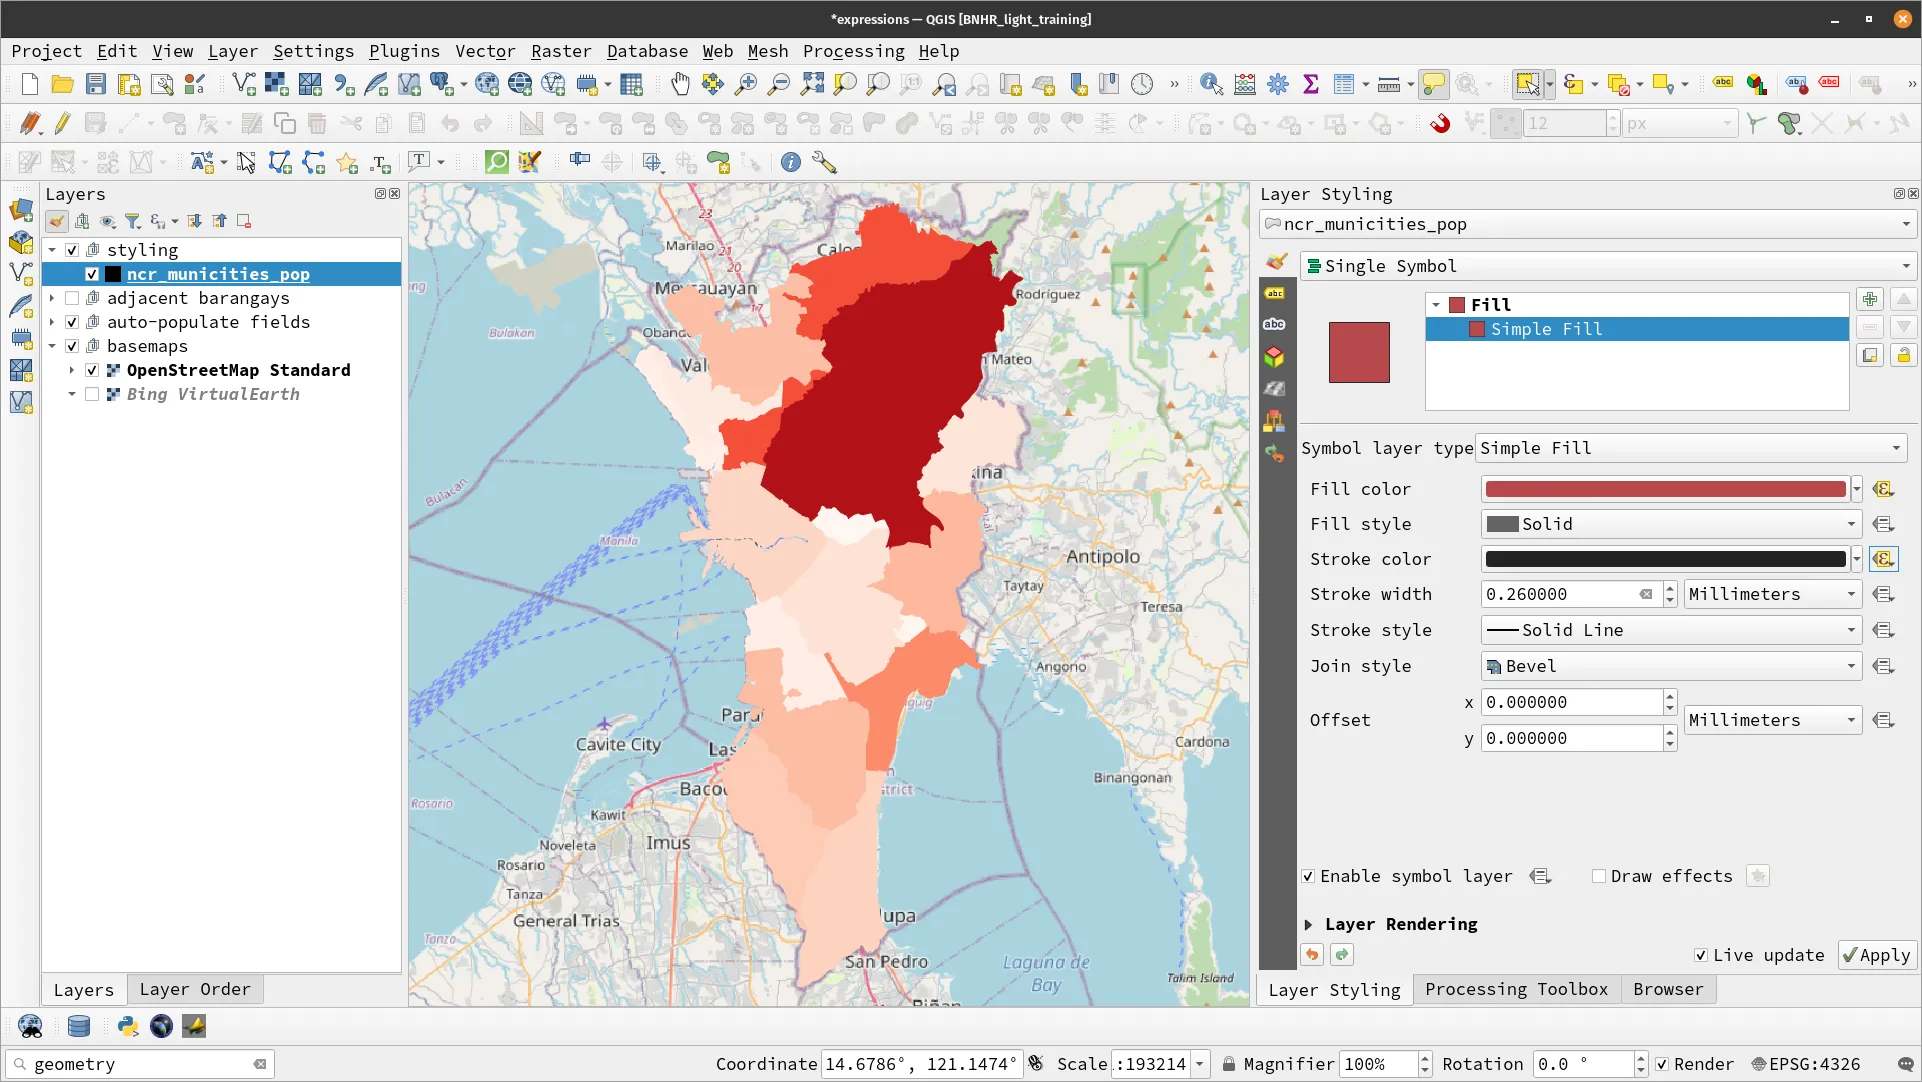
- On the Layer Styling panel (or Layer Properties), apply a Single Symbol symbology to the ncr_municities_pop layer with a Simple Fill layer type. This will be the base of our symbology.
- Notice the data defined override buttton () to the right of the different styling parameters. This means that these paramaters—e.g. Fill color, Stroke color, etc.—can be overridden by dynamic values. In fact, these parameters accept expressions as input.
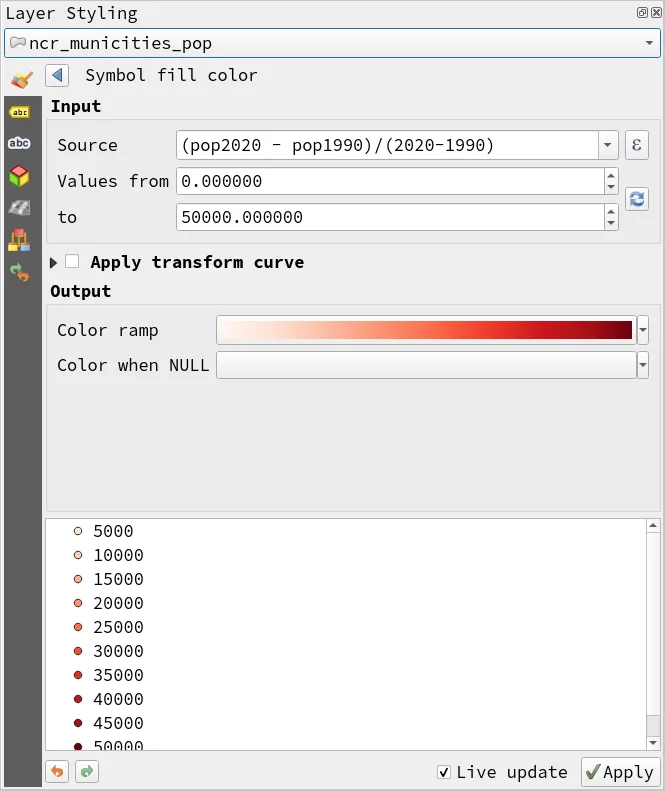
- Start with the Fill color parameter, click the defined override buttton () and click Assistant. This will open the data defined assistant dialog. This makes it easier to create data-defined overrides. In this case, the assistant will help you create a color ramp based on the Source that you provide.
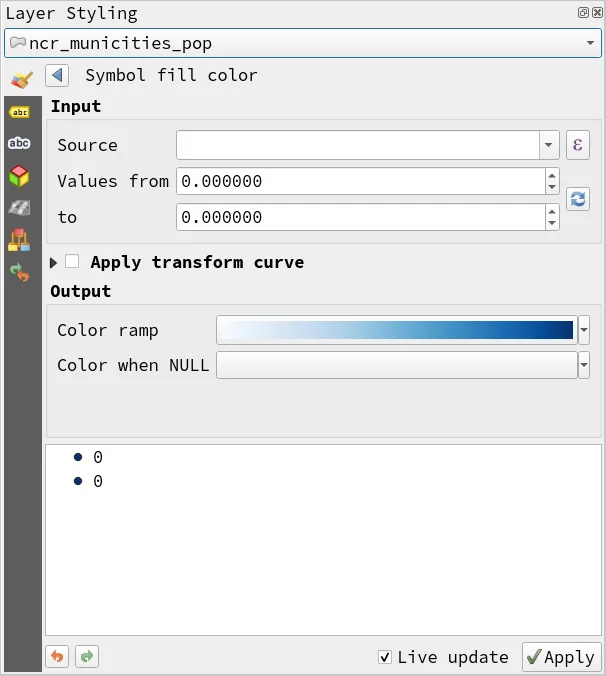
- The value for the Source is usually a field but notice that it has the expression symbol to the left of it (). This means that it also accepts expressions as input. Instead of selecting a field, you will use an expression to make the source be the annual average change in population from 1990 to 2020.
- Click the expression button () to open the Expression dialog.
- Apply the following expression.
(pop2020 - pop1990) / (2020 - 1990)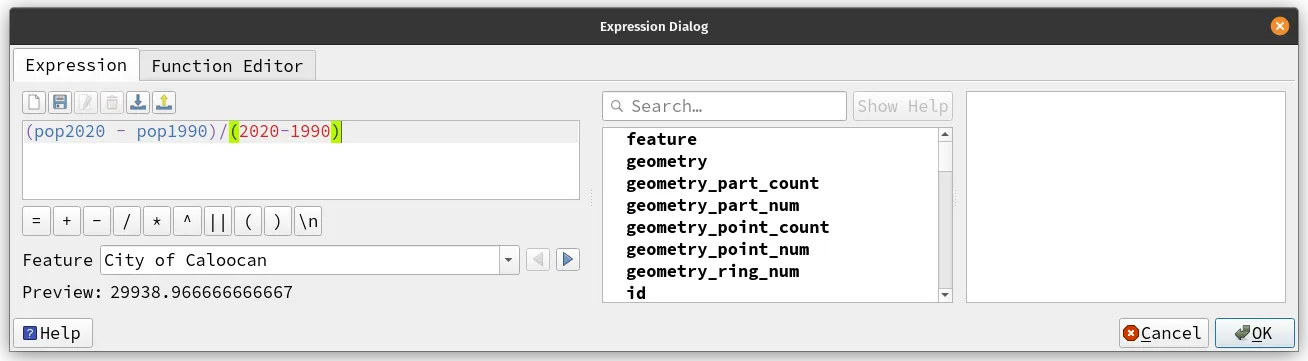
- Set the Values from 0 to 50000 and select the Reds Color ramp. (Or you can change this according to your preference)

- Now you do the same with Stroke color.
- Your map should now look like below.
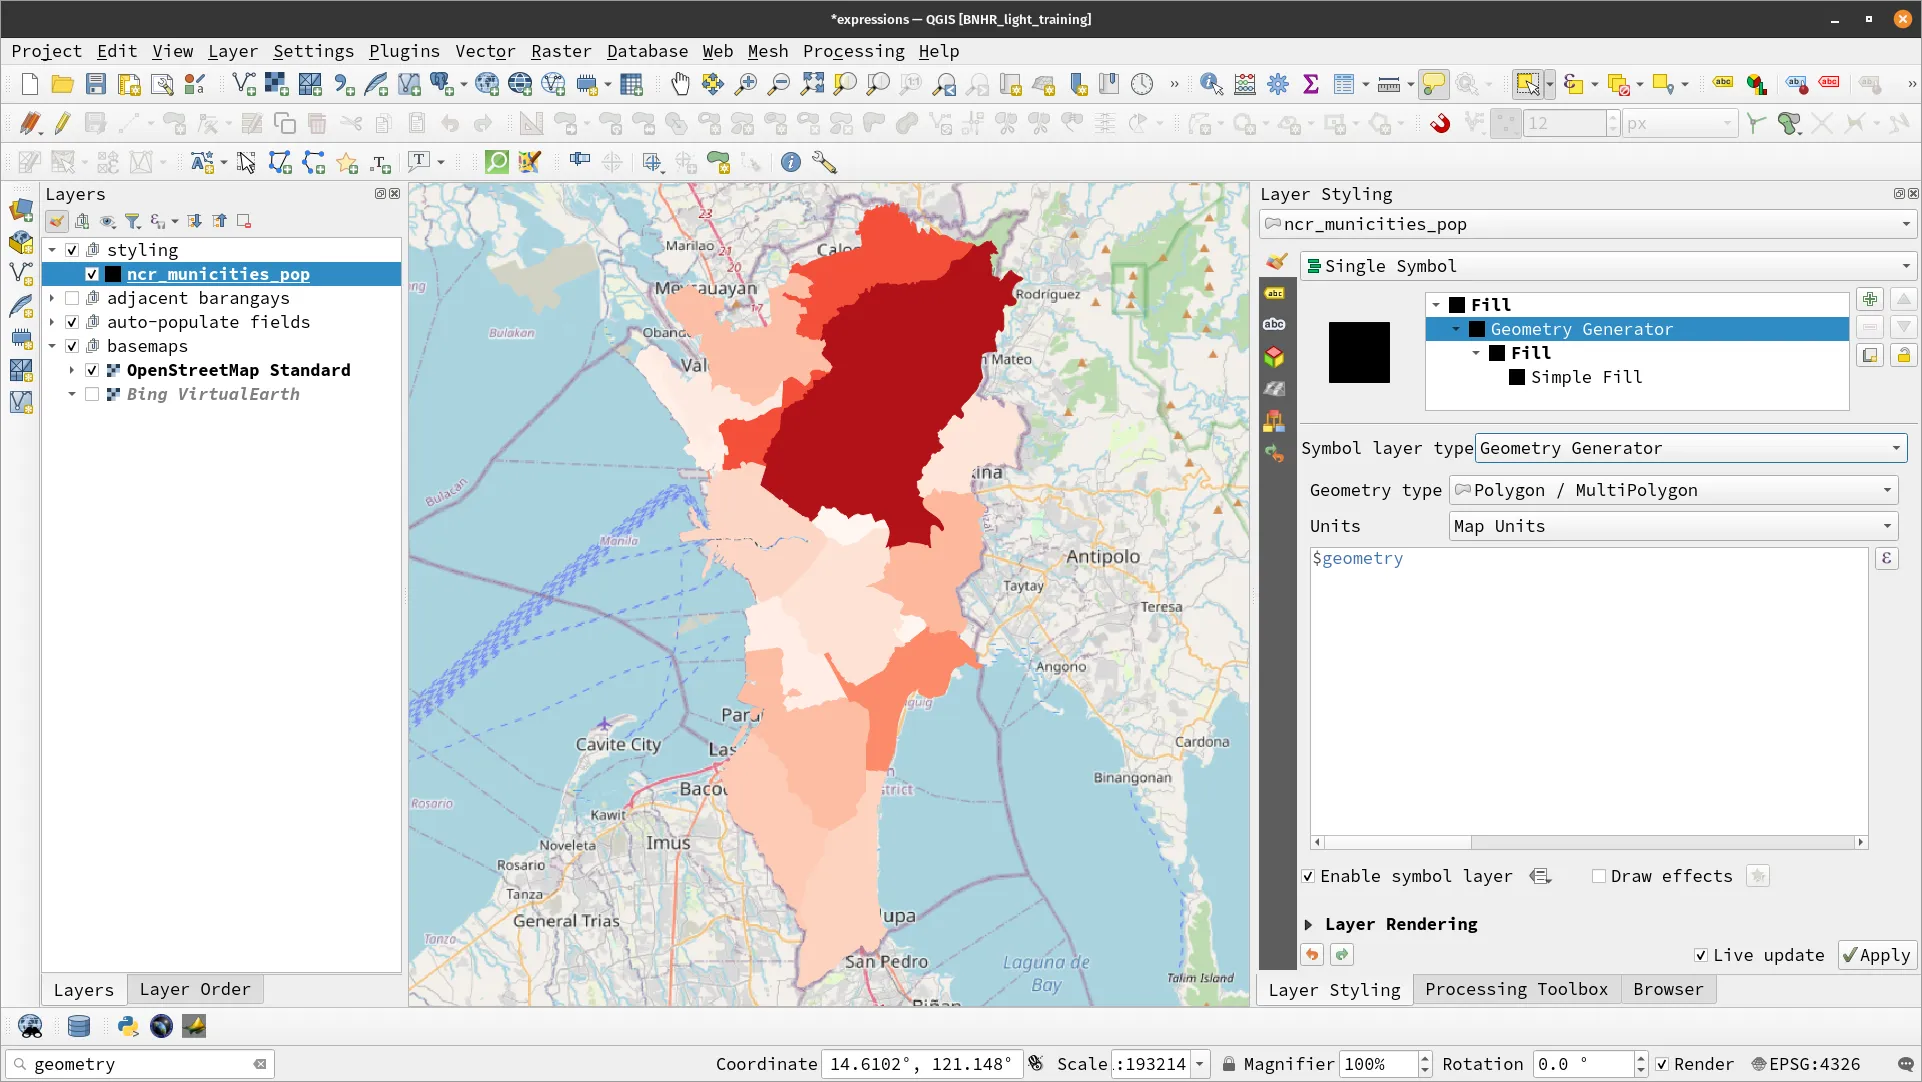
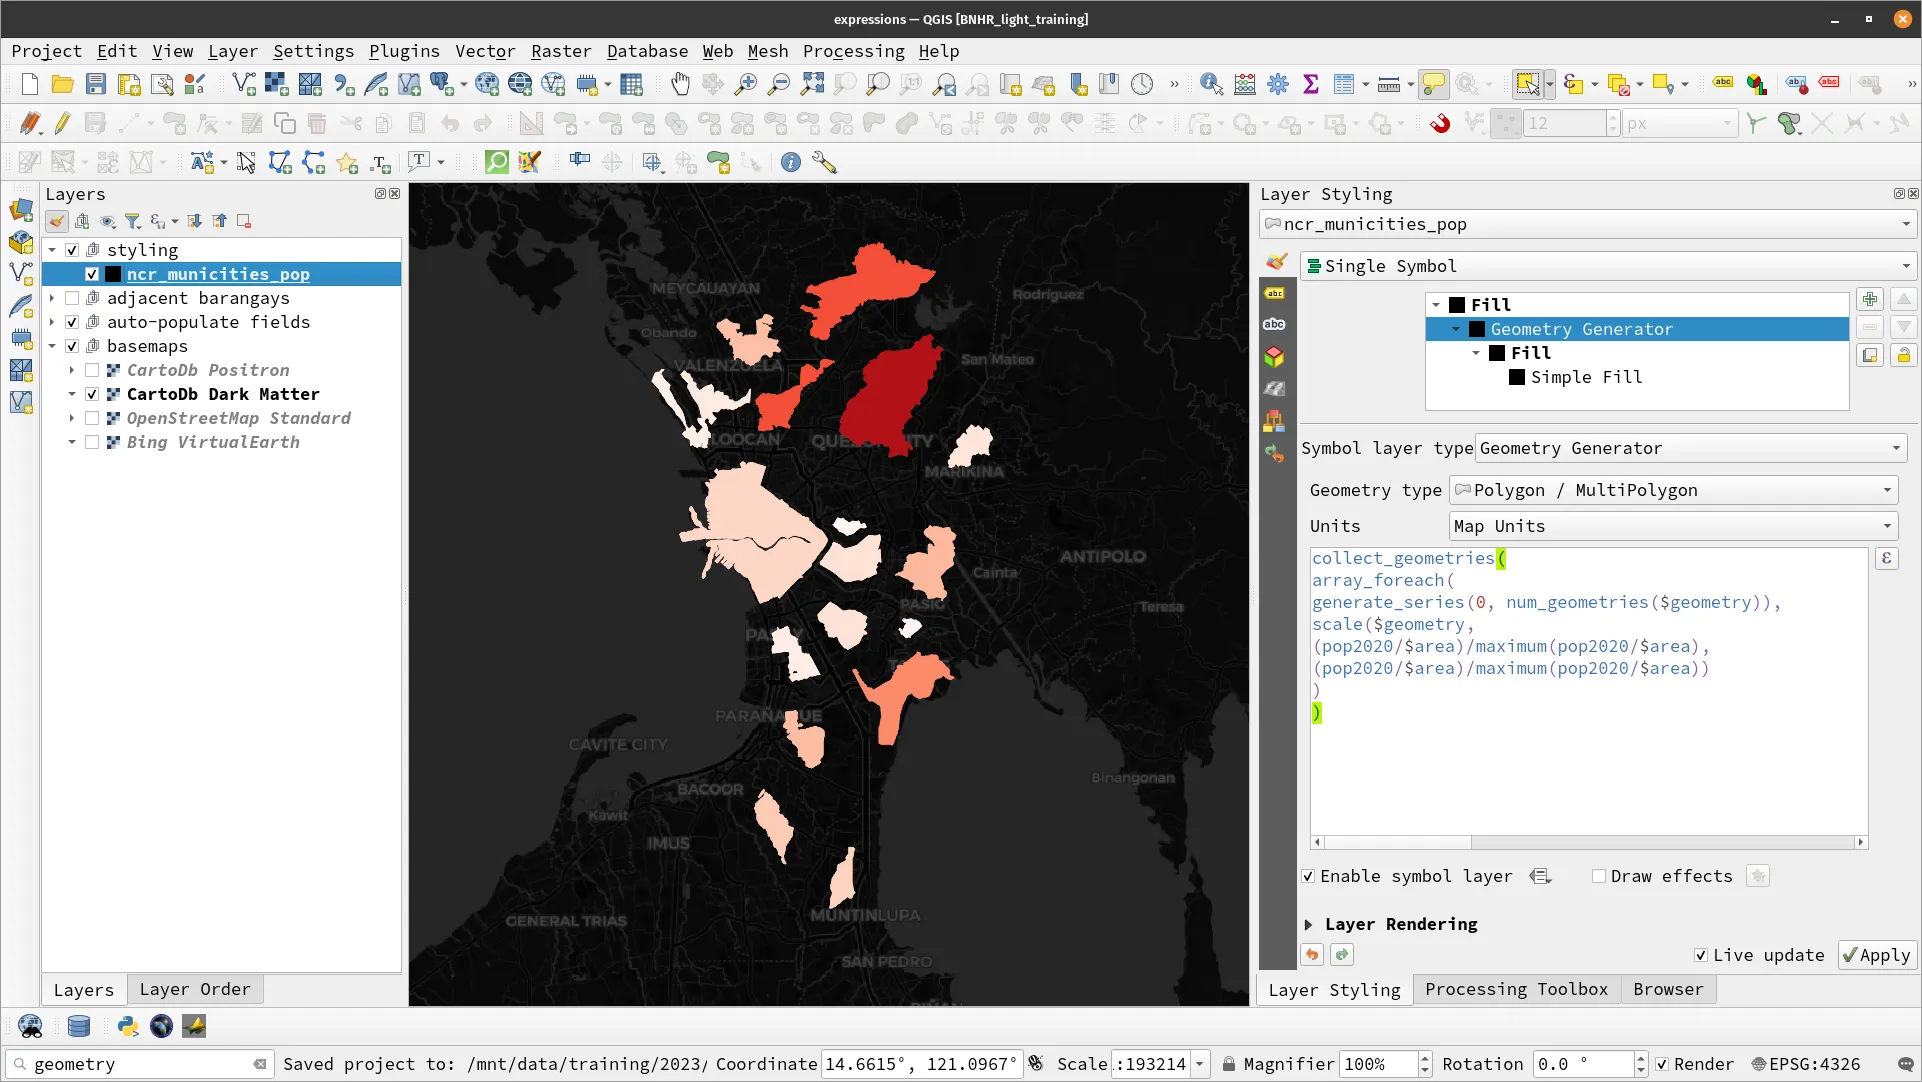
- Next, let’s do the size. Here, you will use a geometry generator combined with the scale function, released in QGIS 3.24, together with several other functions.
- On the Layer Styling panel for ncr_municities_pop, change the Symbol layer type to Geometry Generator.
-
Notice that the geometry generator definition also accepts Expressions (see expression button (
) on the right of the space for writing the geometry generator text). -
Write the following Expression:
collect_geometries(array_foreach(generate_series(0, num_geometries($geometry)),scale($geometry,(pop2020/$area)/maximum(pop2020/$area),(pop2020/$area)/maximum(pop2020/$area))))- The size of the features should change and you will have the following map.
Certification and support
Contact us or sign-up to our courses if you are interested in having this as an instructor-led or self-paced course.