
Working with attributes
Before we begin
Section titled “Before we begin”What we want to achieve
Section titled “What we want to achieve”- Create a barangay-level layer with population data from 2000 to 2020.
- Create a district-level layer with population data from 2000 to 2020.
- Style the barangay-level and district-level layers based on population density and annual rate of population growth from 2000 to 2020.
What we have
Section titled “What we have”-
bnhr_qgis-architects-planners-urban-001.gpkg that contains:
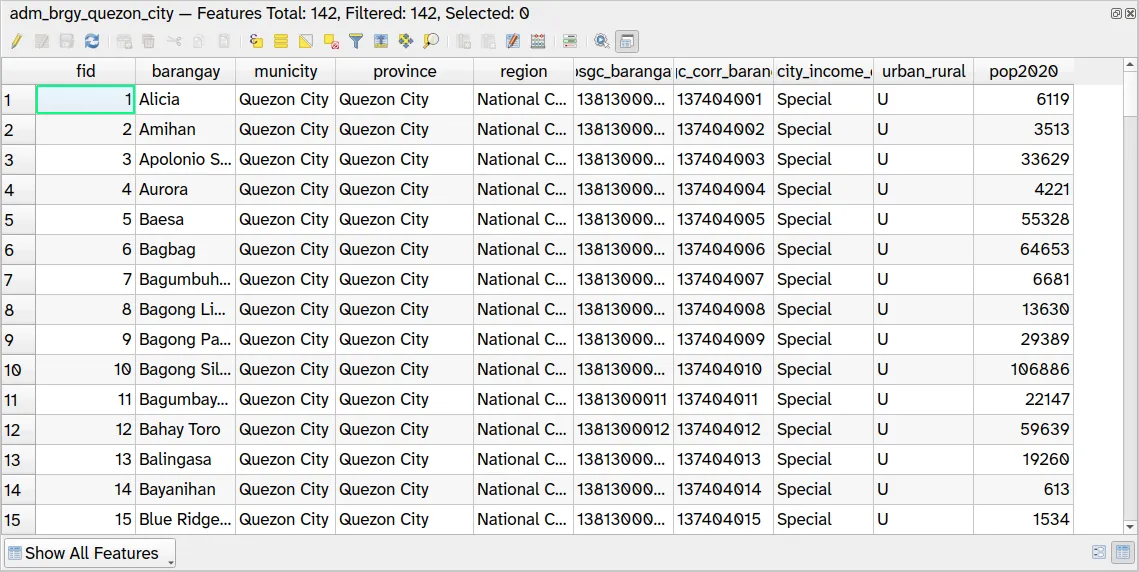
- adm_brgy_quezon_city - polygon layer containing the 142 barangays in Quezon City with the following attributes:
- barangay: name of the barangay
- municity: name of the city or municipality
- province: name of the province
- region: name of the region
- psgc_barangay: Philippine Standard Geographic Code (PSGC) of the barangay
- psgc_corr_barangay: PSGC Correspondence Code of the barangay,
- city_income_class: city income class
- urban_rural: urban or rural classification fo the barangay
- pop_2020: population of the barangay in 2020
- adm_brgy_quezon_city - polygon layer containing the 142 barangays in Quezon City with the following attributes:
-
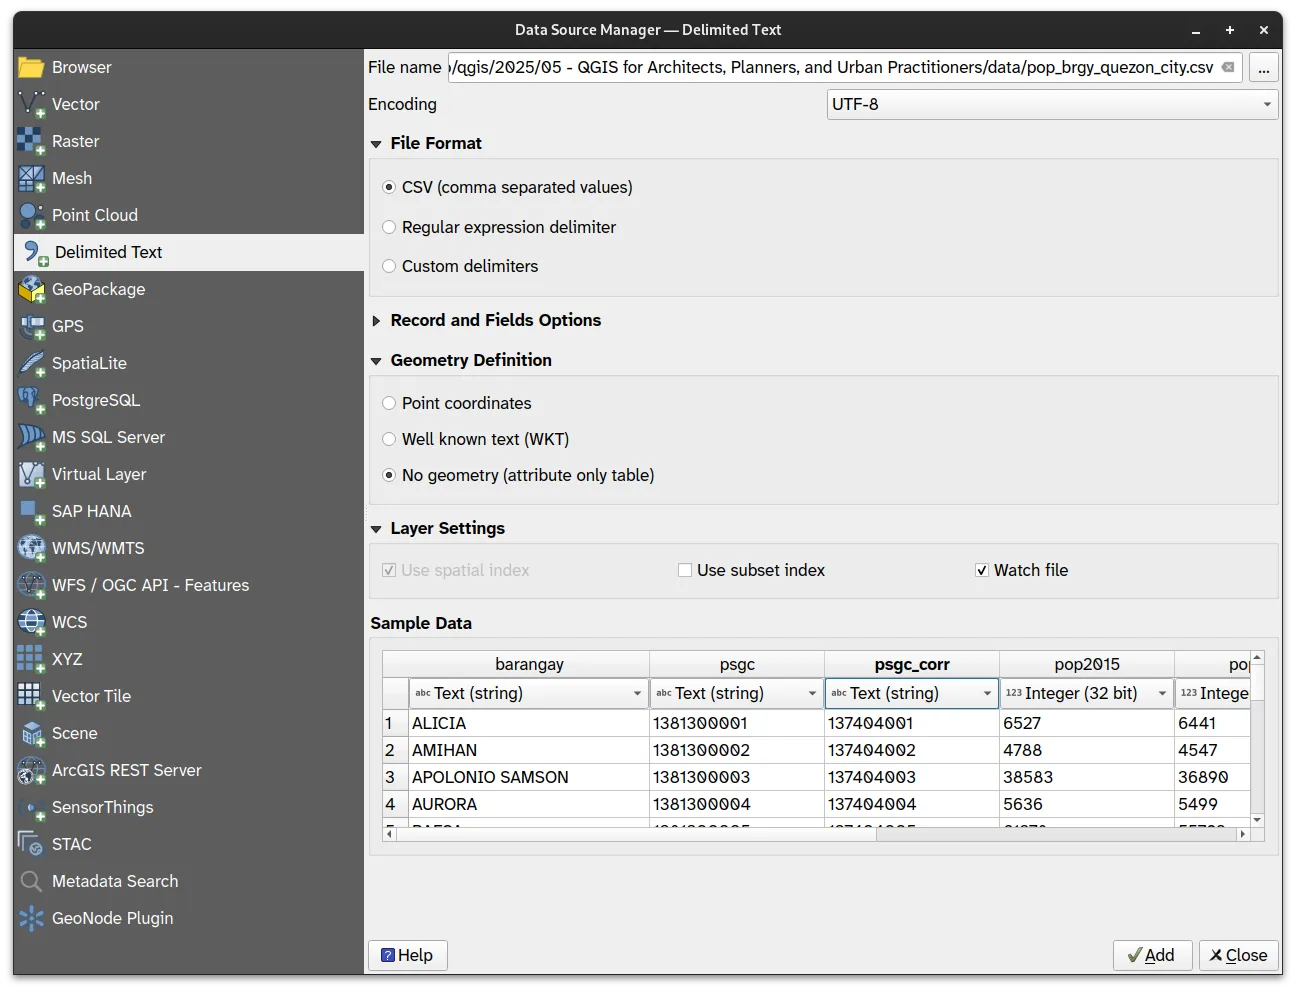
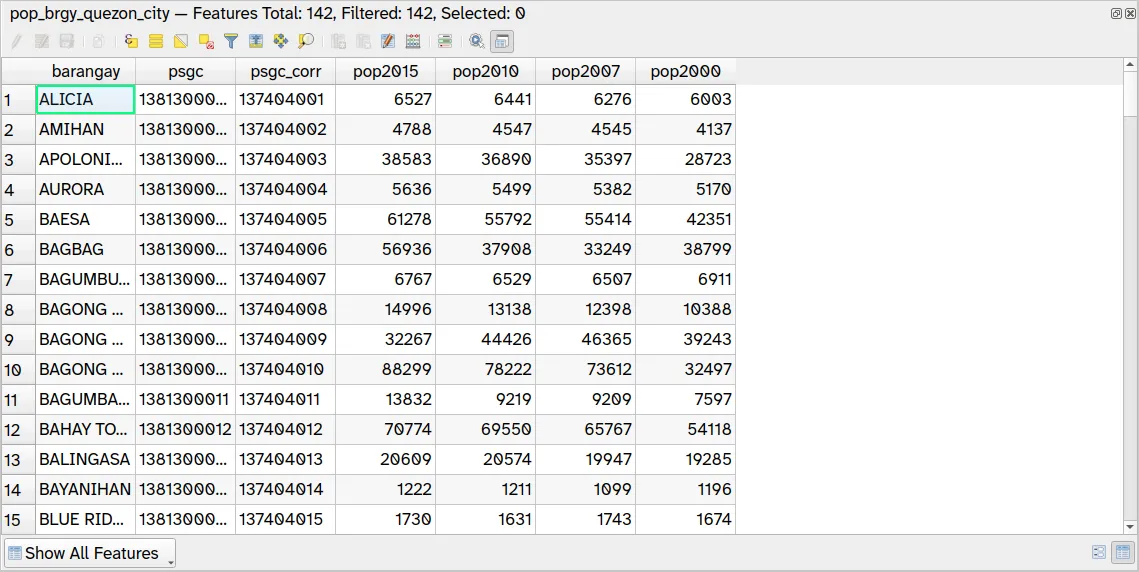
pop_brgy_quezon_city.csv - CSV file containing population data from 2000 to 2015 per barangay in Quezon City
-
quezon-city-barangay-per-district.rtf - text document listing down the barangays per district in Quezon City
Relevant QGIS knowledge/skills
Section titled “Relevant QGIS knowledge/skills”- Attribute table
- Selects and filters by attribute
- Attribute joins
- Field calculator
- Expressions
- Data-defined overrides
Exploring the data
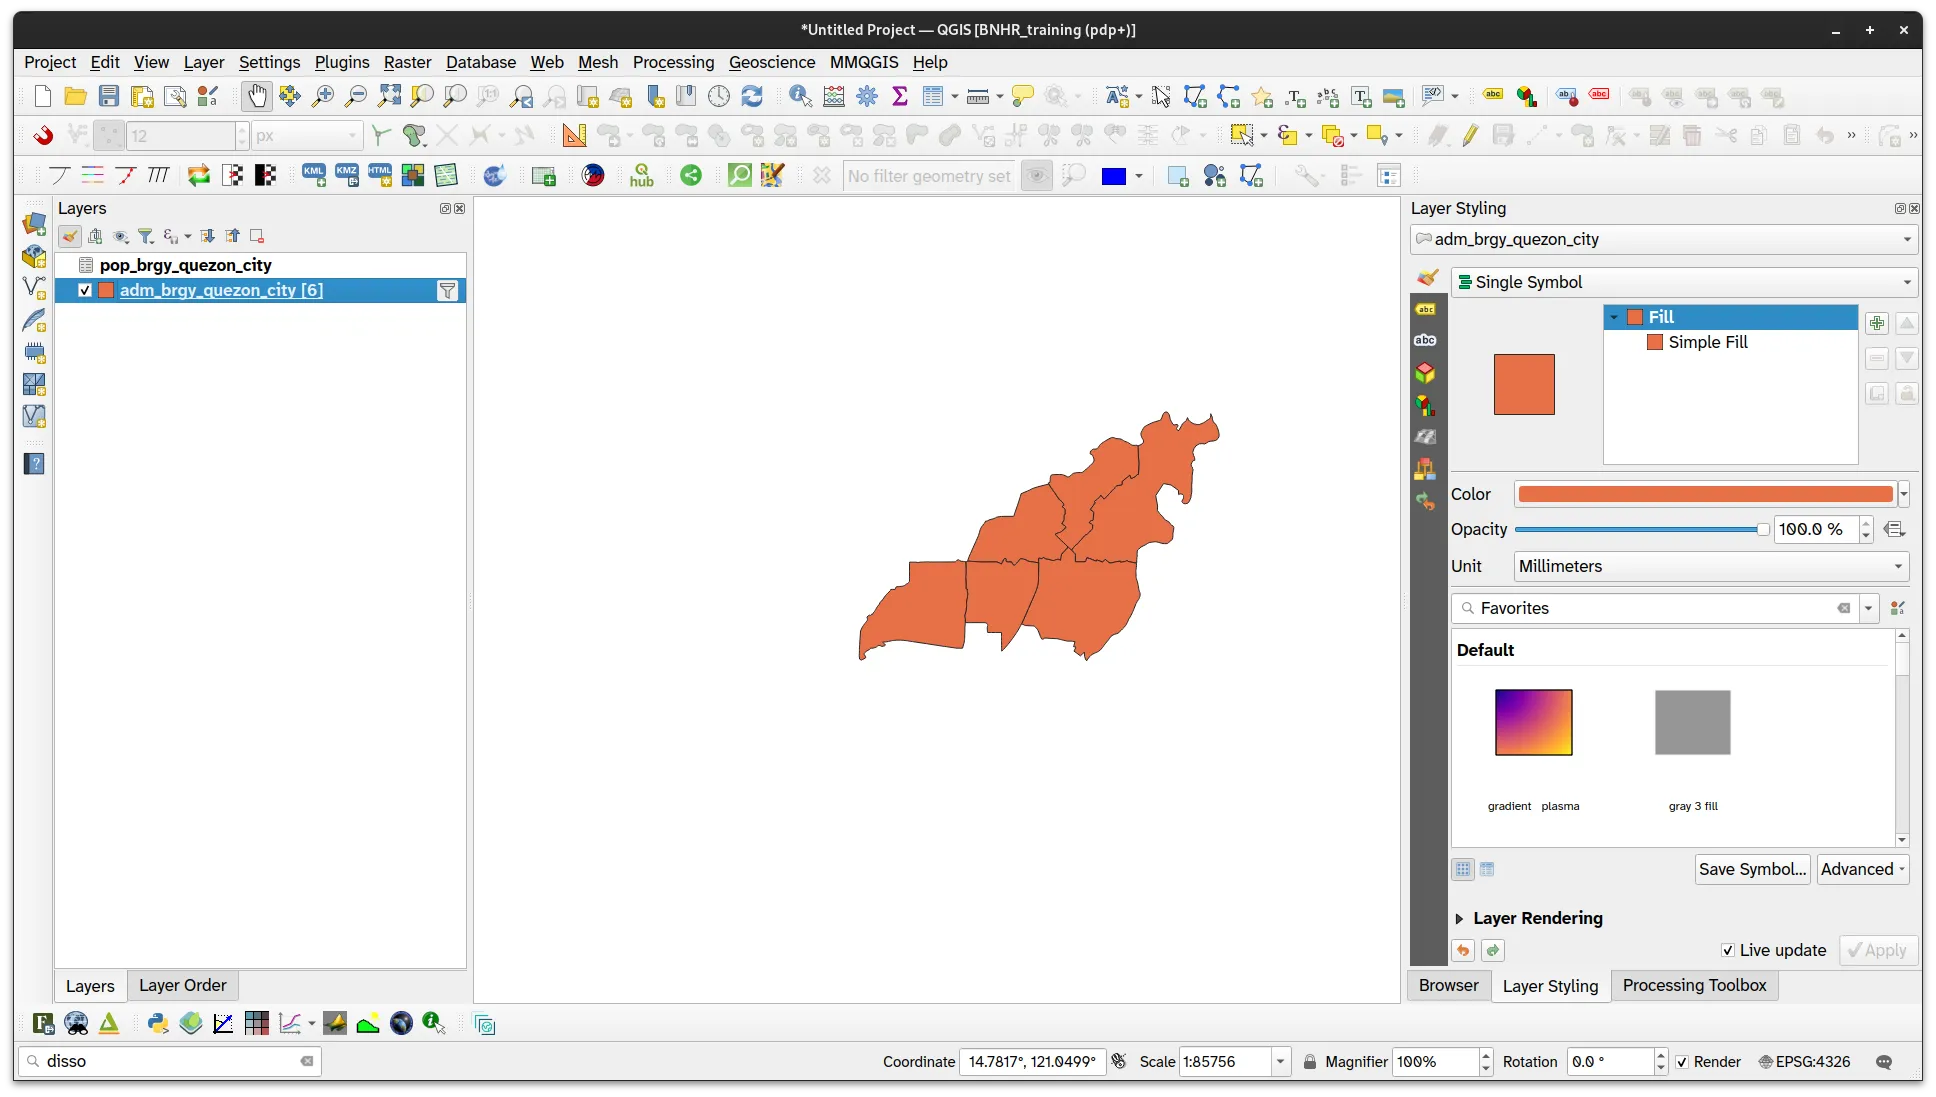
Section titled “Exploring the data”First, let’s explore the data to see what we’re working with.
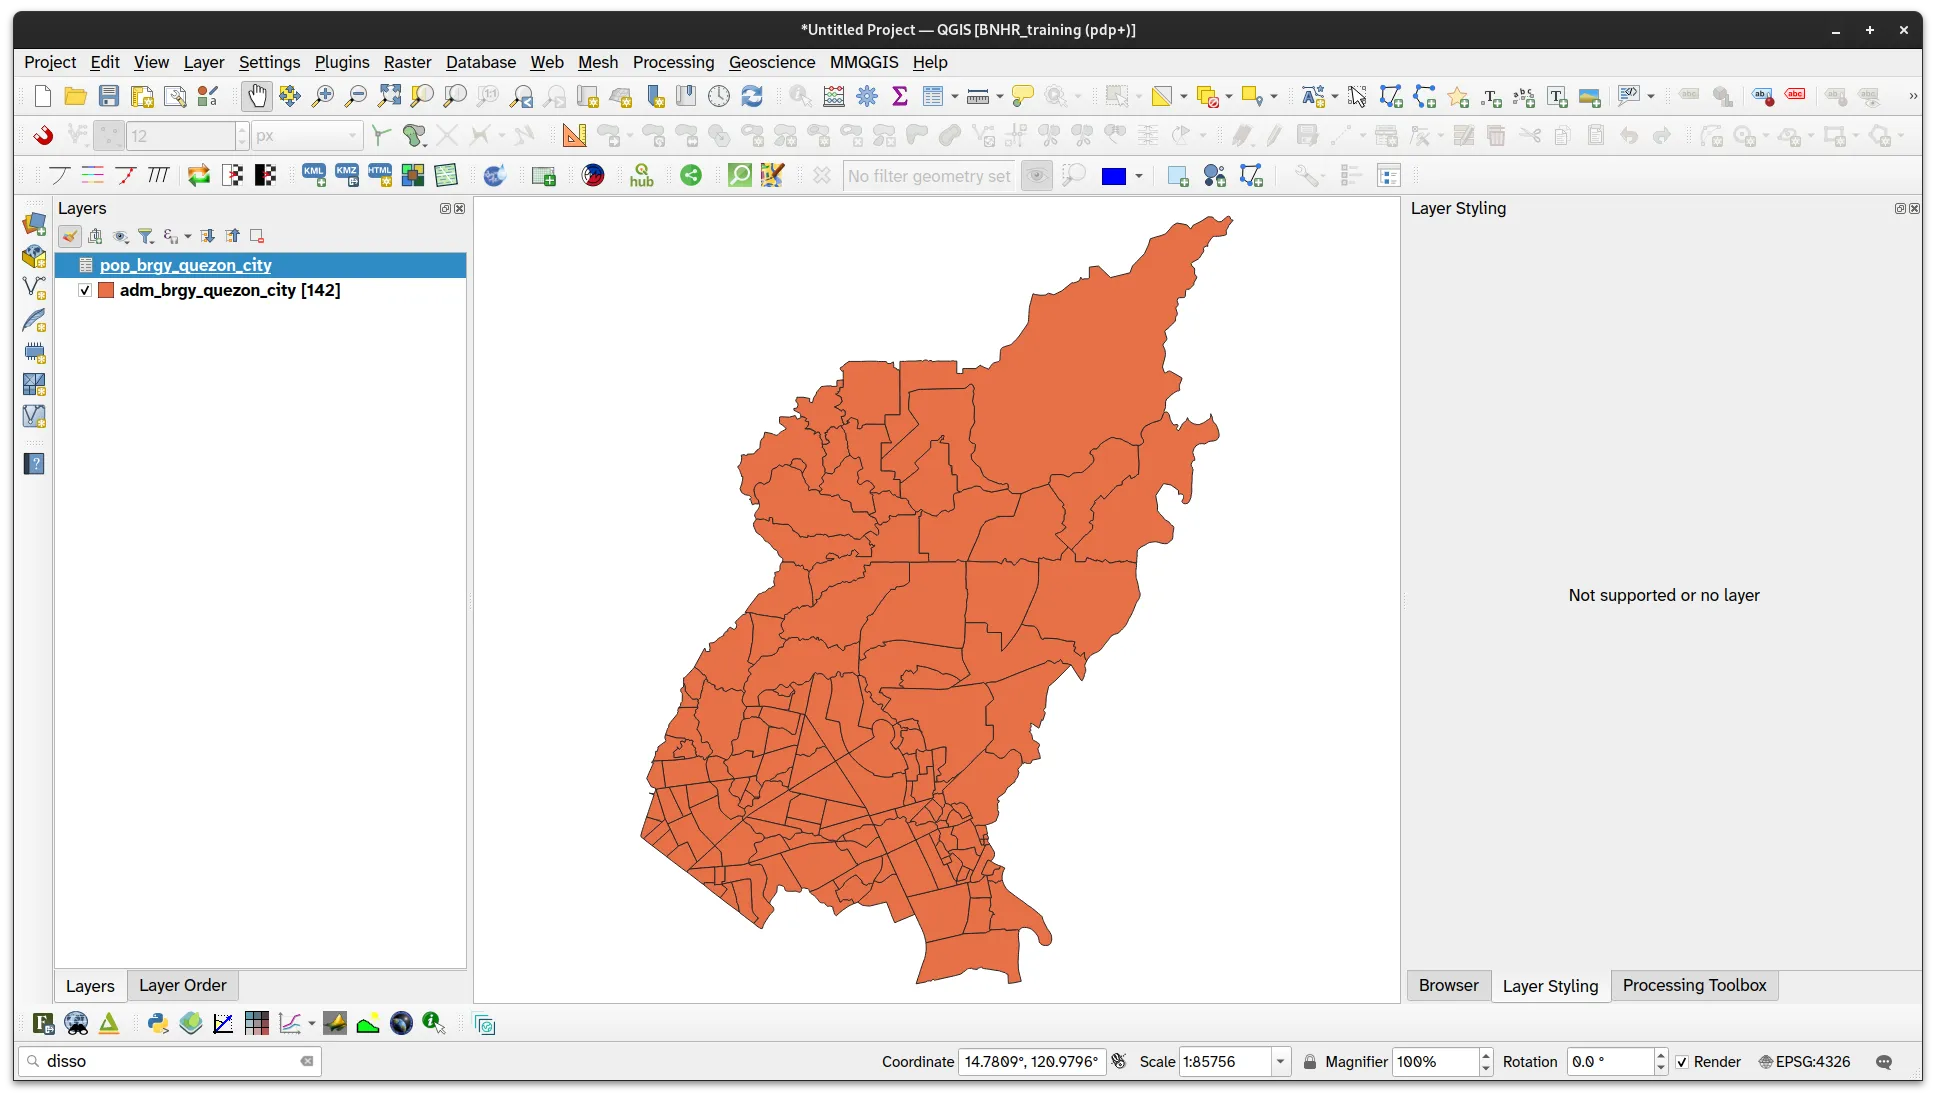
- Load the adm_brgy_quezon_city vector layer and pop_brgy_quezon_city.csv in QGIS.
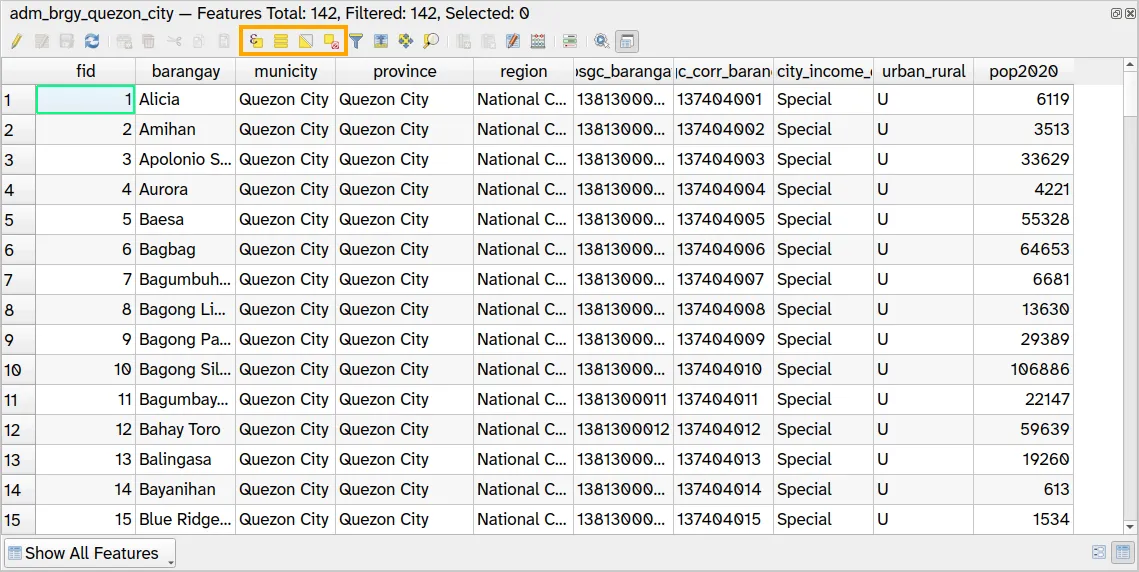
1.1. Opening the attribute table
Section titled “1.1. Opening the attribute table”Let’s look at the attribute table of both layers.
- You can open the attribute table of a layer by:
- Right-click layer ‣ Open Attribute Table,
- Open Attribute Table in the Attributes Toolbar, or
- Clicking F6 while a layer is active/selected
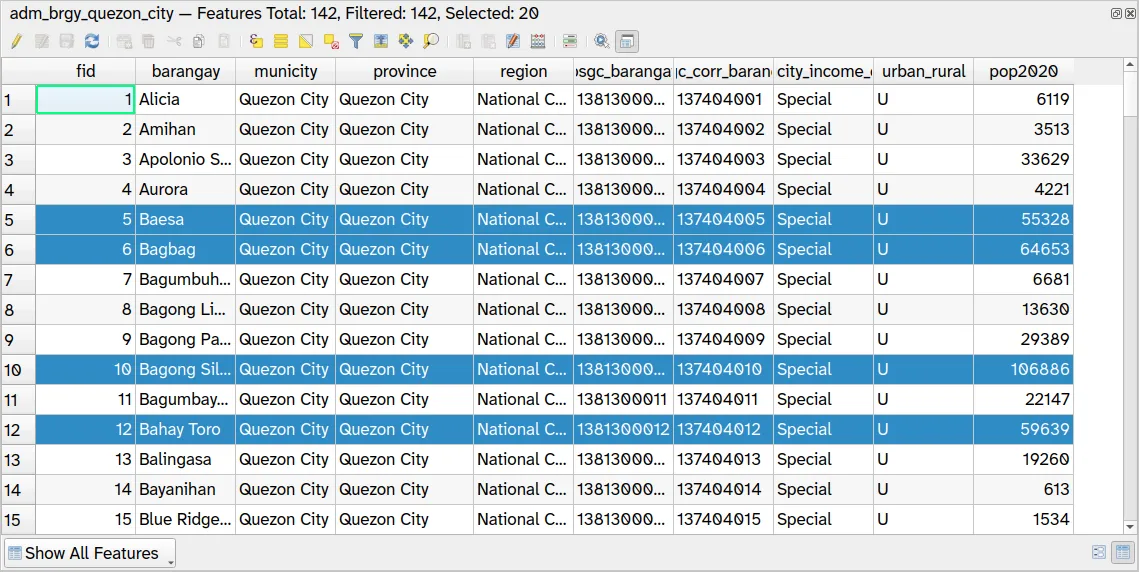
1.2. Selecting or filtering the data
Section titled “1.2. Selecting or filtering the data”Let’s try to select and filter features based on their attributes.
To apply a selection, you can use the options on the attribute table or the Selection Toolbar.
![]()
-
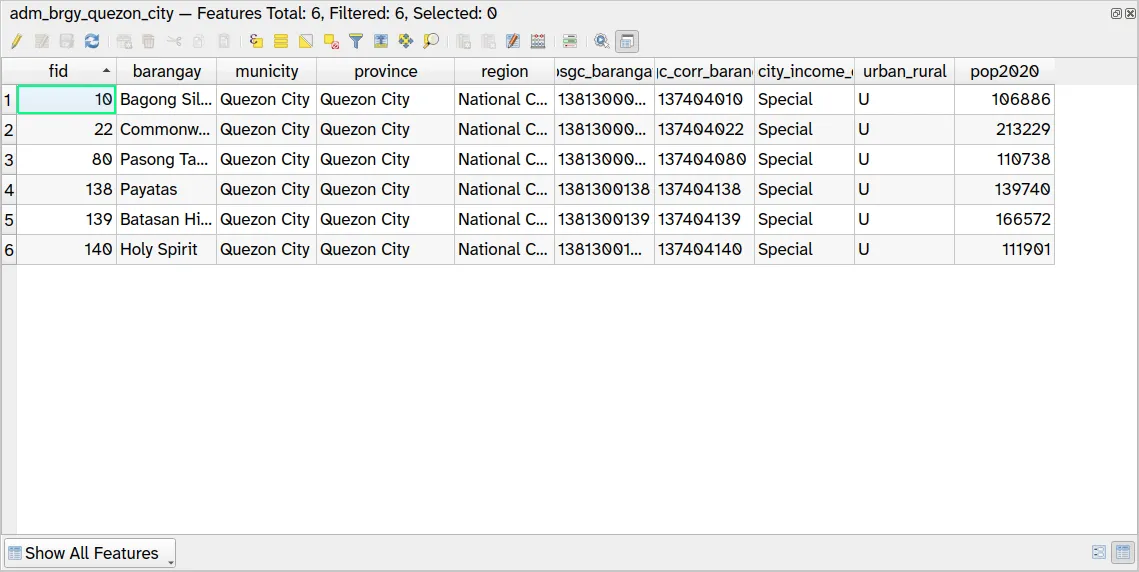
Select the barangays with population in 2020 greater than 10000 using a Select Features by Value. You can open the Select Features by Value dialog by clicking the appropriate button (
 ) on the attribute table of the layer. Alternatively, you can go to Select Features by Value in the Selection Toolbar.
 -
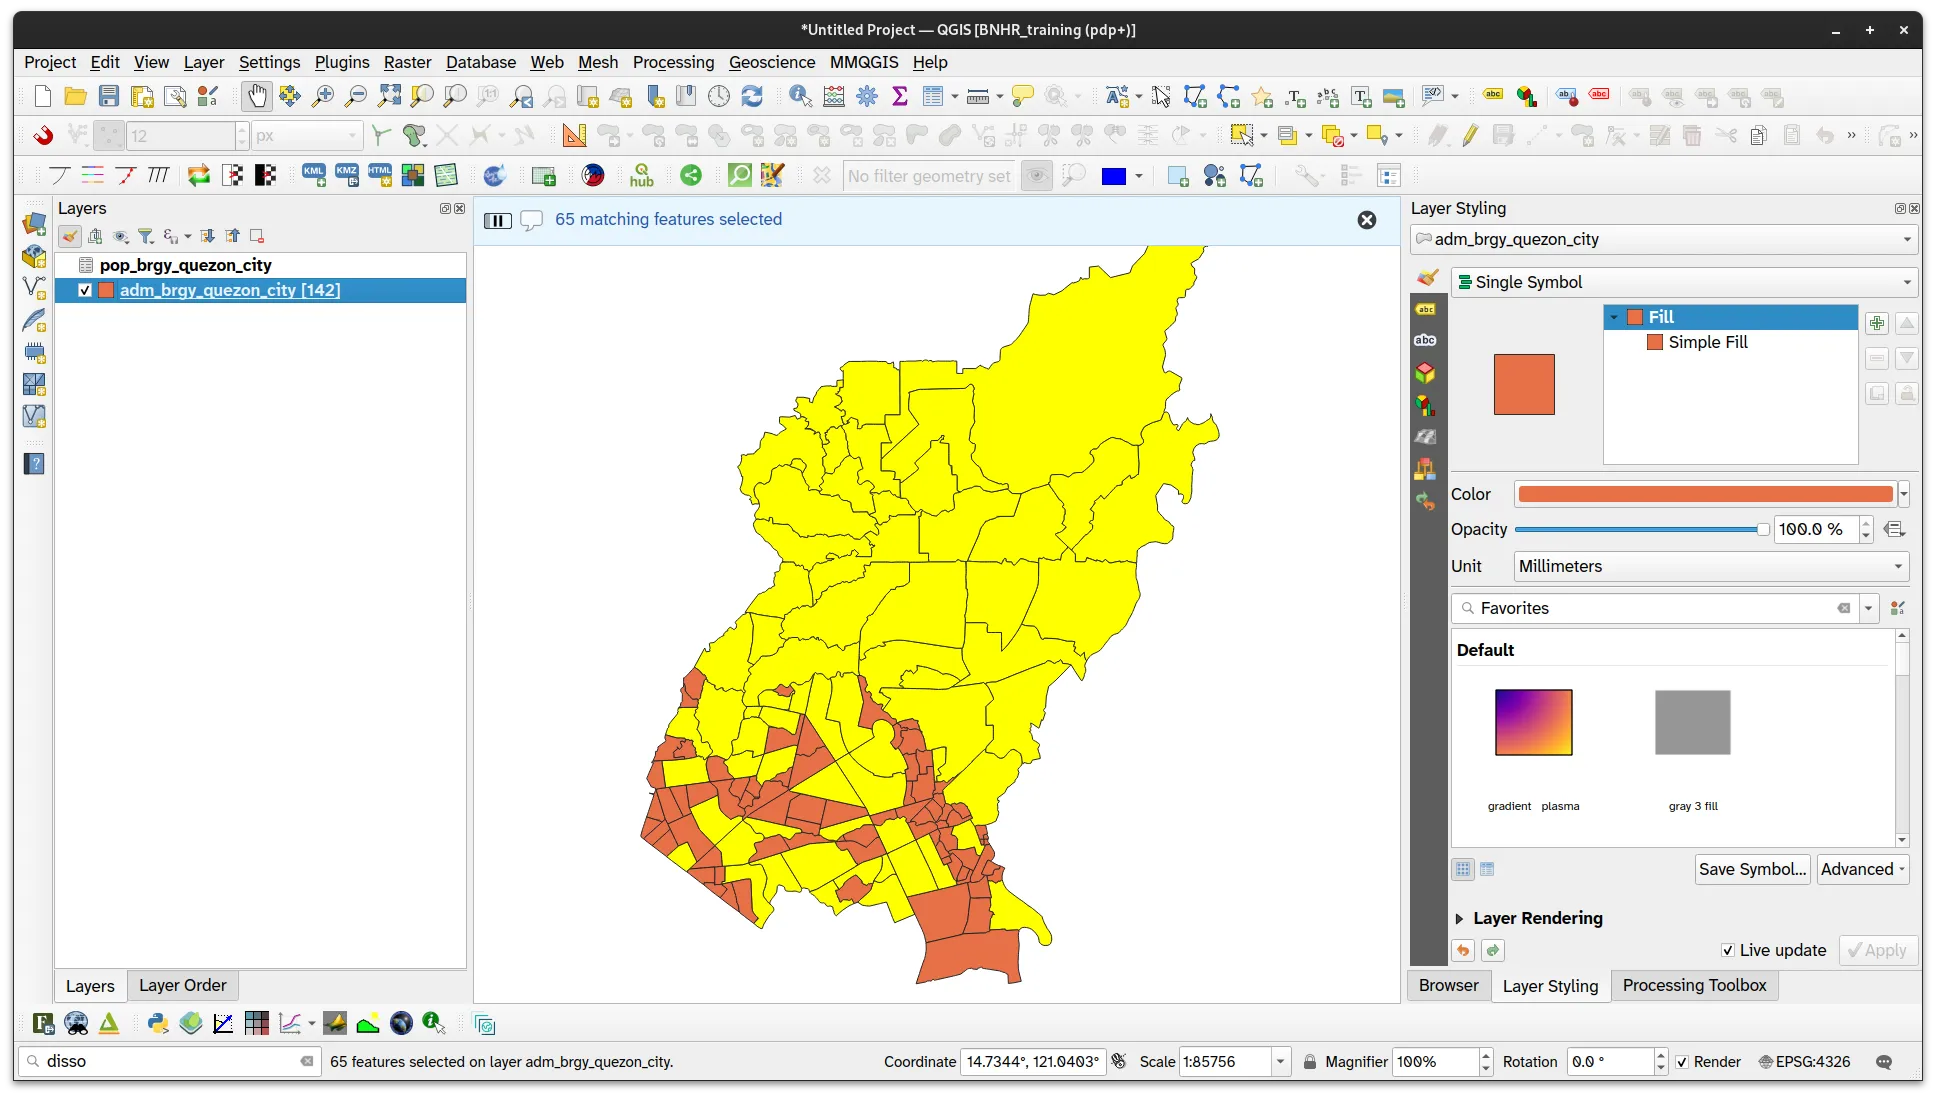
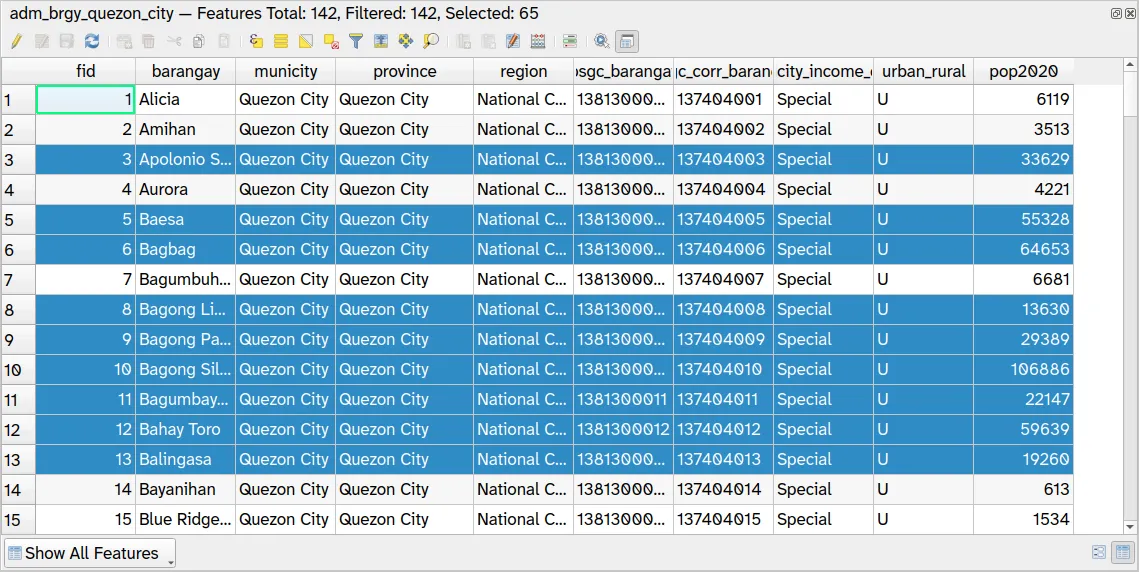
On the Select Features by Value dialog, put 10000 and Greater than (>) in the pop2020 row.
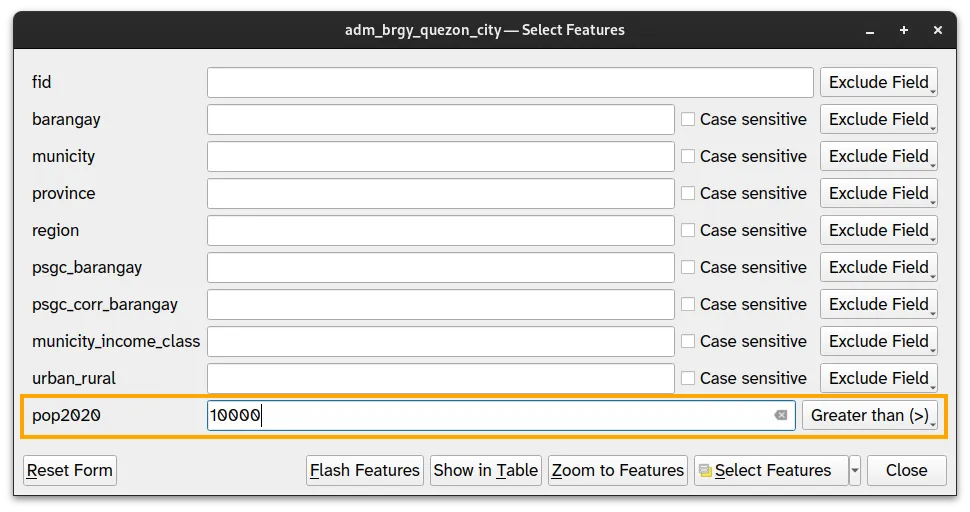
- Your selection (65 barangays) should reflect in both the attribute table and the map canvas (i.e. the rows in the attribute table and the features in the map canvas will both be highlighted).
-
Deselect the features by clicking the Deselect all (CTRL + SHIFT + A) button (
 ) in the attribute table or in the Selection Toolbar.
 -
Now try to use a Select Features by Expression to select the barangays with population in 2020 greater than 50,000. Open the Select Features by Expression dialog by clicking the appropriate button (
 ) on the attribute table of the layer. Alternatively, you can go to Select Features by Expression in the Selection Toolbar. A Query Builder dialog will appear. Input the expression below and click Select Features.
pop2020 > 50000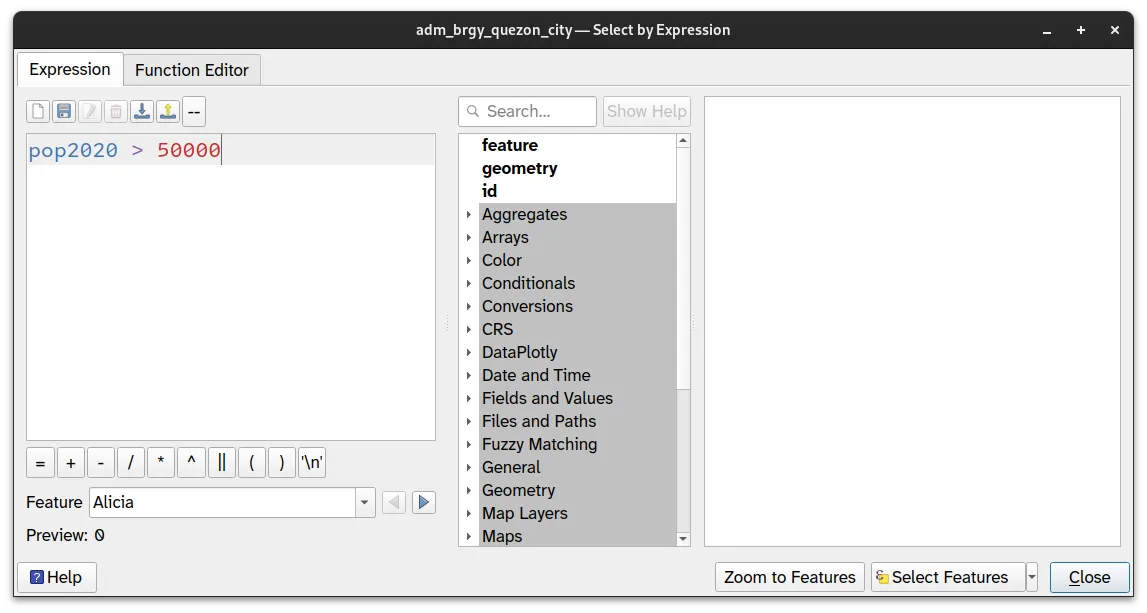
-
Your selection (20 barangays) should appear in the map canvas and attribute table.
-
Deselect the features.
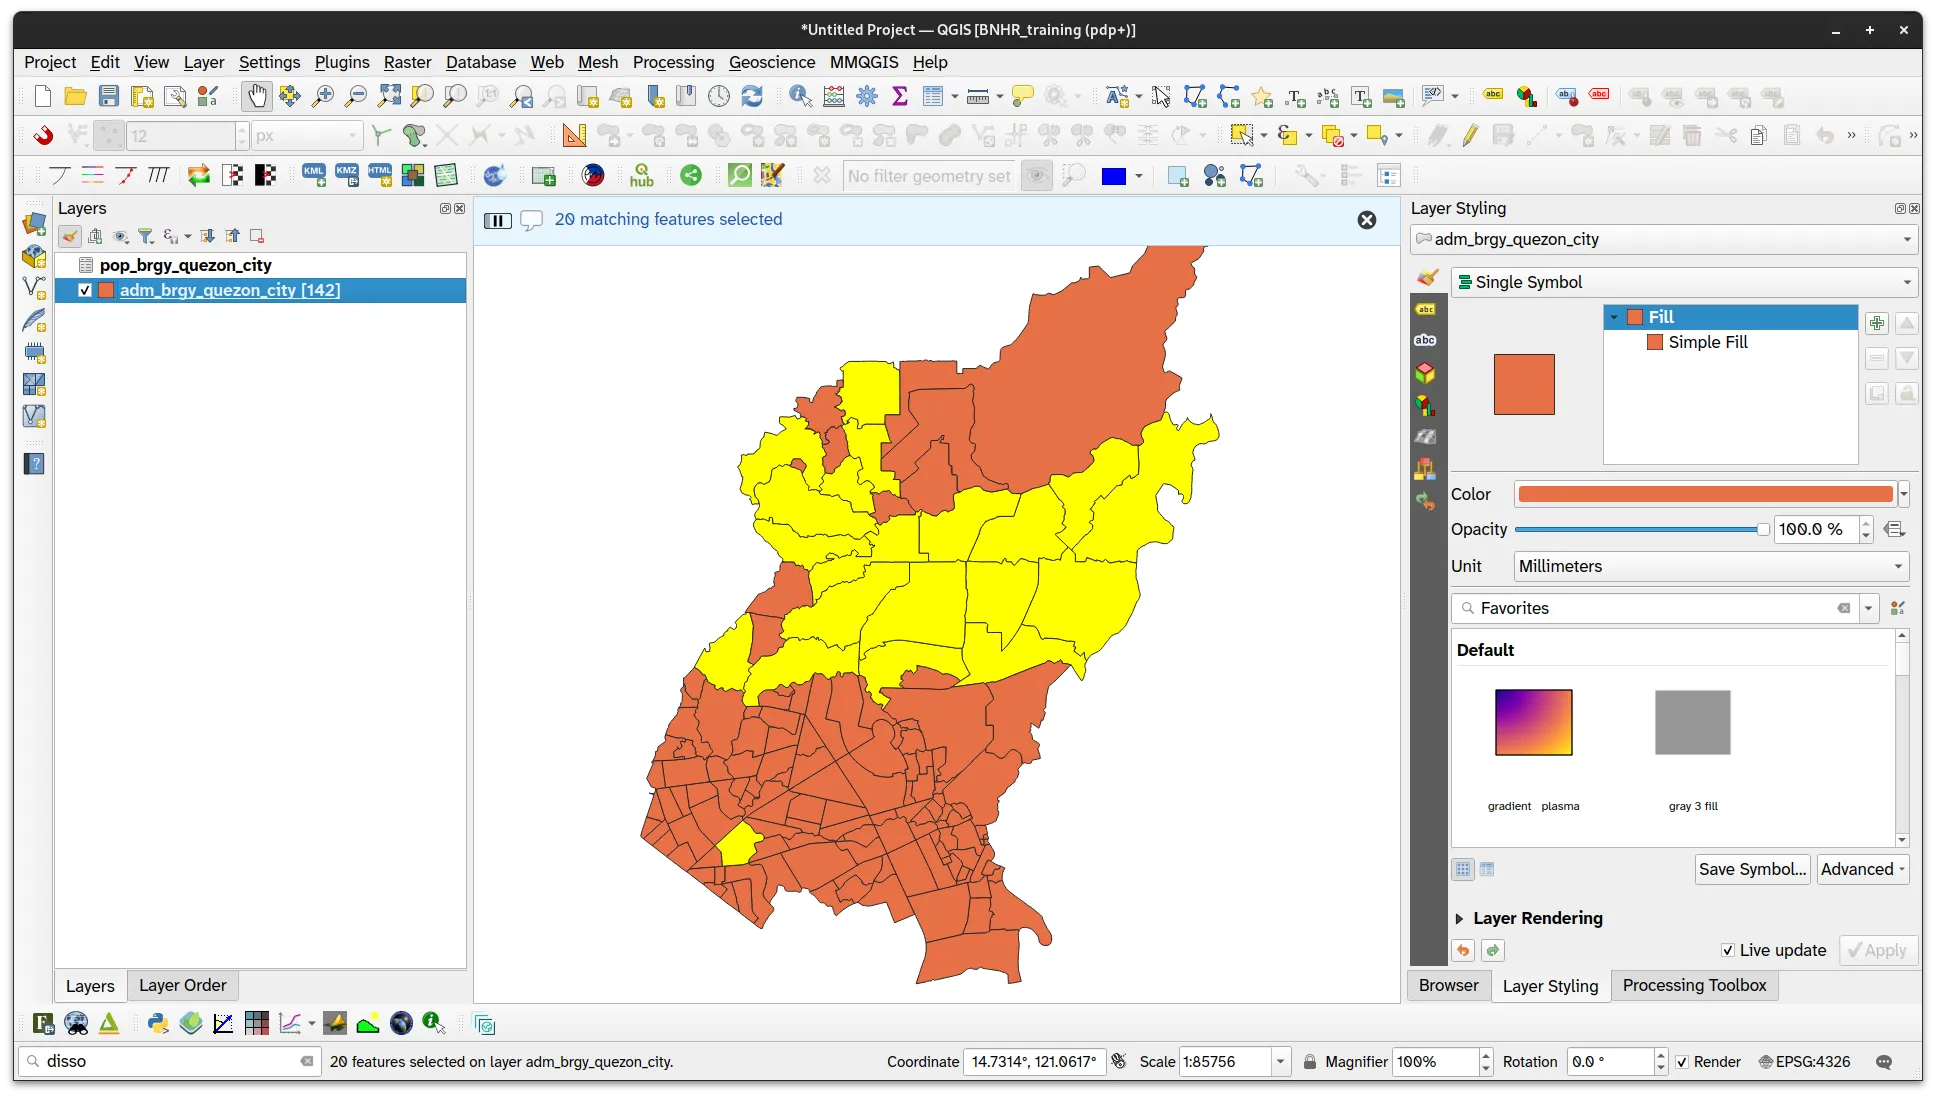
Now let’s try a filter to show only the barangays with population in 2020 > 100,000.
- Open the query builder by right clicking on the layer and clicking Filter. Apply the filter below then click OK. You can click Test to check if your filter before applying it to the layer.
pop2020 > 100000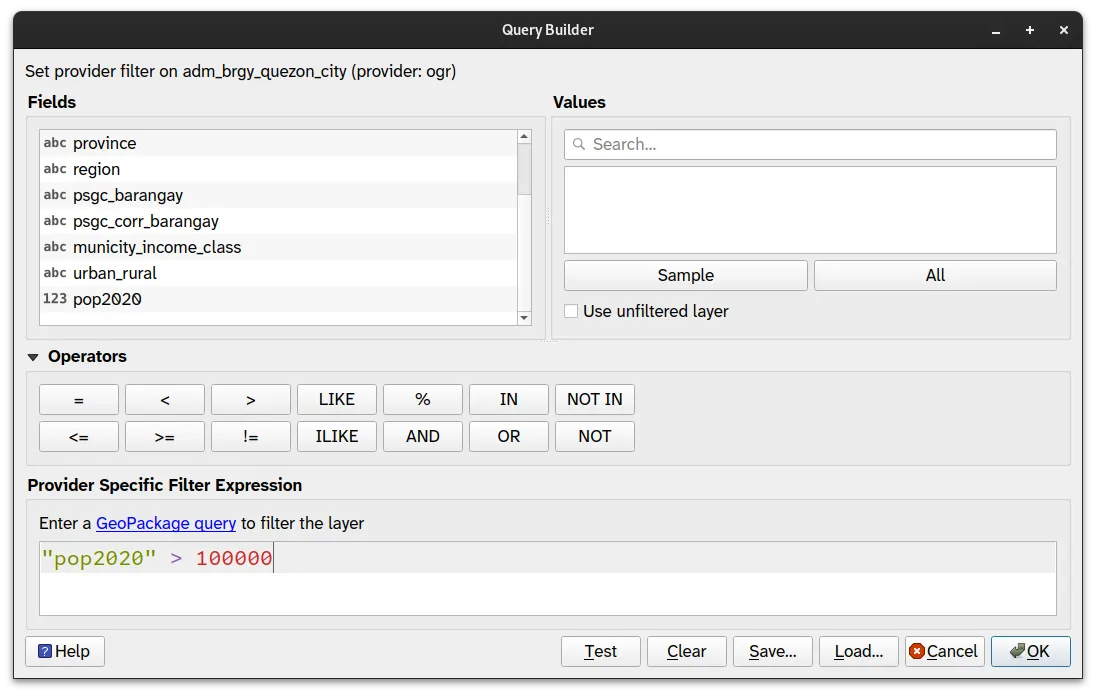
- You will notice that a layer has a filter applied because it will have a filter icon next to its name in the Layers Panel.
![]()
- Notice also that only the features that meet the specified criteria are visible in the map canvas and the attribute table of the layer.
- To undo a filter, remove the query or click Clear on the Query Builder then click OK.
Modifying the data
Section titled “Modifying the data”In the following exercises, we will modify our data in order to create a barangay-level layer with population data from 2000 to 2020, create a district-level layer with population data from 2000 to 2020, and style the barangay-level and district-level layers based on population density and annual rate of population growth from 2000 to 2020.
2.1. Adding population data from 2000 to 2015 using attribute joins
Section titled “2.1. Adding population data from 2000 to 2015 using attribute joins”First, let’s learn about attribute joins.
Attribute joins are used in QGIS to combine the attributes of two or more data sources based on a common field. This is useful when you have data that is related to each other but stored in separate files. It is also one of the most important functions of a GIS as it allows for non-spatial data to be made spatial.
In your case, you have a vector layer of barangay boundaries (adm_brgy_quezon_city) and a CSV file of population data (pop_brgy_quezon_city.csv) and you want to combine them to create a map of population density or population rate over time. You can do this by joining the attribute table of the CSV file with that of the vector layer.
There are two ways to perform attribute joins in QGIS. The first is via the Layer Properties ‣ Joins and the second is via the Join attributes by field value processing algorithm. The first one can be considered a soft join since it temporarily adds fields from the join table to the target table which can be removed/unjoined any time. The second option can be considered a hard join since it creates a new table from the joined attribute tables.
Now that we now about attribute joins, let’s apply it to our data.
- Load the adm_brgy_quezon_city vector layer and pop_brgy_quezon_city.csv in QGIS (if you haven’t yet).
- You can Right-click ‣ Properties ‣ Fields on a layer to double-check if its attributes/fields are of the correct type.
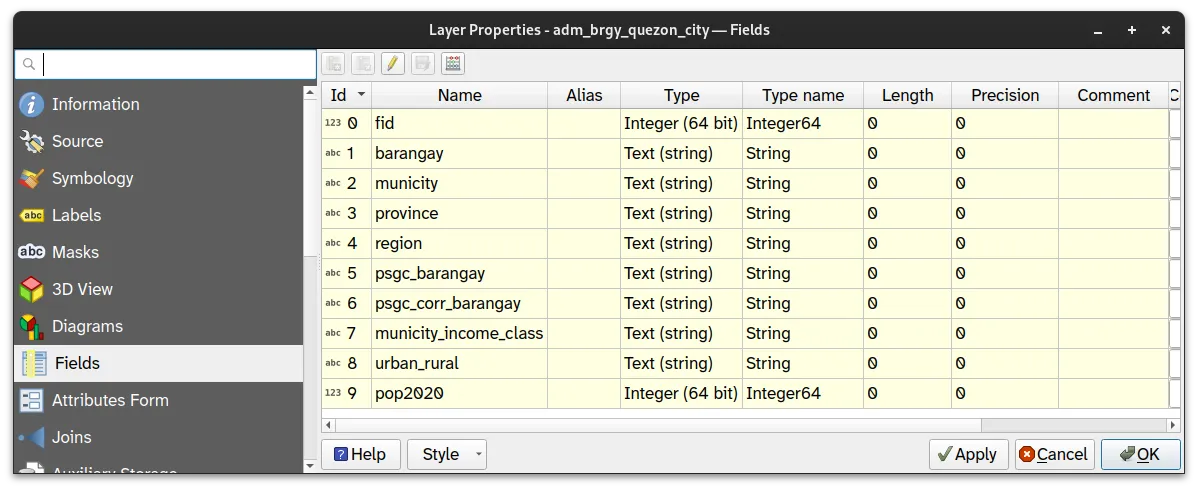
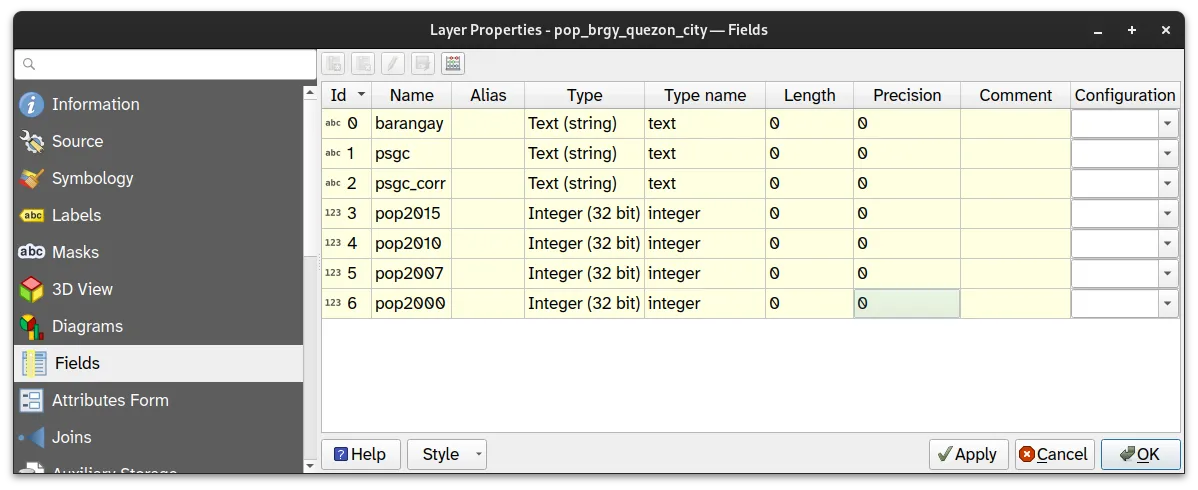
- Open the attribute table of the two layers again. What is/are common field/fields between the two? What can we use to join their attribute tables?
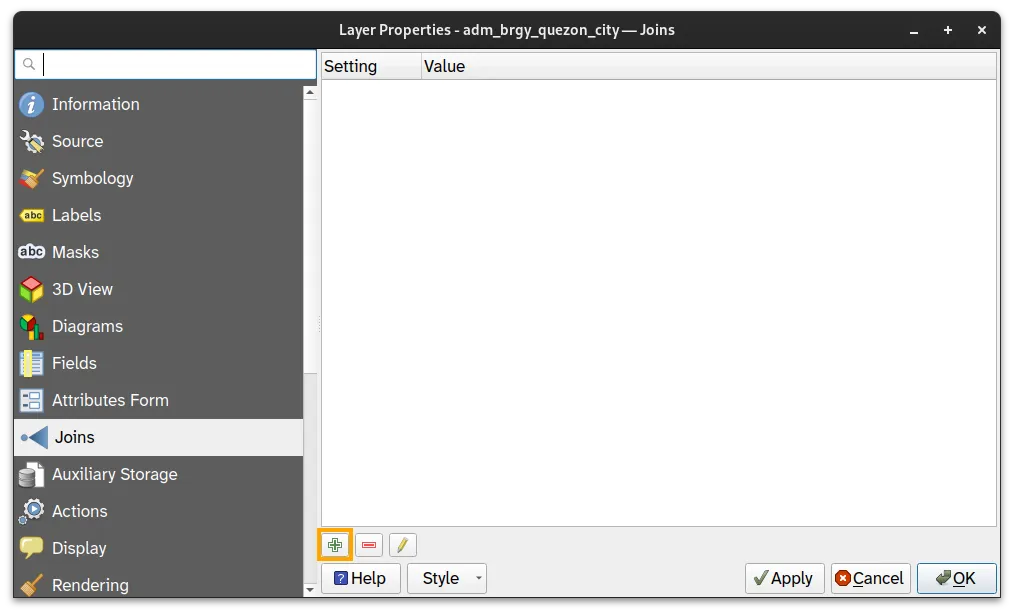
- Apply a soft join by going the the Layer Properties ‣ Joins tab of the pop_brgy_quezon_city layer. Click the green plus button (
 ) to add and join the pop_brgy_quezon_city layer.
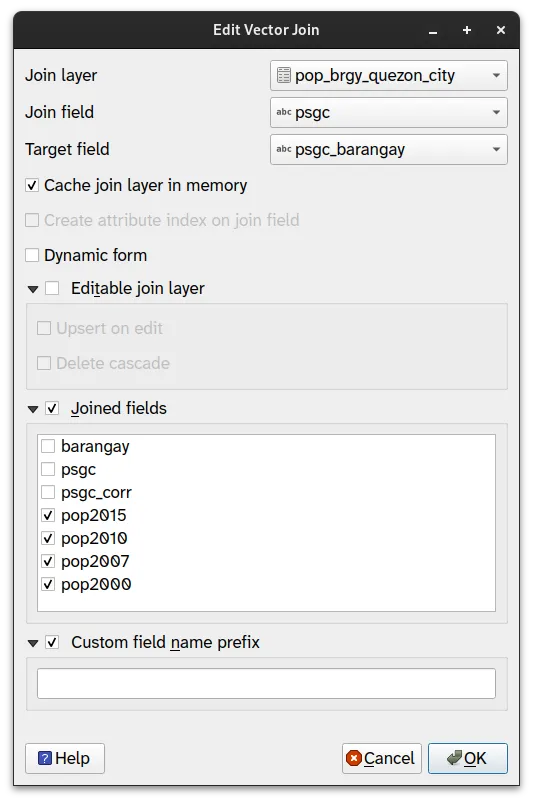
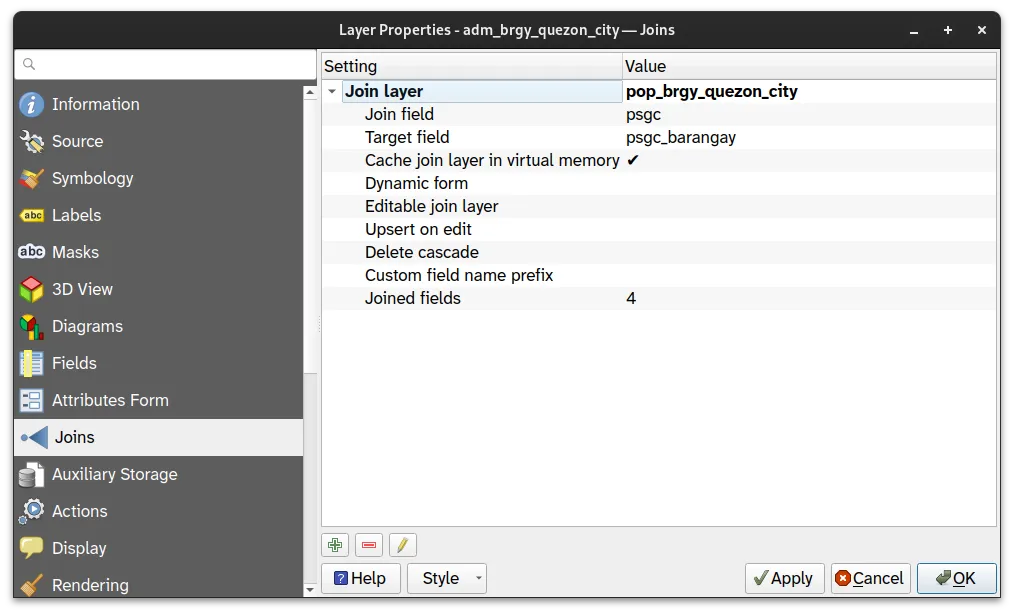
-
Click OK on the Add Vector Join dialog and OK again on the Joins tab.
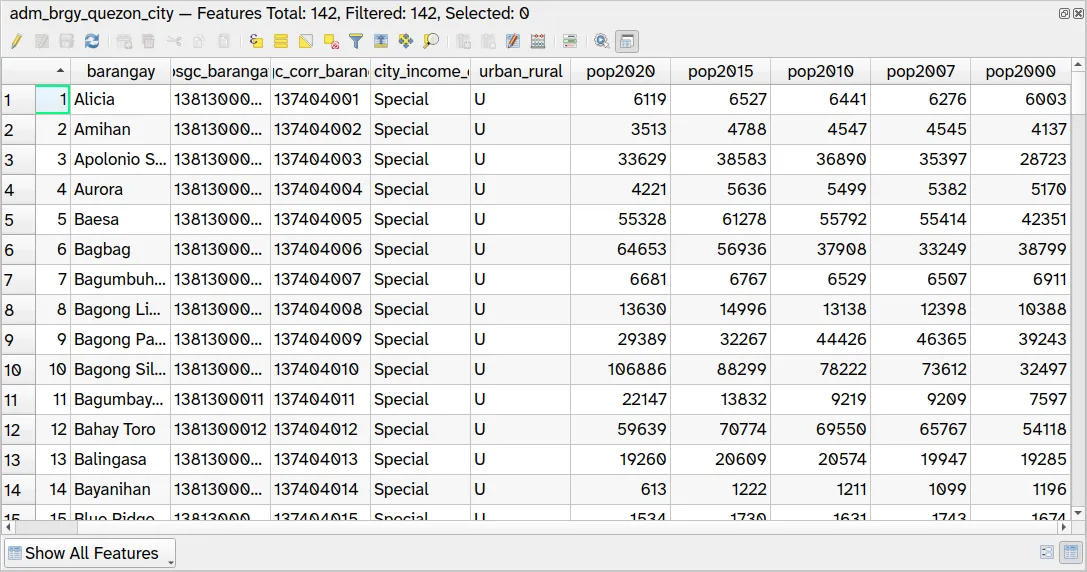
-
Open the attribute table of the adm_brgy_quezon_city layer.
- Perform a hard join by using the Join attributes by Field Value algorithm with the parameters below.
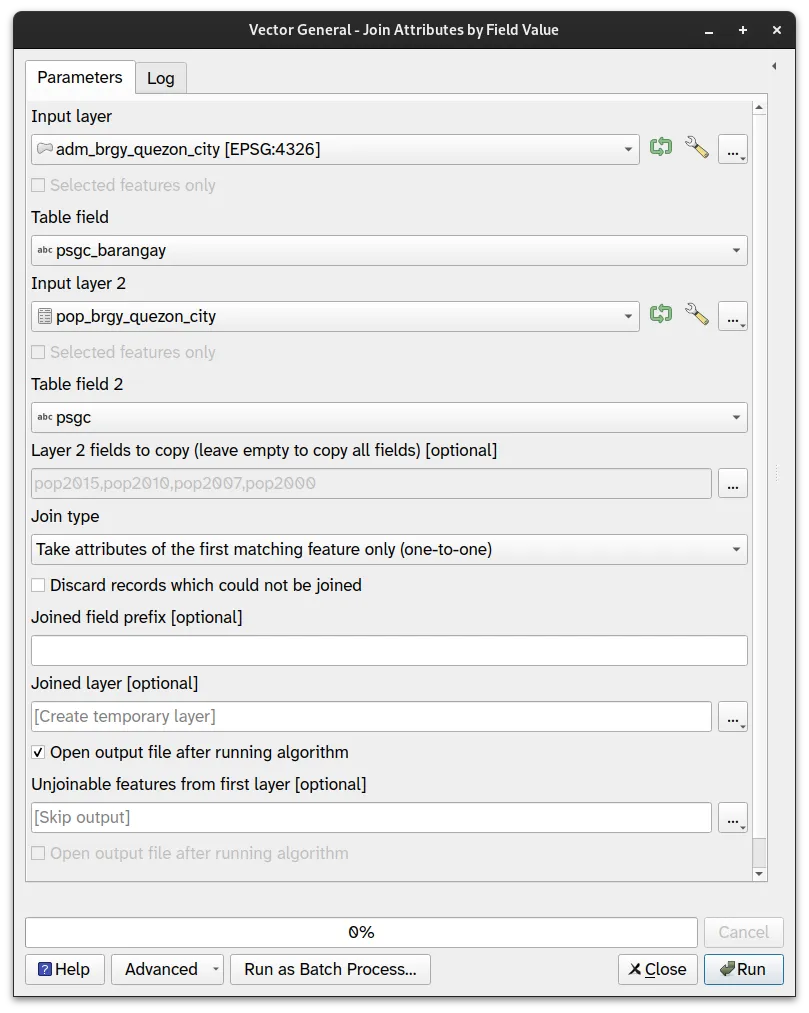
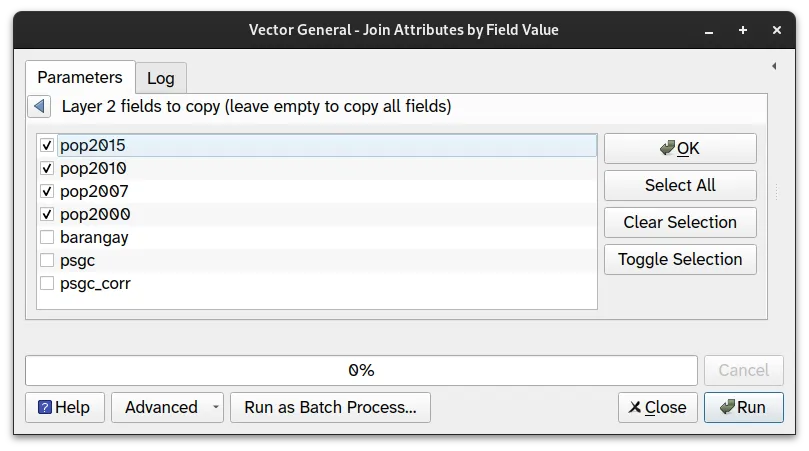
- The output (Joined layer) should be loaded in the Layers panel. Open its attribute table and check if the population fields are there.
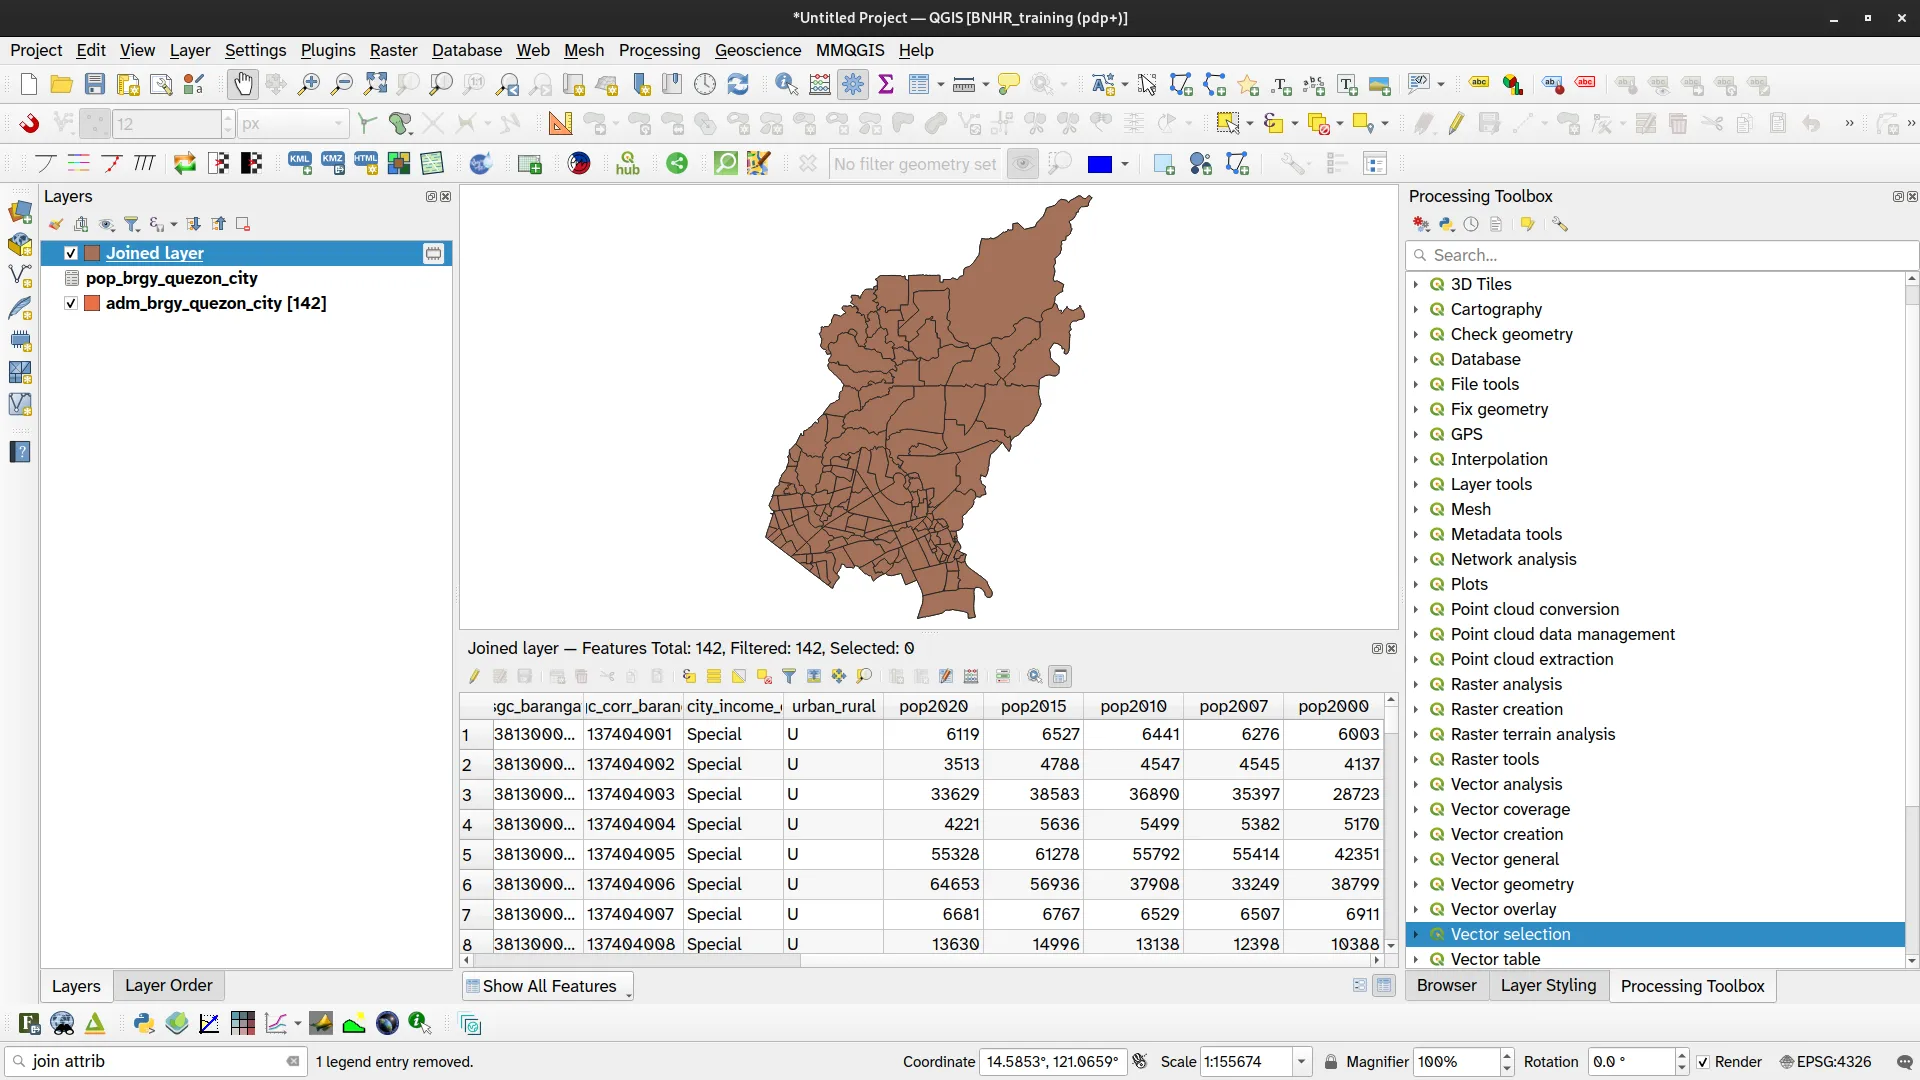
- Save the output (Joined layer) and name it something like adm_brgy_quezon_city_pop2000-2020.
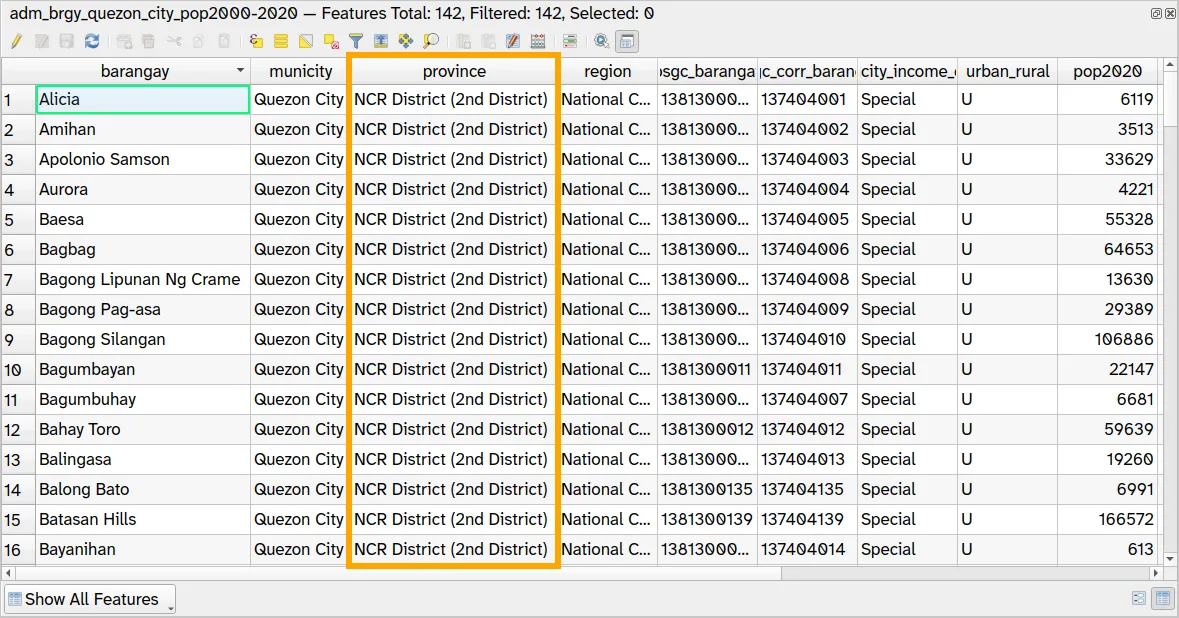
2.2. Fixing a mistake in the Attributes
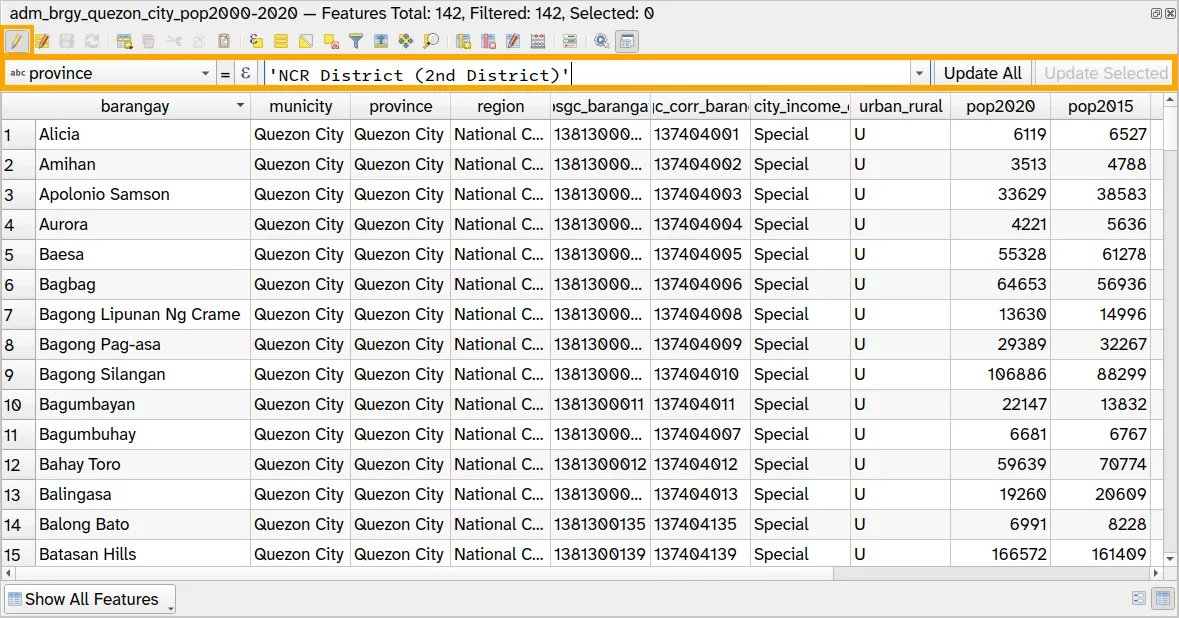
Section titled “2.2. Fixing a mistake in the Attributes”If you check the attribute table for adm_brgy_quezon_city_pop2000-2020, you will notice that there is a mistake in the values. In particular, the province field has Quezon City in it. In practice, while the National Capital Region has no provinces, we commonly use the NCR districts in place of a province. In this case, let’s replace the values in the province field with the correct value: 'NCR District (2nd District)'
-
Open the Attribute table to apply edits to the province field.
-
Using the Attribute table:
- Toggle Editing ON
- Select province
- In the Expression field:
'NCR District (2nd District)'- Click Update All or Update Selected
-
Don’t forget to save your edits!
-
Open the attribute table of adm_brgy_quezon_city_pop2000-2020 to see the results.
2.3. Adding a district field to the barangay boundary data
Section titled “2.3. Adding a district field to the barangay boundary data”Let’s learn more about the Field Calculator.
QGIS has a powerful Field Calculator that allows you to perform calculations on fields in a layer. You can use it to create new fields, update existing fields, or calculate values based on existing fields. The kinds of operations you can run in the field calculator range from basic mathematical operations such as as addition, subtraction, multiplication, and division; boolean and conditional operations such as ifs and comparisons; as well as more complex calculations using the built-in functions and operators of the QGIS expression engine.
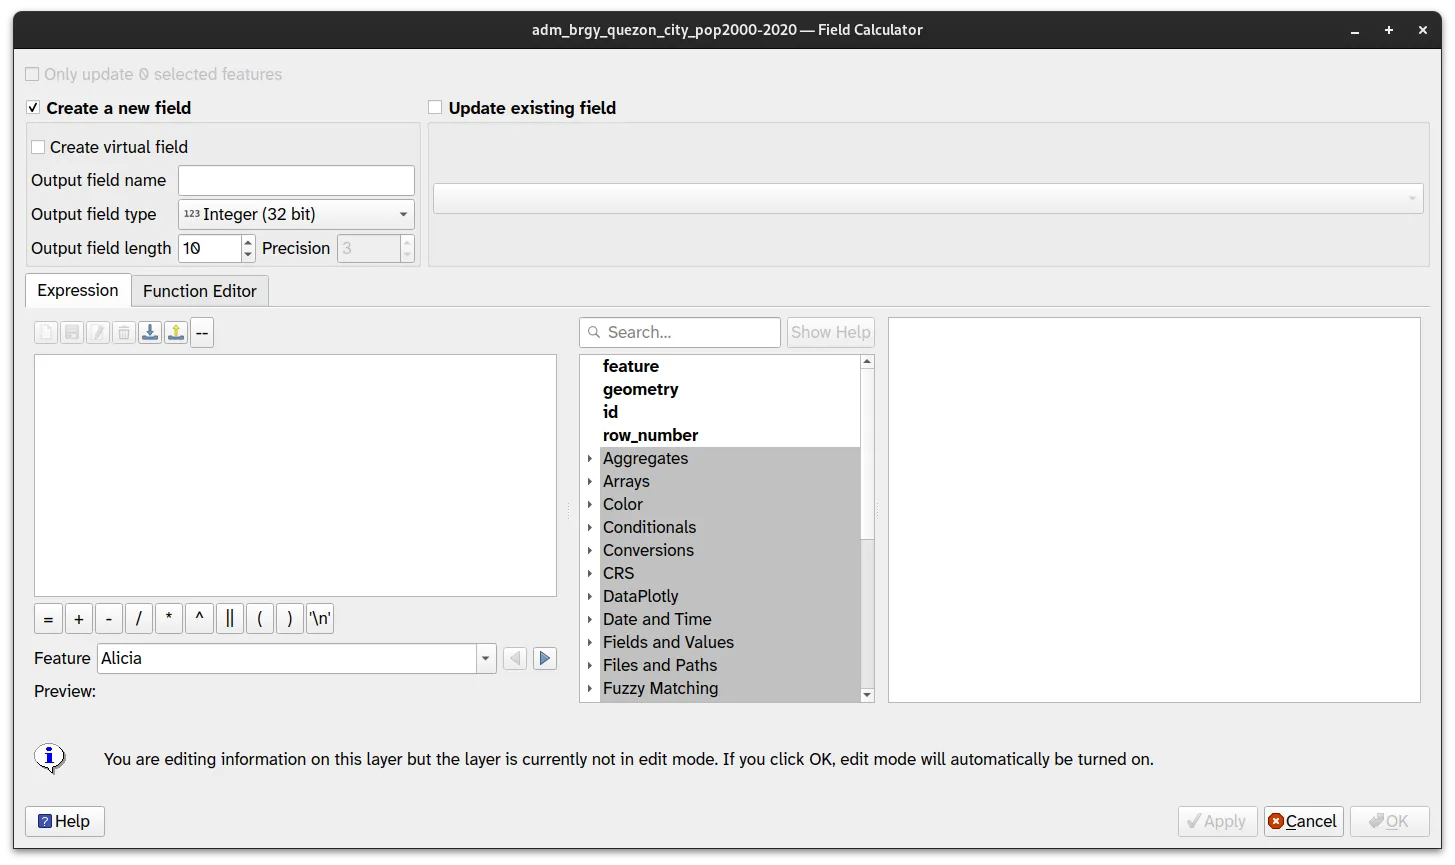
The Field calculator can be accessed by clicking the Open Field Calculator button (![]() ) in the Attributes Toolbar or in the attribute table itself. This will open the Field Calculator dialog where you can input the parameters of the field you want to calculate, the expression or formula you want to use, and even be able to preview the results. You also have the option to use the Field Calculator to update and existing field.
) in the Attributes Toolbar or in the attribute table itself. This will open the Field Calculator dialog where you can input the parameters of the field you want to calculate, the expression or formula you want to use, and even be able to preview the results. You also have the option to use the Field Calculator to update and existing field.
For this exercise, you want to add a district field on the adm_brgy_quezon_city_pop2000-2020 layer that pertains to the district that the barangay is part of.
The list of Quezon City barangays per district can be found in the table below or in the quezon-city-barangay-per-district.rtf file.
Quezon City Barangays by District
| District | Barangays |
|---|---|
| 1st District | Alicia, Bagong Pag-asa, Bahay Toro, Balingasa, Bungad, Damar, Damayan, Del Monte, Katipunan, Mariblo, Masambong, N.S. Amoranto, Nayong Kanluran, Paang Bundok, Pag-ibig Sa Nayon, Paltok, Paraiso, Phil-Am, Project 6, Ramon Magsaysay, Saint Peter, Salvacion, San Antonio, San Isidro Labrador, San Jose, Santa Cruz, Santa Teresita, Santo Cristo, Santo Domingo, Sienna, Talayan, Vasra, Veterans Village, West Triangle, Lourdes, Maharlika, Manresa |
| 2nd District | Bagong Silangan, Batasan Hills, Commonwealth, Holy Spirit, Payatas |
| 3rd District | Amihan, Bagumbuhay, Bagumbayan, Bayanihan, Blue Ridge A, Blue Ridge B, Camp Aguinaldo, Claro, Dioquino Zobel, Duyan-duyan, E. Rodriguez, East Kamias, Escopa I, Escopa II, Escopa III, Escopa IV, Libis, Loyola Heights, Mangga, Marilag, Masagana, Matandang Balara, Milagrosa, Pansol, Quirino 2-A, Quirino 2-B, Quirino 2-C, Quirino 3-A, Saint Ignatius, San Roque, Silangan, Socorro, Tagumpay, Ugong Norte, Villa Maria Clara, West Kamias, White Plains |
| 4th District | Bagong Lipunan Ng Crame, Botocan, Central, Kristong Hari, Damayang Lagi, Aurora, Doña Imelda, Doña Josefa, Don Manuel, East Triangle, Horseshoe, Immaculate Concepcion, Kalusugan, Kamuning, Kaunlaran, Krus Na Ligas, Laging Handa, Malaya, Mariana, Obrero, Old Capitol Site, Paligsahan, Pinyahan, Pinagkaisahan, QMC, Roxas, Sacred Heart, San Isidro, San Martin De Porres, San Vicente, Santo Niño, Santol, Sikatuna Village, South Triangle, Tatalon, Teachers Village East, Teachers Village West, U.P. Campus, U.P. Village, Valencia |
| 5th District | Bagbag, Capri, Fairview, Greater Lagro, Gulod, Kaligayahan, Nagkaisang Nayon, North Fairview, Novaliches Proper, Pasong Putik Proper, San Agustin, San Bartolome, Santa Lucia, Santa Monica |
| 6th District | Apolonio Samson, Baesa, Balong Bato, Culiat, New Era, Pasong Tamo, Sangandaan, Sauyo, Talipapa, Tandang Sora, Unang Sigaw |
-
Open the Field Calculator for the adm_brgy_quezon_city_pop2000-2020 layer that you created in the last exercise by clicking the Open field calculator (CTRL + I) button (
 ) .
) . -
You can also open its attribute table to access the Field Calculator and organize the columns to make it less cluttered.
-
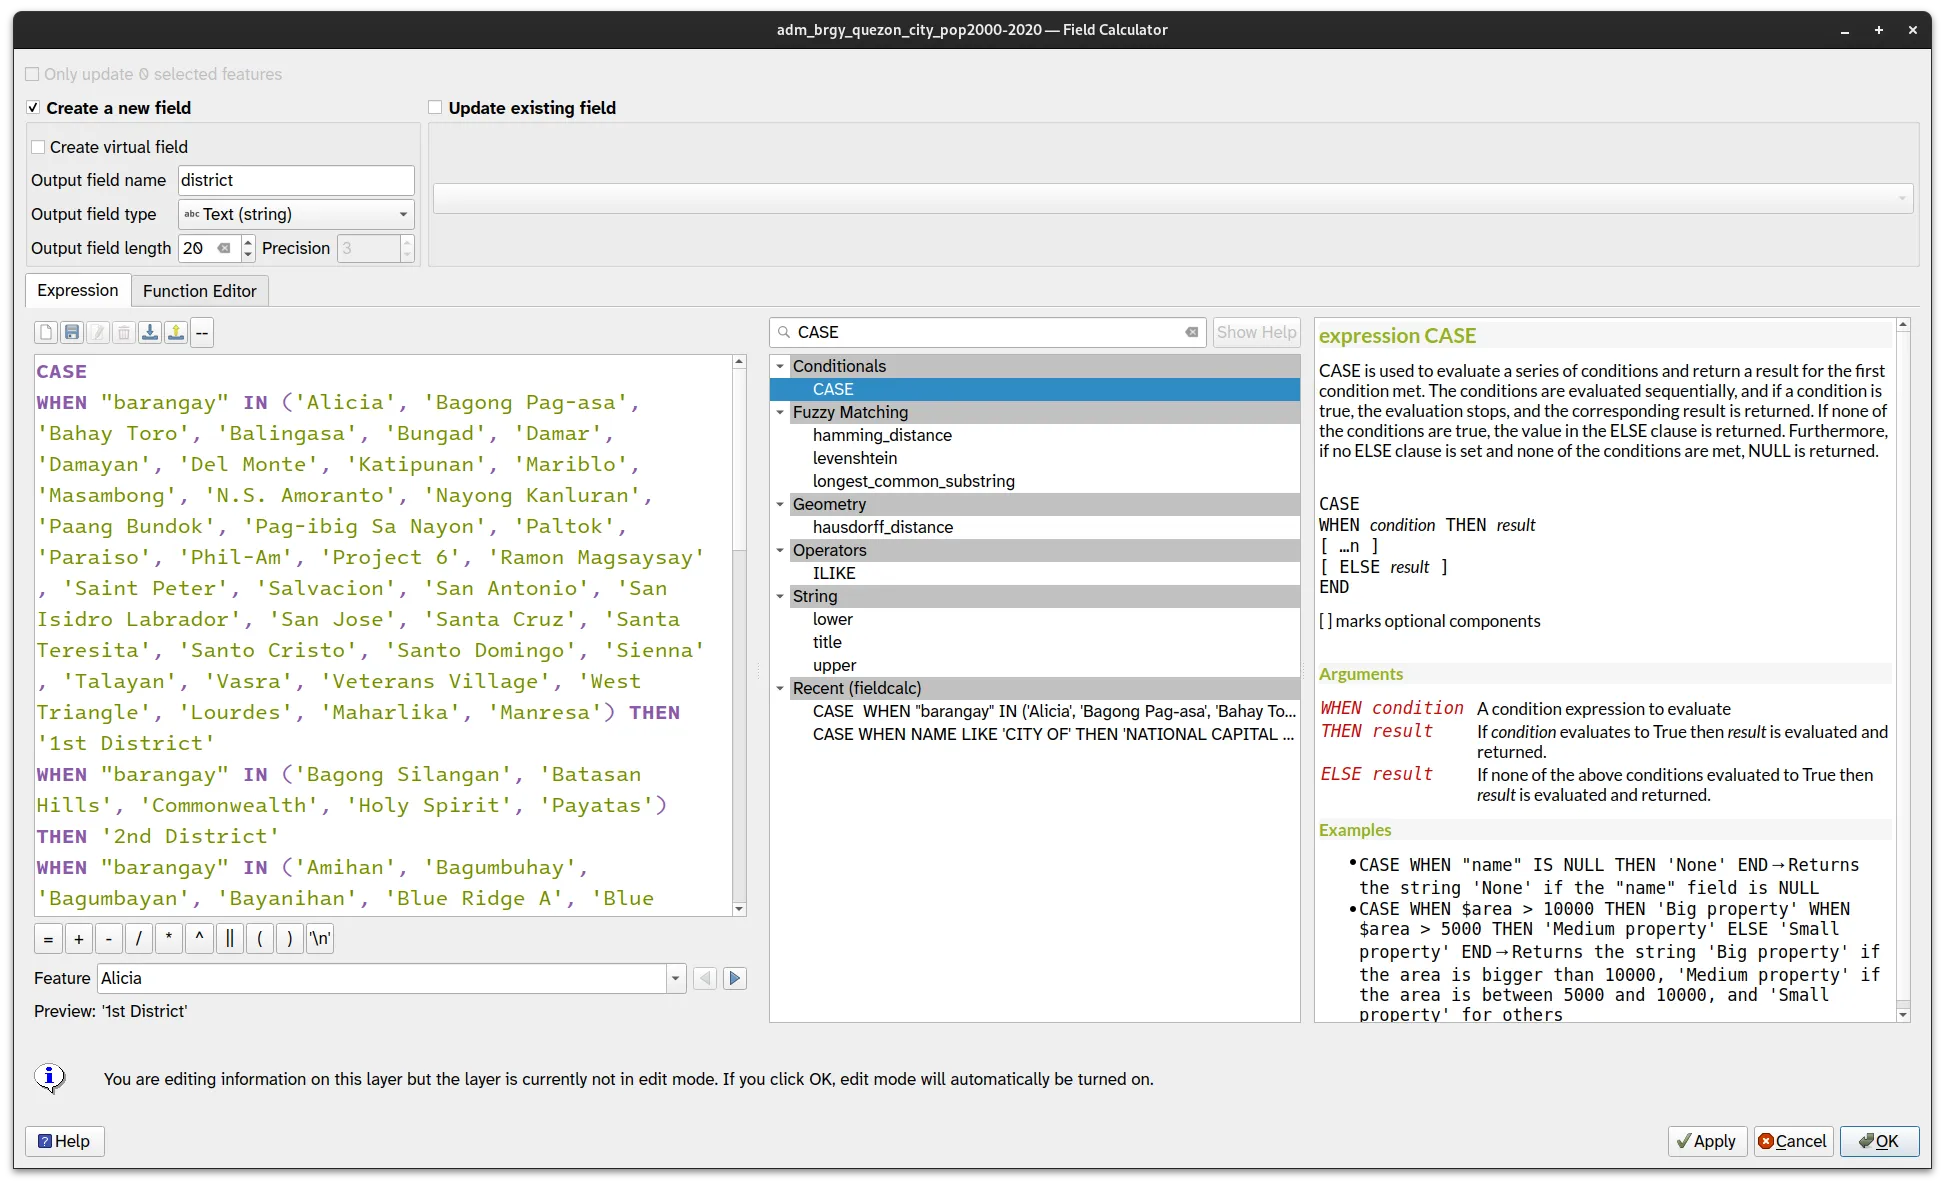
On the Field Calculator, add the following parameters:
- Check Create new field
- Output field name:
district - Output field type: Text (string)
- Output field length: 20
- On the Expression tab:
CASEWHEN "barangay" IN ('Alicia', 'Bagong Pag-asa', 'Bahay Toro', 'Balingasa', 'Bungad', 'Damar', 'Damayan', 'Del Monte', 'Katipunan', 'Mariblo', 'Masambong', 'N.S. Amoranto', 'Nayong Kanluran', 'Paang Bundok', 'Pag-ibig Sa Nayon', 'Paltok', 'Paraiso', 'Phil-Am', 'Project 6', 'Ramon Magsaysay', 'Saint Peter', 'Salvacion', 'San Antonio', 'San Isidro Labrador', 'San Jose', 'Santa Cruz', 'Santa Teresita', 'Santo Cristo', 'Santo Domingo', 'Sienna', 'Talayan', 'Vasra', 'Veterans Village', 'West Triangle', 'Lourdes', 'Maharlika', 'Manresa') THEN '1st District'WHEN "barangay" IN ('Bagong Silangan', 'Batasan Hills', 'Commonwealth', 'Holy Spirit', 'Payatas') THEN '2nd District'WHEN "barangay" IN ('Amihan', 'Bagumbuhay', 'Bagumbayan', 'Bayanihan', 'Blue Ridge A', 'Blue Ridge B', 'Camp Aguinaldo', 'Claro', 'Dioquino Zobel', 'Duyan-duyan', 'E. Rodriguez', 'East Kamias', 'Escopa I', 'Escopa II', 'Escopa III', 'Escopa IV', 'Libis', 'Loyola Heights', 'Mangga', 'Marilag', 'Masagana', 'Matandang Balara', 'Milagrosa', 'Pansol', 'Quirino 2-A', 'Quirino 2-B', 'Quirino 2-C', 'Quirino 3-A', 'Saint Ignatius', 'San Roque', 'Silangan', 'Socorro', 'Tagumpay', 'Ugong Norte', 'Villa Maria Clara', 'West Kamias', 'White Plains') THEN '3rd District'WHEN "barangay" IN ('Bagong Lipunan Ng Crame', 'Botocan', 'Central', 'Kristong Hari', 'Damayang Lagi', 'Aurora', 'Doña Imelda', 'Doña Josefa', 'Don Manuel', 'East Triangle', 'Horseshoe', 'Immaculate Concepcion', 'Kalusugan', 'Kamuning', 'Kaunlaran', 'Krus Na Ligas', 'Laging Handa', 'Malaya', 'Mariana', 'Obrero', 'Old Capitol Site', 'Paligsahan', 'Pinyahan', 'Pinagkaisahan', 'QMC', 'Roxas', 'Sacred Heart', 'San Isidro', 'San Martin De Porres', 'San Vicente', 'Santo Niño', 'Santol', 'Sikatuna Village', 'South Triangle', 'Tatalon', 'Teachers Village East', 'Teachers Village West', 'U.P. Campus', 'U.P. Village', 'Valencia') THEN '4th District'WHEN "barangay" IN ('Bagbag', 'Capri', 'Fairview', 'Greater Lagro', 'Gulod', 'Kaligayahan', 'Nagkaisang Nayon', 'North Fairview', 'Novaliches Proper', 'Pasong Putik Proper', 'San Agustin', 'San Bartolome', 'Santa Lucia', 'Santa Monica') THEN '5th District'WHEN "barangay" IN ('Apolonio Samson', 'Baesa', 'Balong Bato', 'Culiat', 'New Era', 'Pasong Tamo', 'Sangandaan', 'Sauyo', 'Talipapa', 'Tandang Sora', 'Unang Sigaw') THEN '6th District'END
-
Click OK.
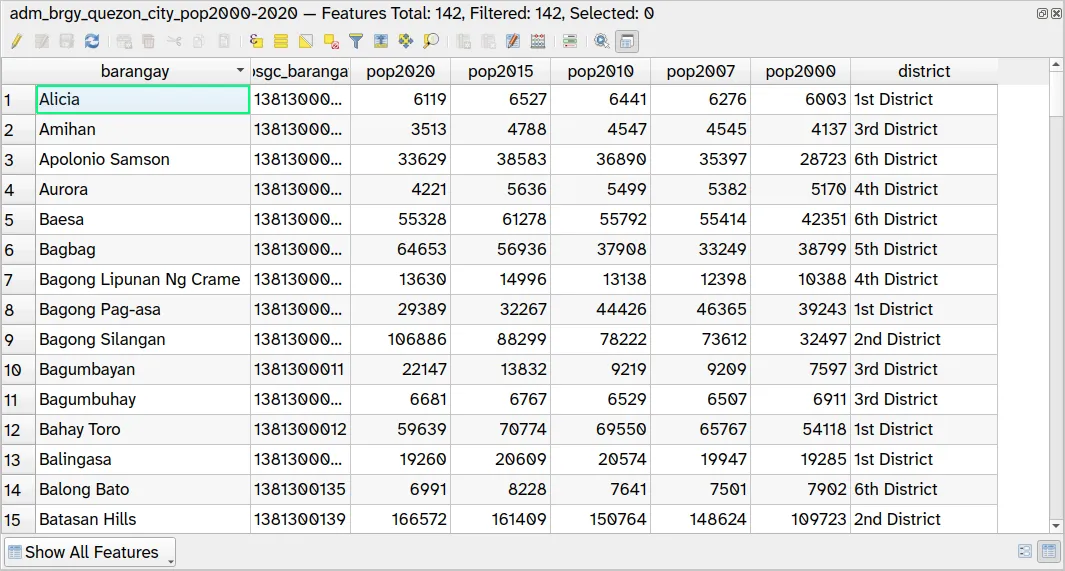
-
Open the attribute table of the adm_brgy_quezon_city_pop2000-2020 and check if a new district field is added.
2.4. Creating a district-level admin boundary data with correct population values
Section titled “2.4. Creating a district-level admin boundary data with correct population values”First, let’s learn about the Aggregate algorithm.
The Aggregate algorithm can be used to dissolve boundaries, remove overlaps, and merge adjacent polygons while aggregating the attributes associated with each feature. It is commonly used in data preprocessing for spatial analysis as well as for general data management tasks. With the Aggregate algorithm, you can easily summarize data for different levels of analysis such as administrative boundaries or land use types. Additionally, the algorithm can be used in combination with other processing tools, plugins, and scripts to create more advanced data workflows.
In your case, you can use the Aggregate algorithm to create a district-level administrative boundary layer while also calculating their total population by taking the sum of the population of each barangay within a district.
- Open the Aggregate algorithm from the Locator Bar or via Processing Toolbox.
- Remove other unnecessary fields by selecting them and clicking the
 symbol.

- Apply the following parameters.
- Group by expression: district
- district, province, region: first_value
- pop2020, pop2015, pop2010, pop2007, pop2000: sum
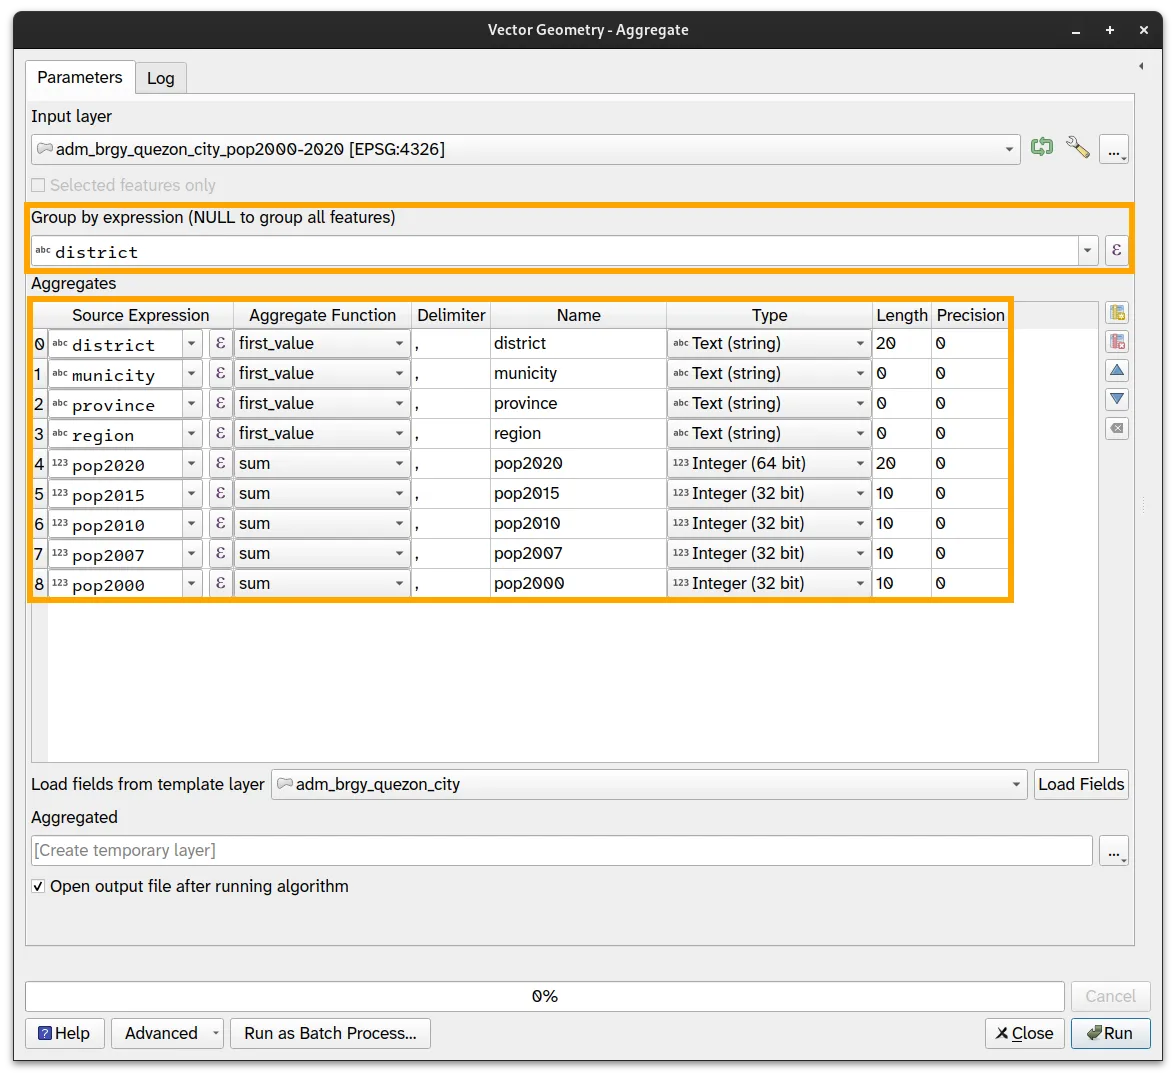
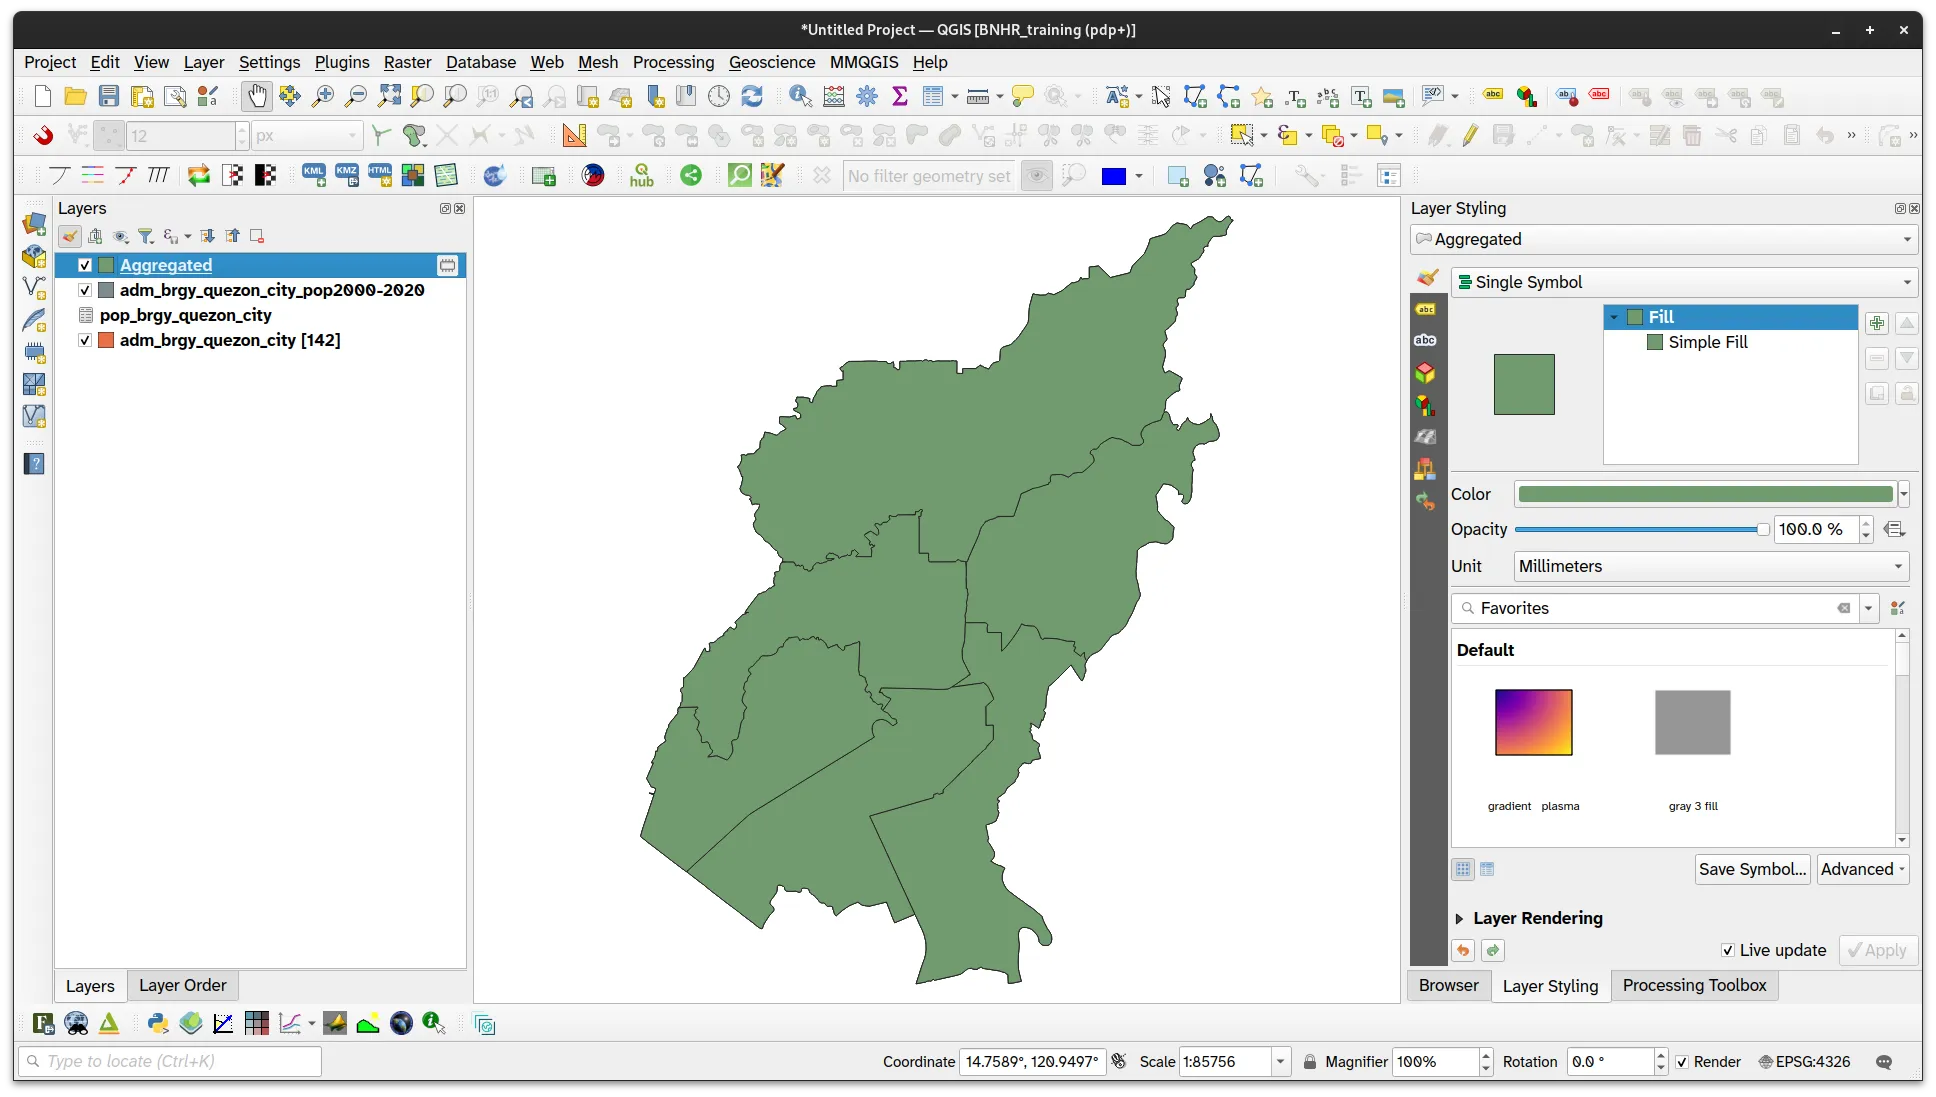
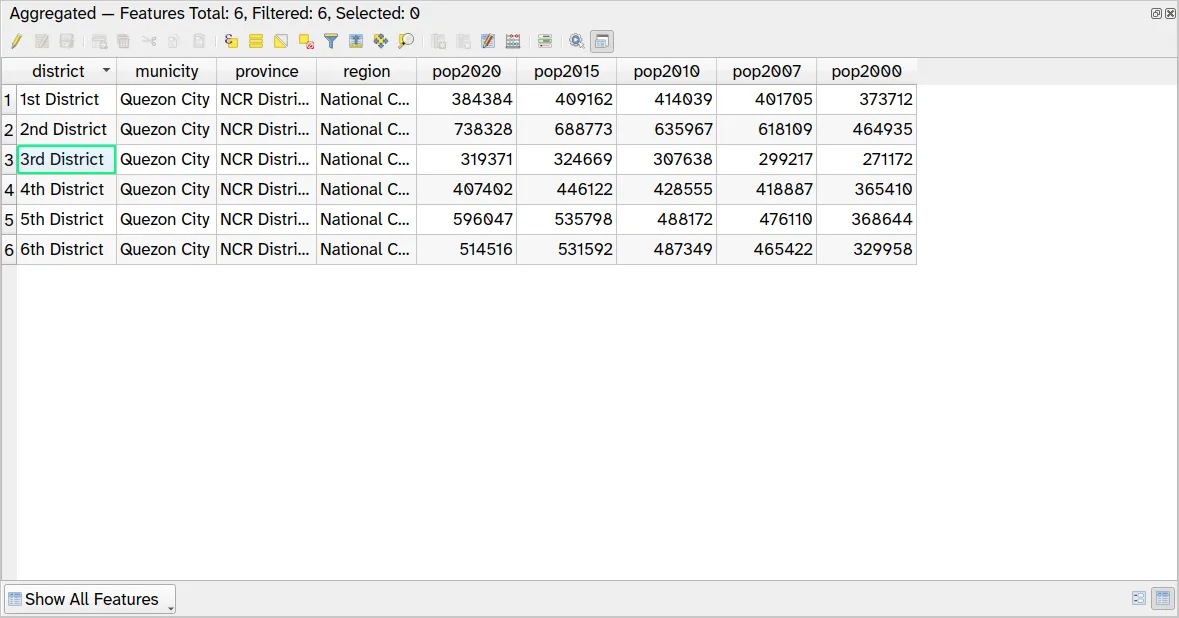
- Click Run.
- You should see a layer named Aggregated added to the Layer panel. You can rename or save this layer to adm_dist_quezon_city_pop2000-2020.
Certification and support
Section titled “Certification and support”Contact us or sign-up to our courses if you are interested in having this as an instructor-led or self-paced course.