
Spatial relationships and queries
Introduction
Section titled “Introduction”This module covers the topic of spatial relationships and queries in QGIS aimed at giving you the theoretical and practical foundation for understanding how and when to use different spatial predicates.
You will learn how to apply spatial predicates and relationships to select features based on their spatial location and to join attribute data from different layers based on spatial criteria.
At the end of this module, you should be able to select features based on spatial relationships, join attributes by location to enrich your data, and perform summary operations using a spatial criteria.
What you should already know
Section titled “What you should already know”Since this is a beginner module, no previous knowledge of GIS or QGIS is required. However, familiarity with the QGIS interface as discussed in QGIS: Essentials - Introduction to QGIS, how to load different kinds of layers as discussed in QGIS: Essentials - Introduction to layers in QGIS, and how to run processing algorithms as discussed in QGIS: Essentials - Basic geospatial processing techniques are preferred.
Spatial relationships and predicates
Section titled “Spatial relationships and predicates”Spatial relationships and predicates are fundamental concepts in GIS. They describe the relationships between geometries in space, such as whether one geometry contains, intersects, or touches another geometry.
These spatial relationships or spatial predicates are based on Dimensionally Extended Nine-Intersection Model (DE-9IM) which is a standard used to describe the spatial relations of two regions or geometries. It is a topological model that describes the spatial relationships between geometries using a matrix of nine values. The matrix describes the intersection of the interior, boundary, and exterior of two geometries in terms of their dimensionality.
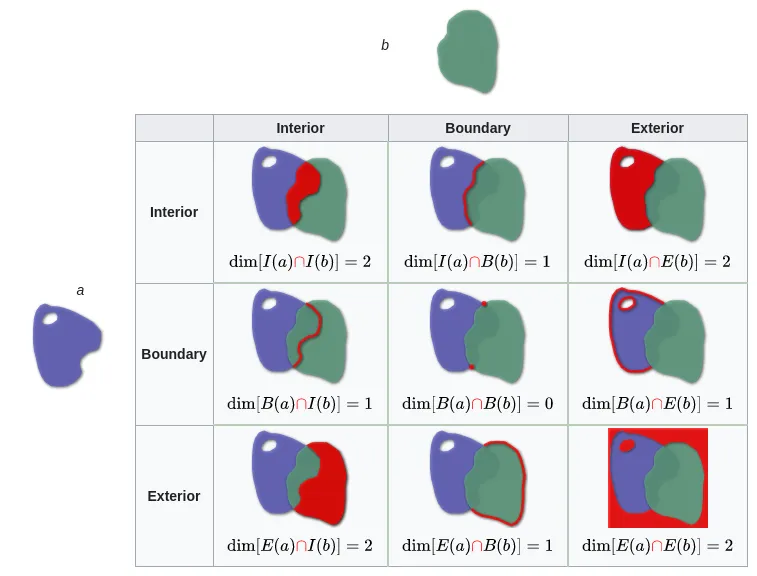
In words:
- Two geometries are topologically EQUAL if their boundaries intersect and no part of the interior or boundary of one geometry intersects the exterior of the other.
- They are DISJOINT if they have no point in common.
- They TOUCH if they have at least one point in common, but their interiors do not intersect.
- A CONTAINS B if no points of B lie in the exterior of A, and at least one point of the interior of B lies in the interior of A.
- They INTERSECT if they have at least one point in common.
Spatial predicates
Section titled “Spatial predicates”Spatial predicates that you will encounter in most QGIS processing algorithms are:
- Disjoint
- Intersects
- Equals
- Touches
- Crosses
- Overlaps
- Contains
- Within
You can find these as options in processing algorithms such as Select by location, Join attributes by location, and Join attributes by location (summary).
You can better understand what these spatial predicates mean by imagining two geometries (one G in green and another B in blue) and seeing their interaction with one another.
Disjoint
Section titled “Disjoint”
- The Boundaries and Interiors do not intersect
- Applicable to all geometry combinations
- G is disjoint from B and vice versa
Intersects
Section titled “Intersects”- Not DISJOINT
- Applicable to all geometry combinations
Equals
Section titled “Equals”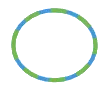
- Both geometries have the same boundary and the same interior
- Applicable only to combinations of the same kind of geometry (e.g. Point/Point, Line/Line, Polygon/Polygon)
- G = B and vice versa
Touches
Section titled “Touches”
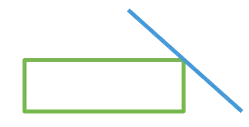
- Boundaries may intersect or one boundary may intersect the other interior.
- The interiors do not touch.
- G touches B and vice versa
- Point/Point – undefined
Crosses
Section titled “Crosses”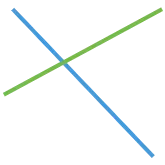
- Interiors intersect and the base’s interior intersects the candidate’s exterior.
- Line/Line - the intersection of the interiors forms a point.
- G crosses B and vice versa
- Point/Point, Area/Area – undefined
Overlaps
Section titled “Overlaps”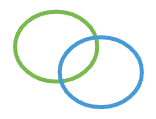
- Interiors intersect but neither feature is contained by the other nor are the features equal.
- G overlaps B and vice versa
- Point/Line, Point/Area, Line/Area - undefined
Contains
Section titled “Contains”
- Interiors intersect and no part of the candidate’s interior or boundary intersects the base’s exterior.
- Possible for the boundaries to intersect.
- G contains B
- Inverse of WITHIN.
Within
Section titled “Within”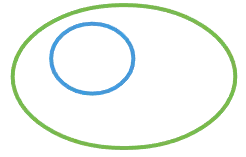
- Interiors intersect and no part of the base’s interior or boundary intersects the candidate’s exterior.
- Possible for the boundaries to intersect.
- B is with G
- Inverse of CONTAINS.
Memory boosters and review
Section titled “Memory boosters and review”What is the Dimensionally Extended nine-Intersection Model (DE-9IM)?
Section titled “What is the Dimensionally Extended nine-Intersection Model (DE-9IM)?”It is a topological model and standard used to describe the spatial relations of two regions or geometries.
What does the DE-9IM matrix describe?
Section titled “What does the DE-9IM matrix describe?”The intersection of the interior, boundary, and exterior of two geometries in terms of their dimensionality.
What are some types of spatial relationships and predicates in QGIS?
Section titled “What are some types of spatial relationships and predicates in QGIS?”Intersects, Contains, Touches, Within.
What’s the difference between “equals” and “overlaps” spatial predicates in QGIS?
Section titled “What’s the difference between “equals” and “overlaps” spatial predicates in QGIS?”“Equals” spatial predicate matches geometries that are identical, while “overlaps” spatial predicate matches geometries that share at least some common area, but are not necessarily identical.
What spatial predicate is best to use to select all buildings that are completely contained within a flood zone?
Section titled “What spatial predicate is best to use to select all buildings that are completely contained within a flood zone?”“Contains” if you use Flood zone contains Building OR “Within” if you use Building is within Flood zone.
Spatial queries
Section titled “Spatial queries”Knowing about spatial predicates, we can create queries based on the relationship between different layers in QGIS. There are several processing algorithms such as Select by location and Join attributes by location that take advantage of spatial predicates. These algorithms are used to select or join data based on its spatial location relative to another layer.
Select by location
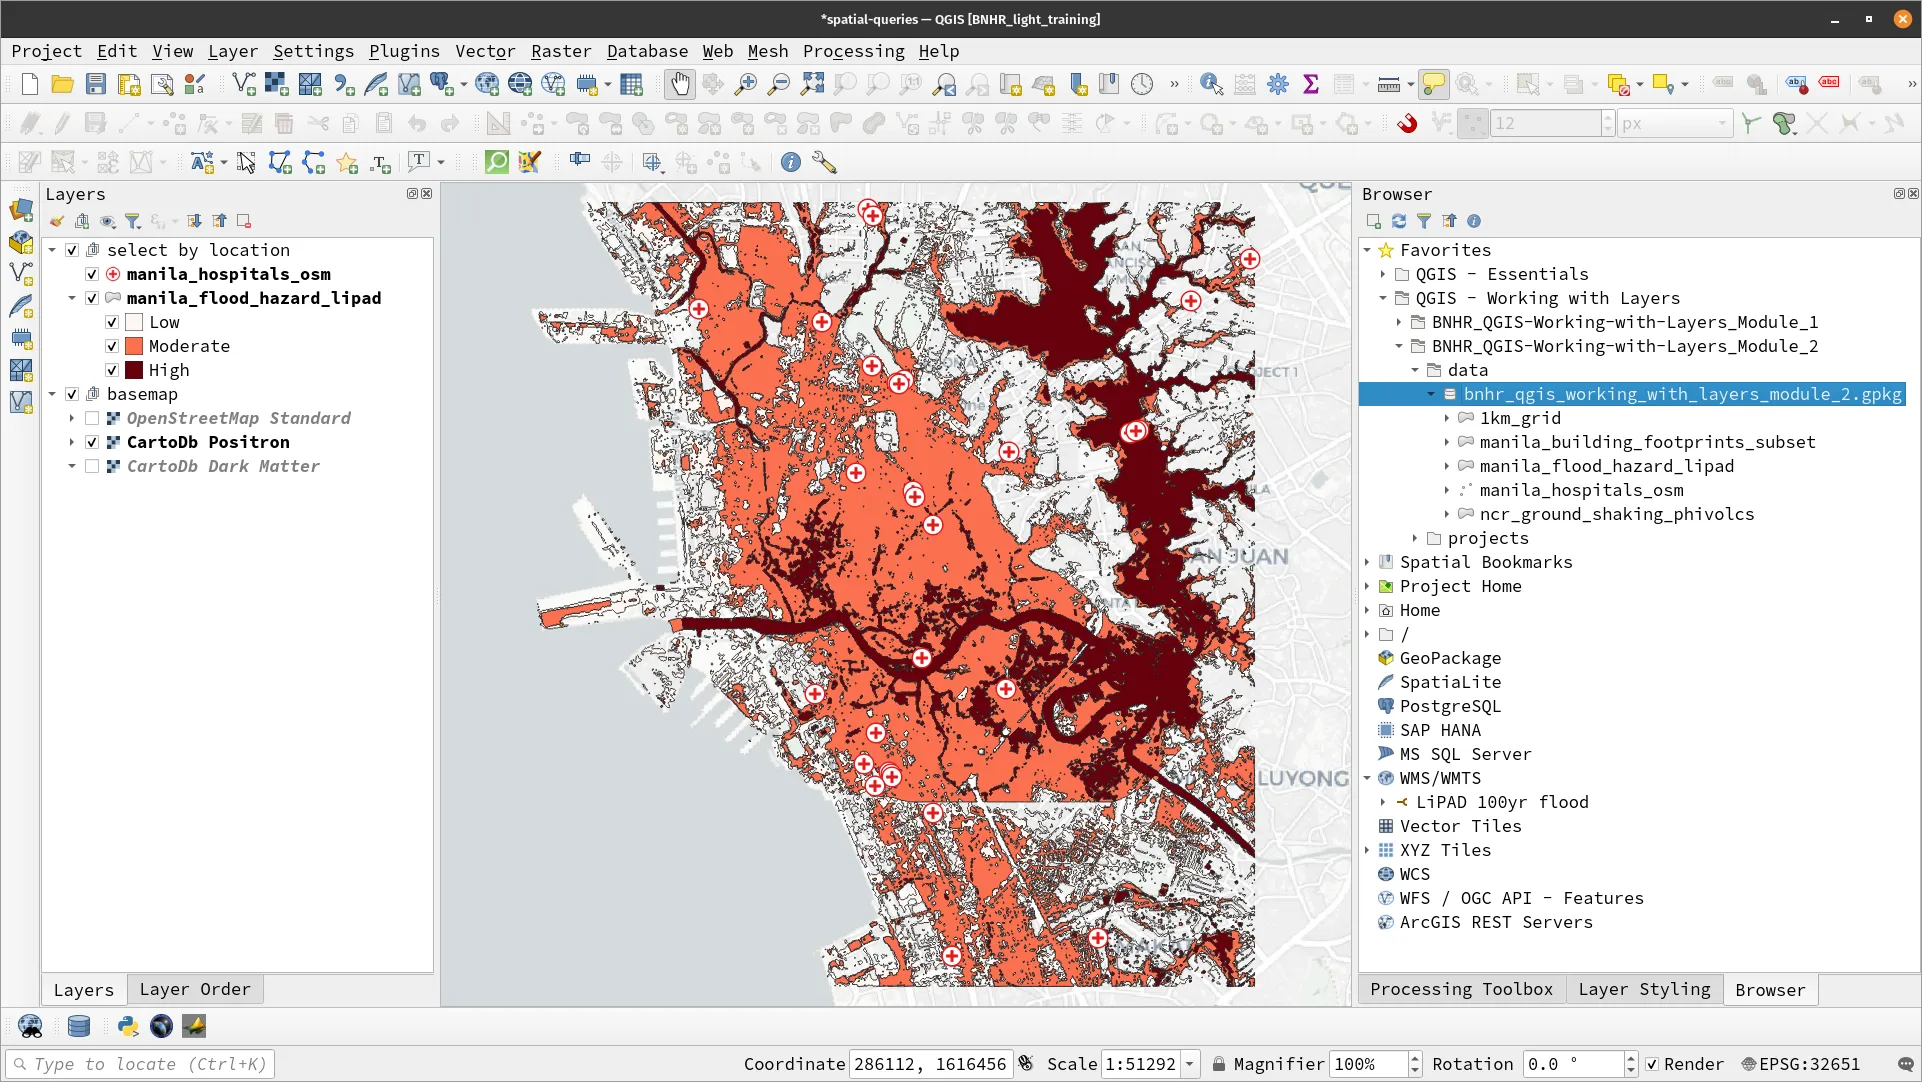
Section titled “Select by location”One of the most common things we can do in a GIS that usually cannot be done in other information systems is doing analysis based on locations. For example, what if you want to find the hospitals that are at risk of flooding in the city of Manila
Exercise 2.1. Selecting hospitals in flood hazard areas
Section titled “Exercise 2.1. Selecting hospitals in flood hazard areas”The data used in this exercise is found in the bnhr_qgis_working_with_layers_module_2.gpkg inside the data folder.
In this exercise, you will use Select by location algorithm to select hospitals that intersect with a flood hazard layer. You will also select hospitals that intersect with High flood hazard areas.
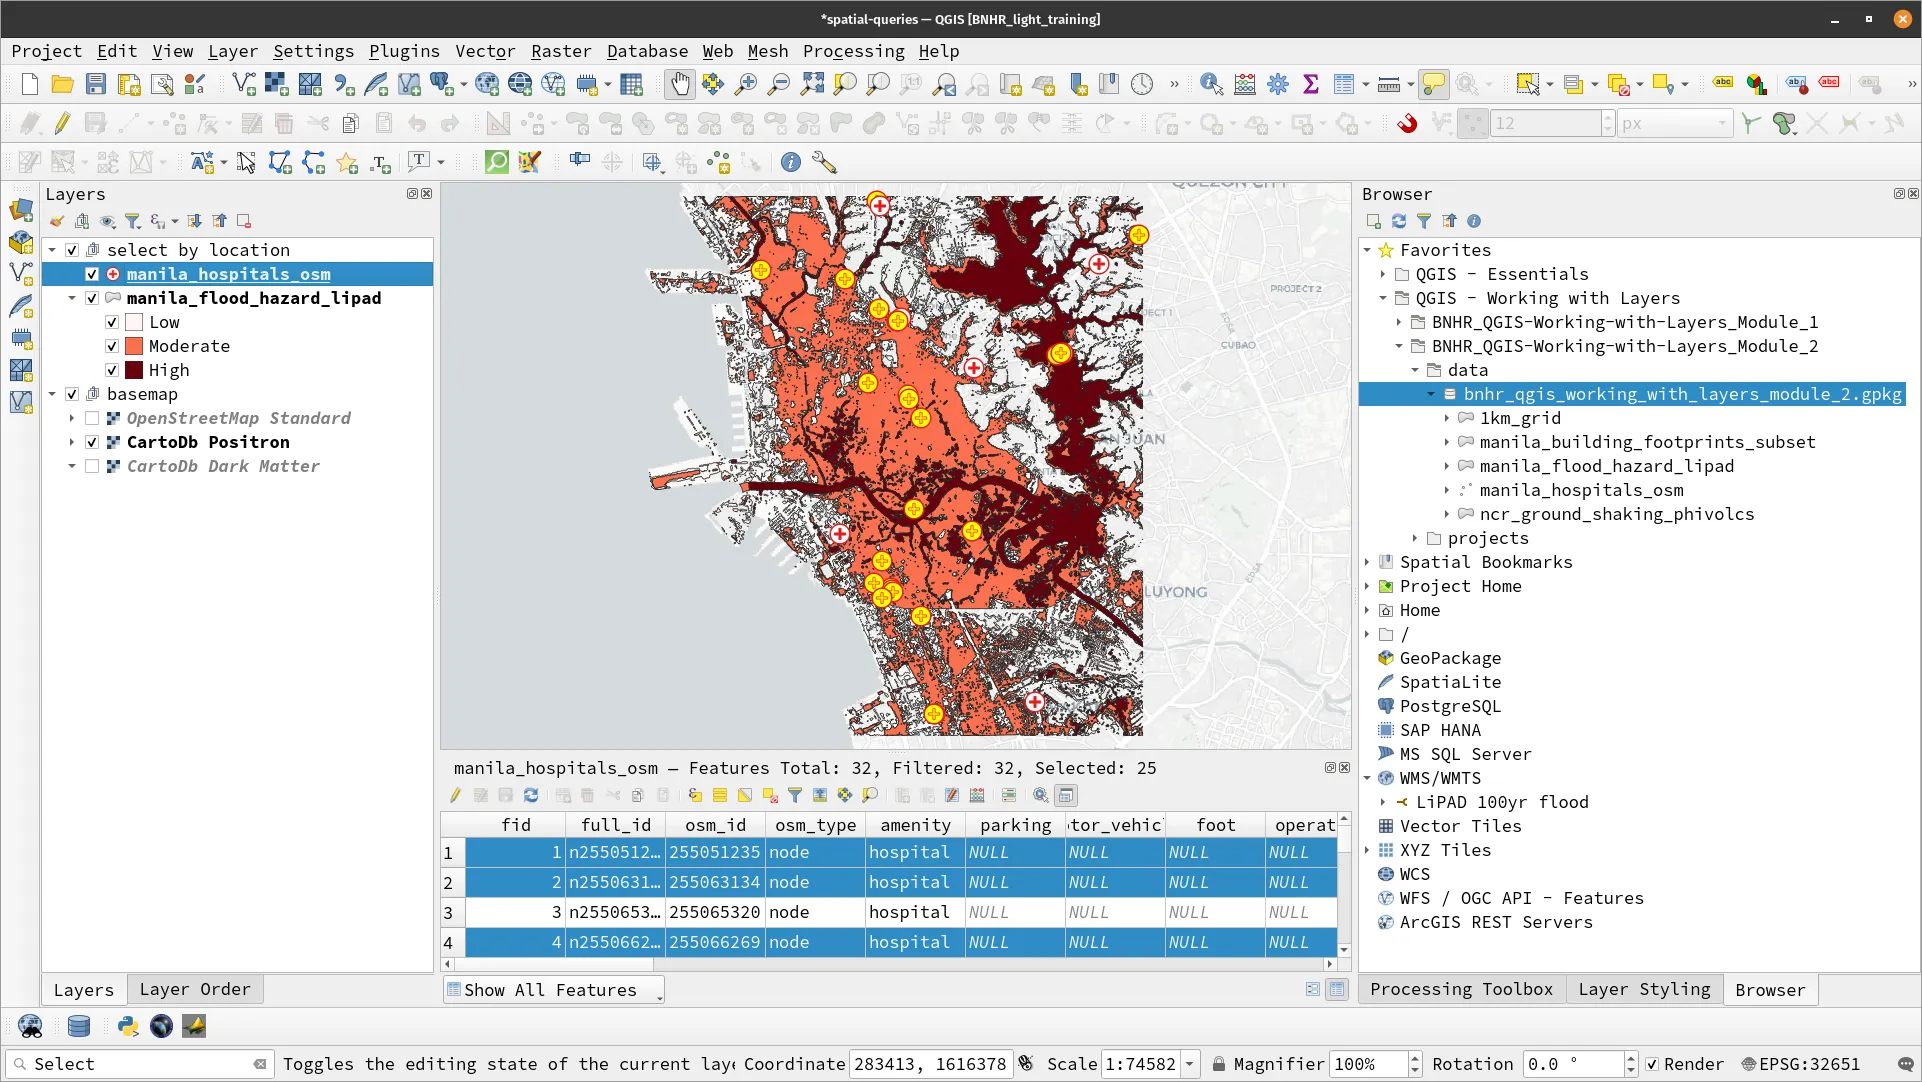
- Load the manila_flood_hazard_lipad and manila_amenity_hospital_osm layers in QGIS. You may opt to style these layers, add a basemap (e.g. OpenStreetMap Standard), and create groups.
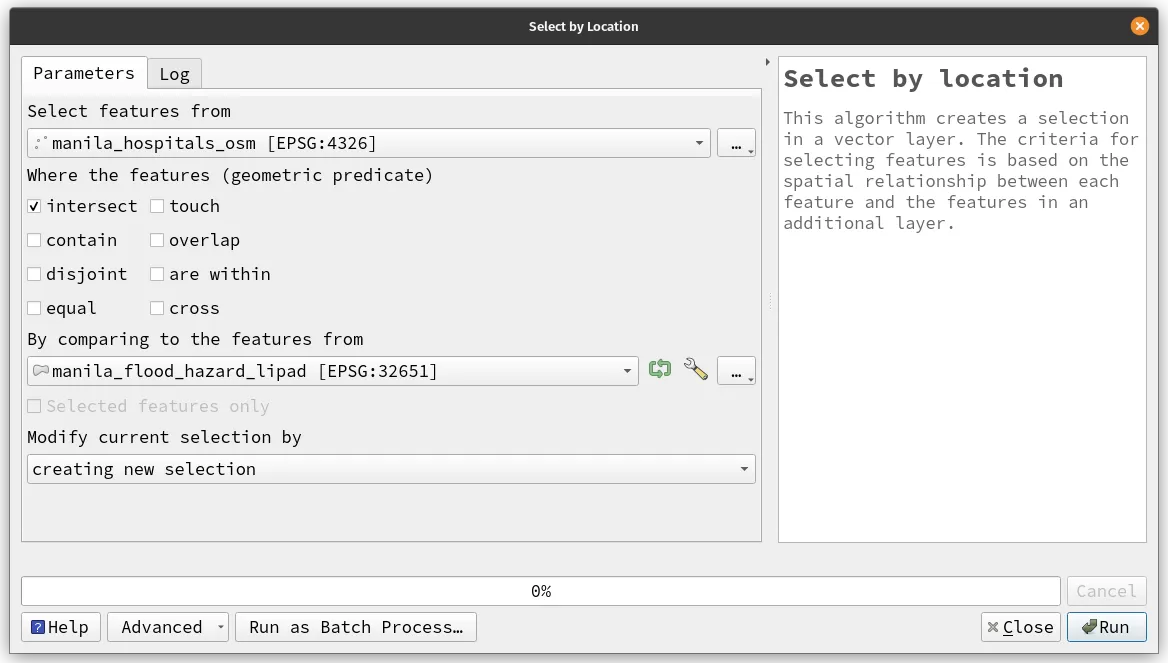
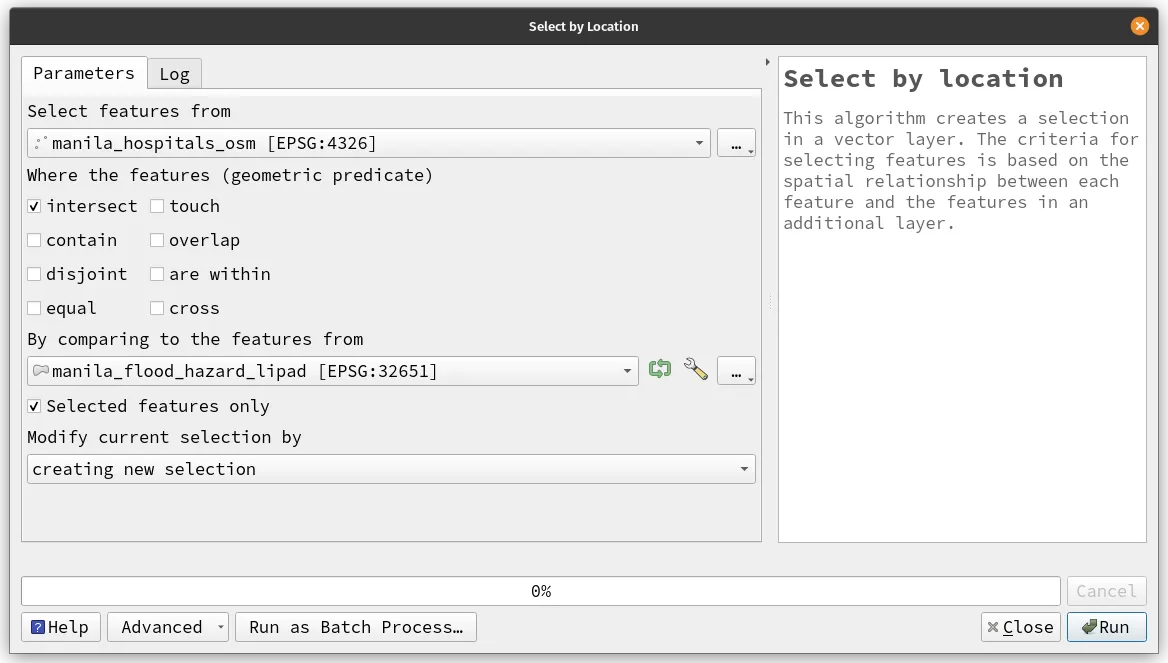
- Run the Select by Location (
 ) algorithm and use the following parameters.
- Select features from: manila_amenity_hospital_osm
- Where the feature (geometric predicate): intersects
- By comparing to the features from: manila_flood_hazard_lipad
- Modify current selection by: Creating new selection
- The hospitals that intersect with the flood hazard layer should be selected in the map canvas and the attribute table.
- Next, you want to select only the hospitals that intersect with high flood hazard. What should you do?
- First, you can choose to either apply a filter or select to manila_flood_hazard_lipad layer such that only the features with high hazard are left or selected.
- If you opted to apply a filter on the manila_flood_hazard_lipad layer, you can run the Select by Location as you did before without any changes.
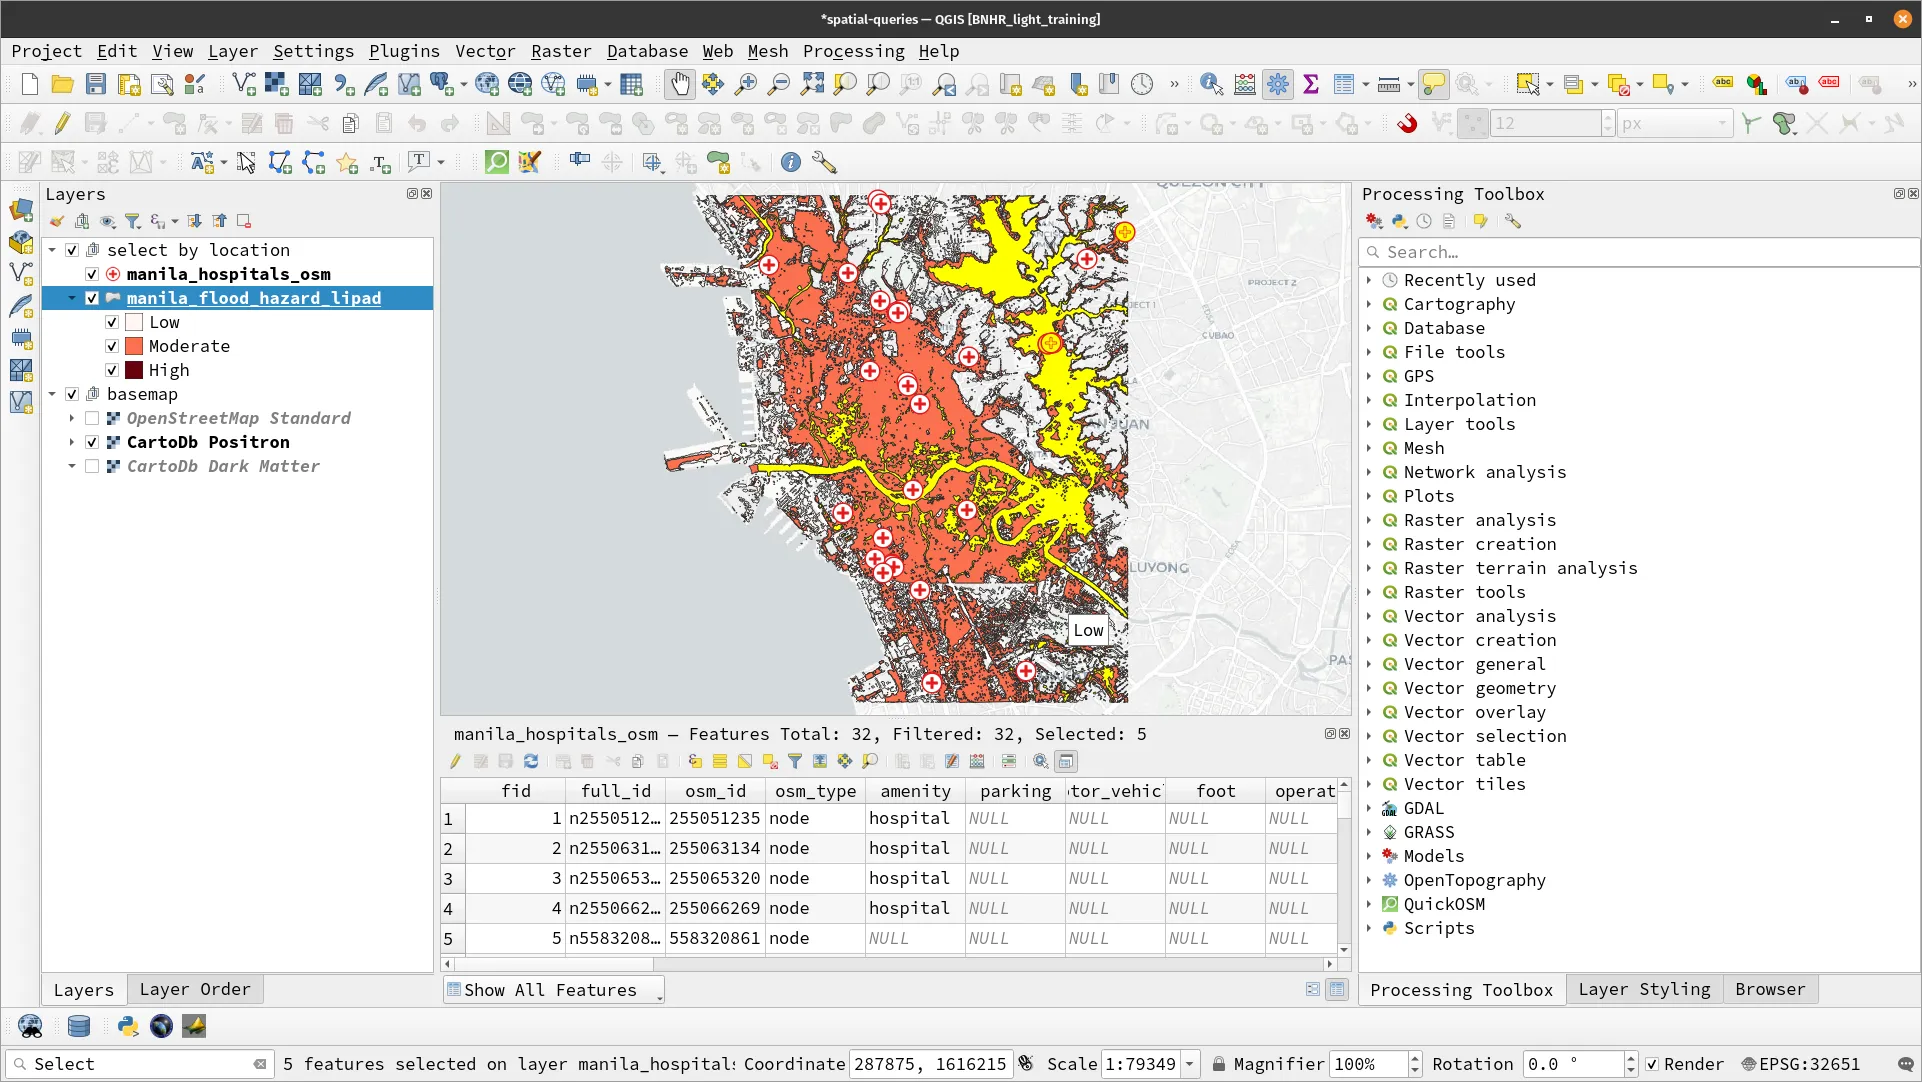
- In case you opted to use select on the manila_flood_hazard_lipad layer, run the Select by Location algorithm but use the parameters below instead. Make sure that [x] Selected features only is checked under manila_flood_hazard_lipad.
- Five (5) hospitals should be selected.
Join by location
Section titled “Join by location”Joining by location means adding attributes to a vector layer based on its relationship with another vector layer. For example, you want to add flood hazard information to households in Metro Manila.
This is where the Join attributes by location algorithm comes in. This algorithm takes an input vector layer (base) and a secondary vector layer and produces a new vector layer that is an extension of the input layer with extra attributes in its attribute table coming from the secondary layer.
In contrast to joining attributes by field value where this process is accomplished by selecting an attribute from both the input and the secondary vector layers to establish the join criteria; when joining attributes by location, the additional attributes and their corresponding values from the second vector are selected based on a spatial criterion. Specifically, a spatial query is applied to select the values from the second layer that are added to each feature from the first layer in the resulting one
Exercise 2.2. Tagging households with their respective flood risks
Section titled “Exercise 2.2. Tagging households with their respective flood risks”The data used in this exercise is found in the bnhr_qgis_working_with_layers_module_2.gpkg inside the data folder.
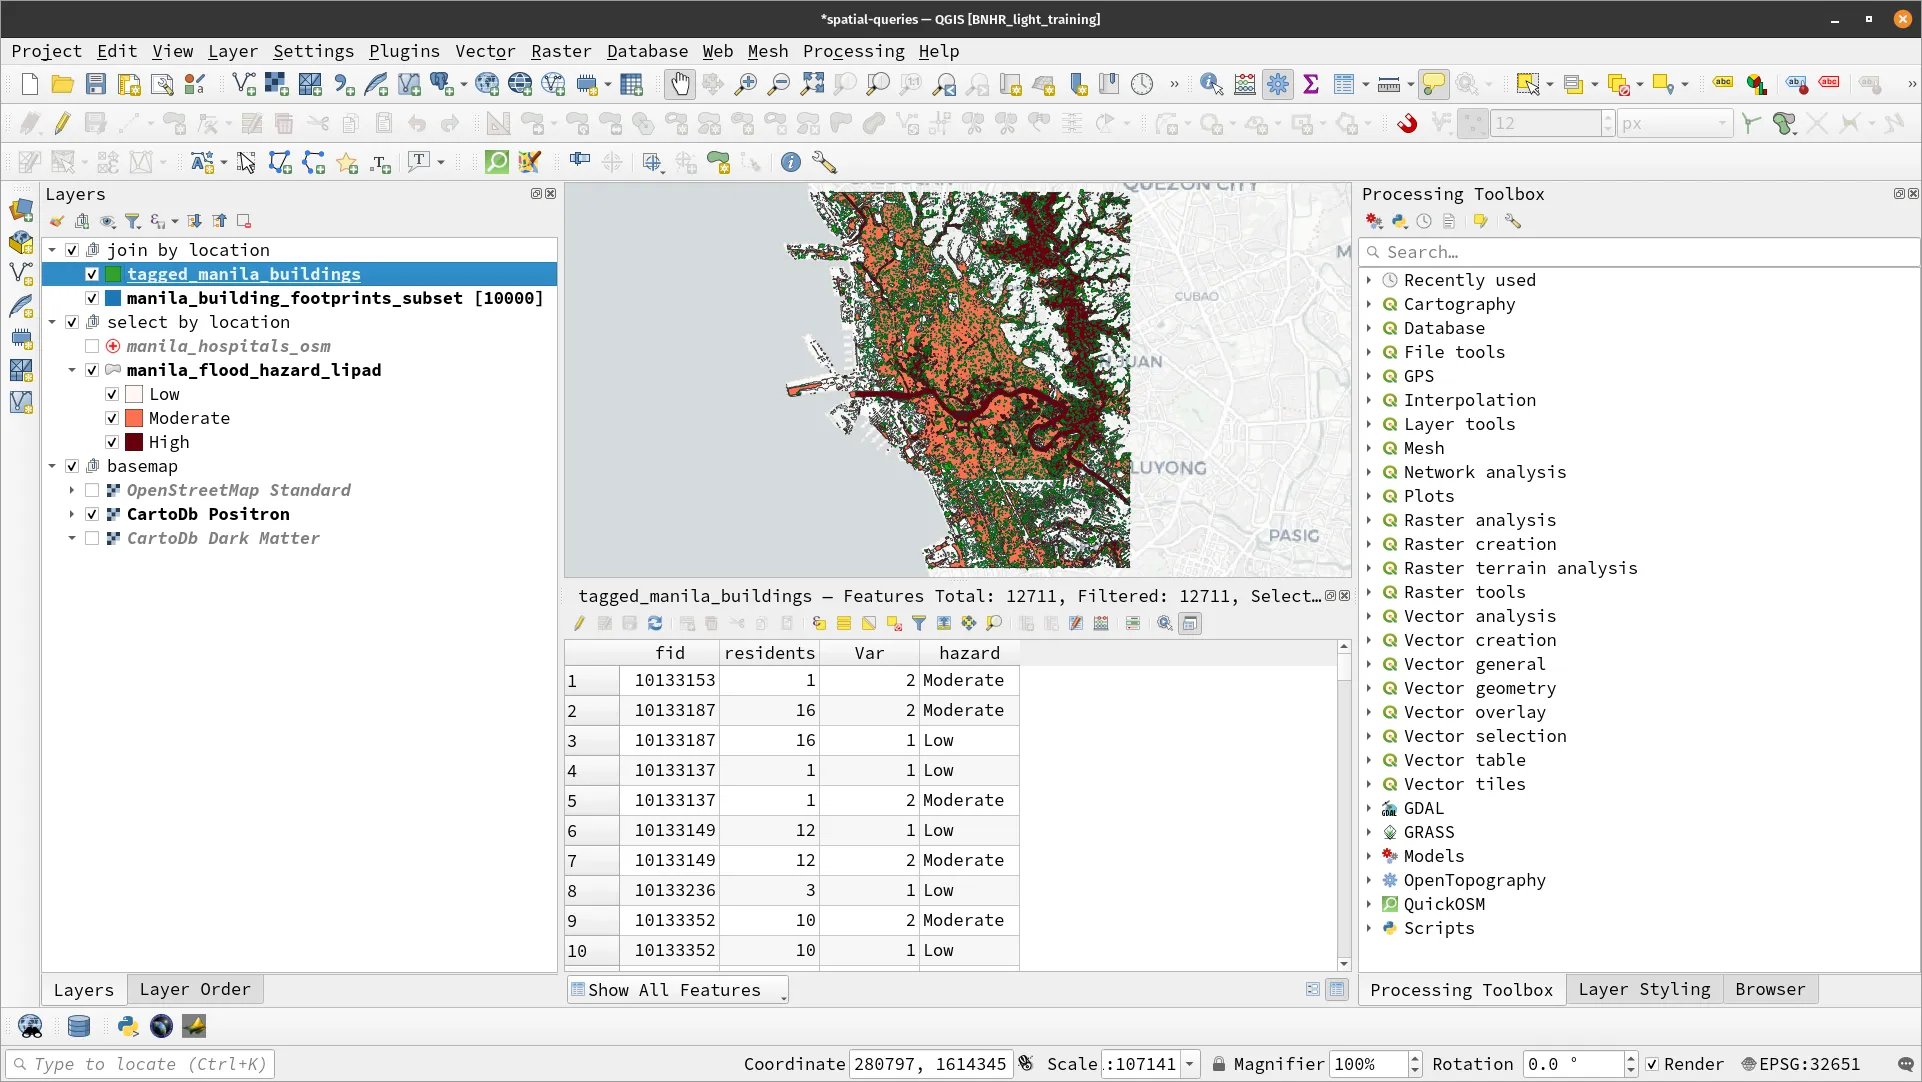
In this exercise, you will use Join attributes by location to add a hazard field to the manila_building_footprints_subset layer based on the value of the manila_flood_hazard_lipad where the former is located.
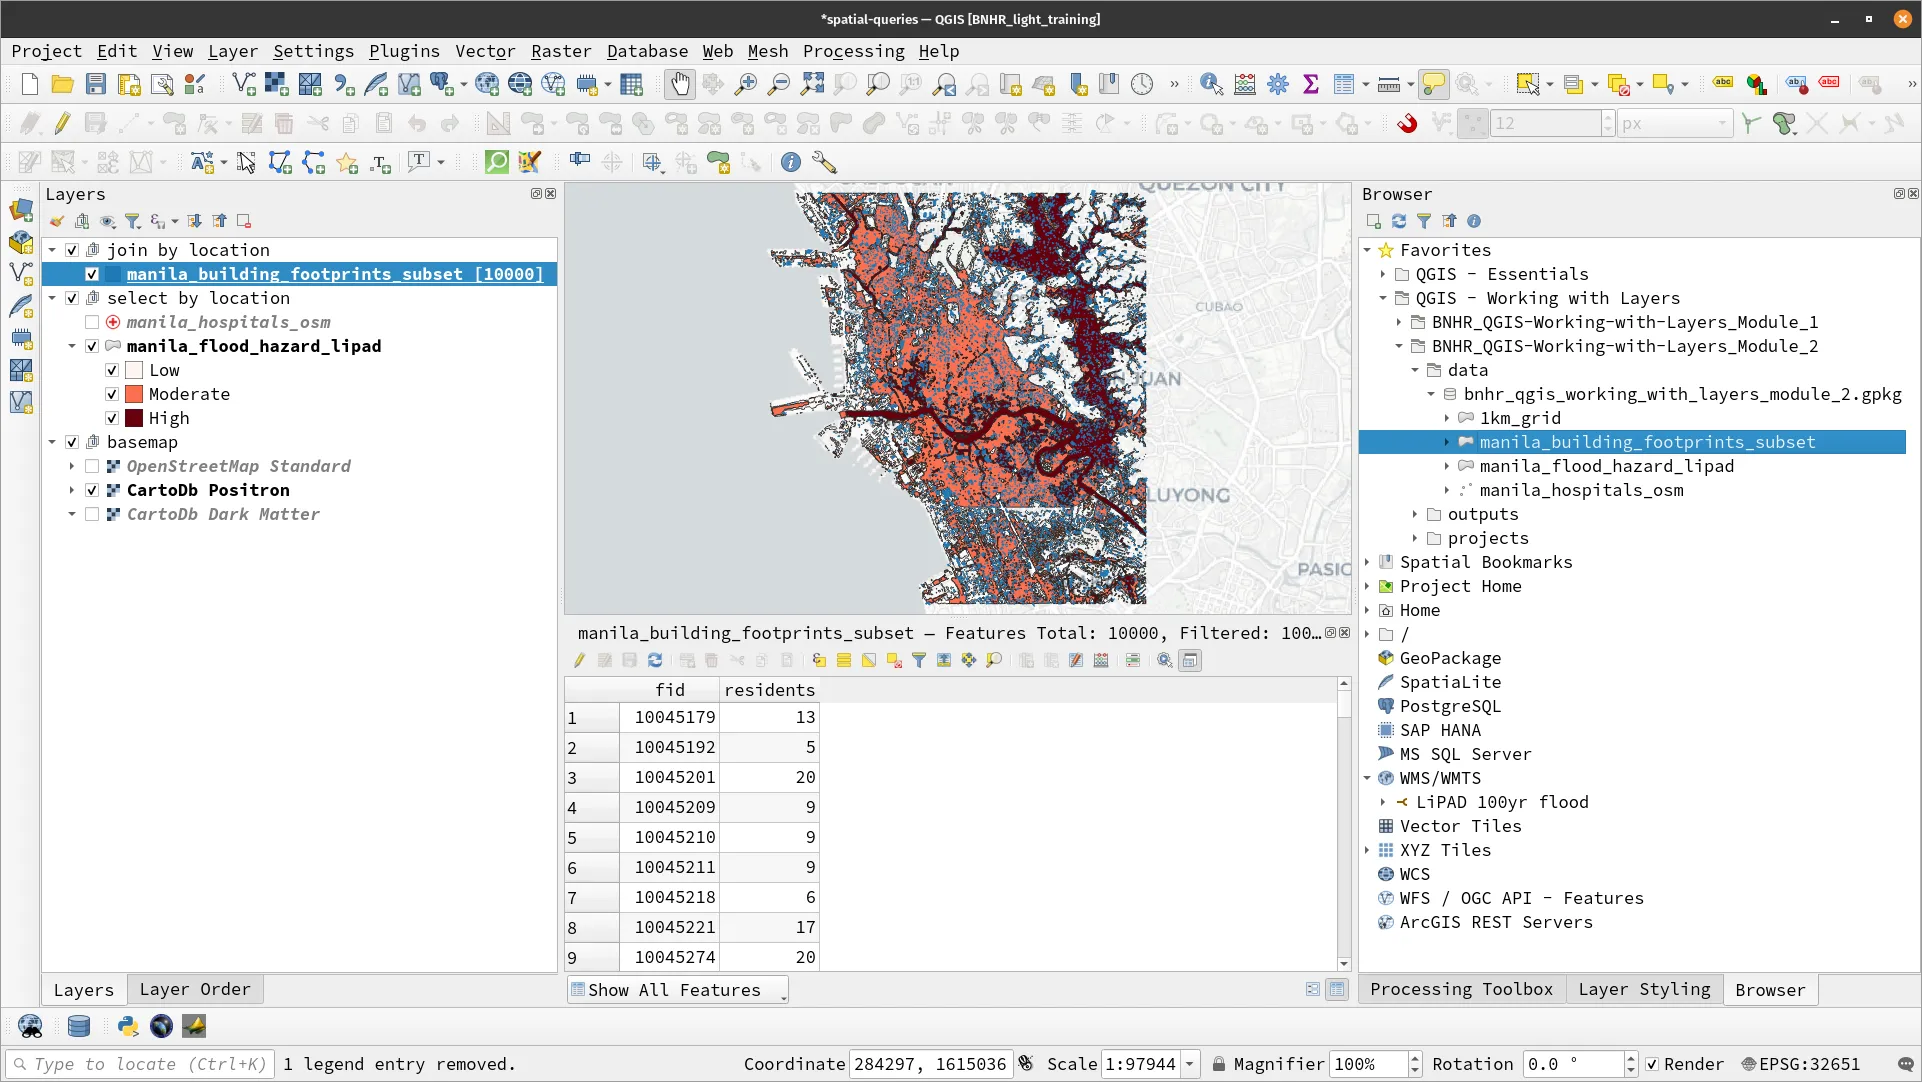
- Load the manila_building_footprints_subset layer and open its attribute table.
- Run a Join attributes by location algorithm with the following parameters.
- Join to features in: manila_building_footprints_subset
- Where the feature (geometric predicate): intersects
- By comparing to the features from: manila_flood_hazard_lipad
- Fields to add: Var, hazard
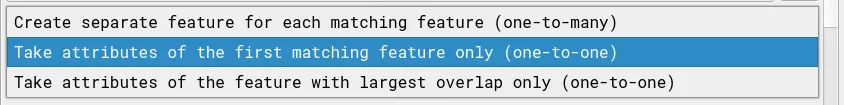
- Join type: Take attributes of first matching feature only (one-to-one)
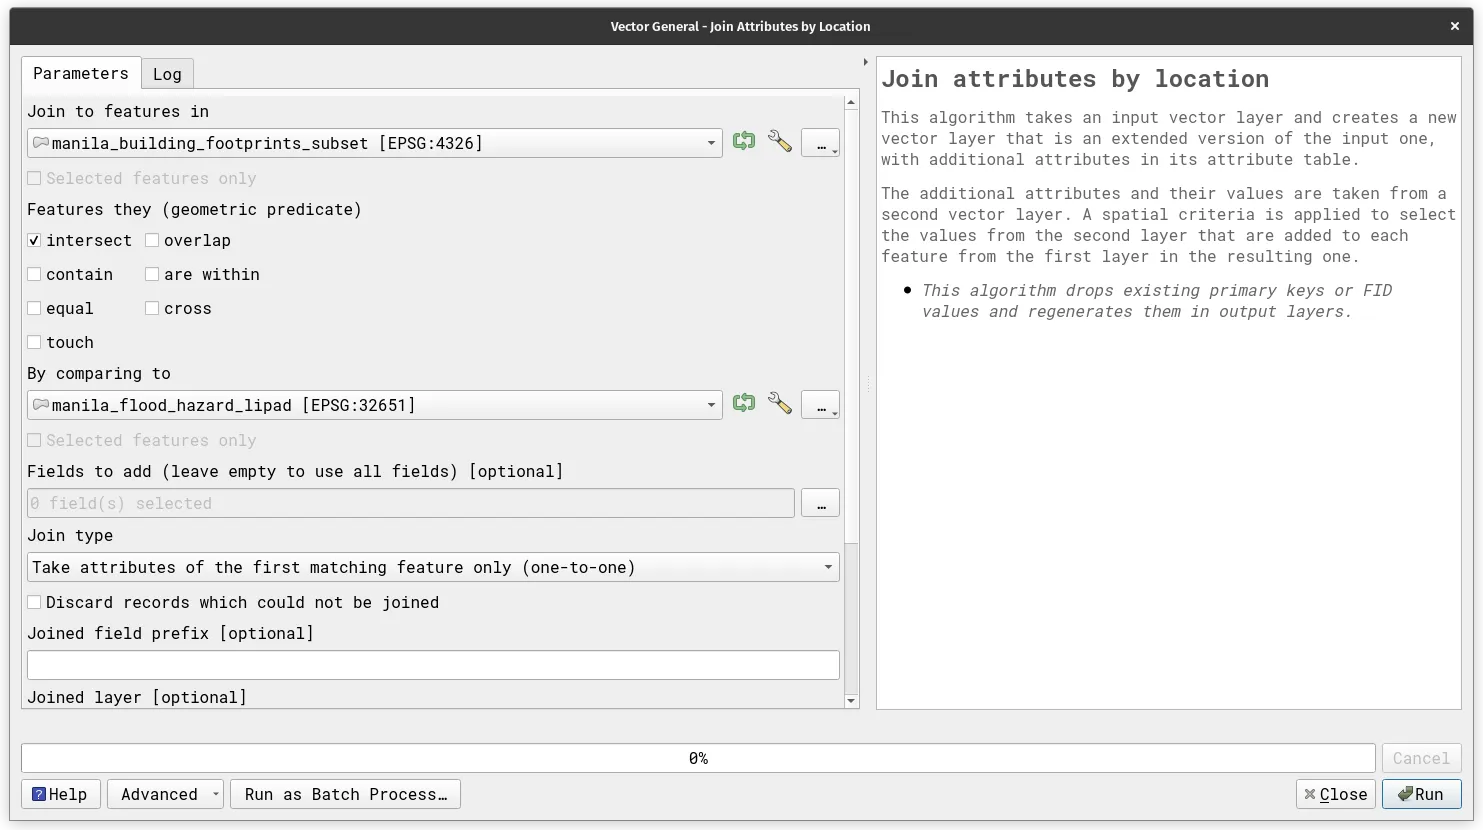
- Rename the output to tagged_manila_buildings. Open its attribute table and notice that there should be a hazard and/or Var field added.
Getting statistics by area/location
Section titled “Getting statistics by area/location”Aside from selecting/filtering features by location and joining attributes by location, we can also summarize attributes by location. This is very useful when you want to summarize the attributes of a point or line vector per polygon. For example, what if we have a grid and we want to count the number of residents in each grid that are at risk of flood or even more specifically, at high risk of flood.
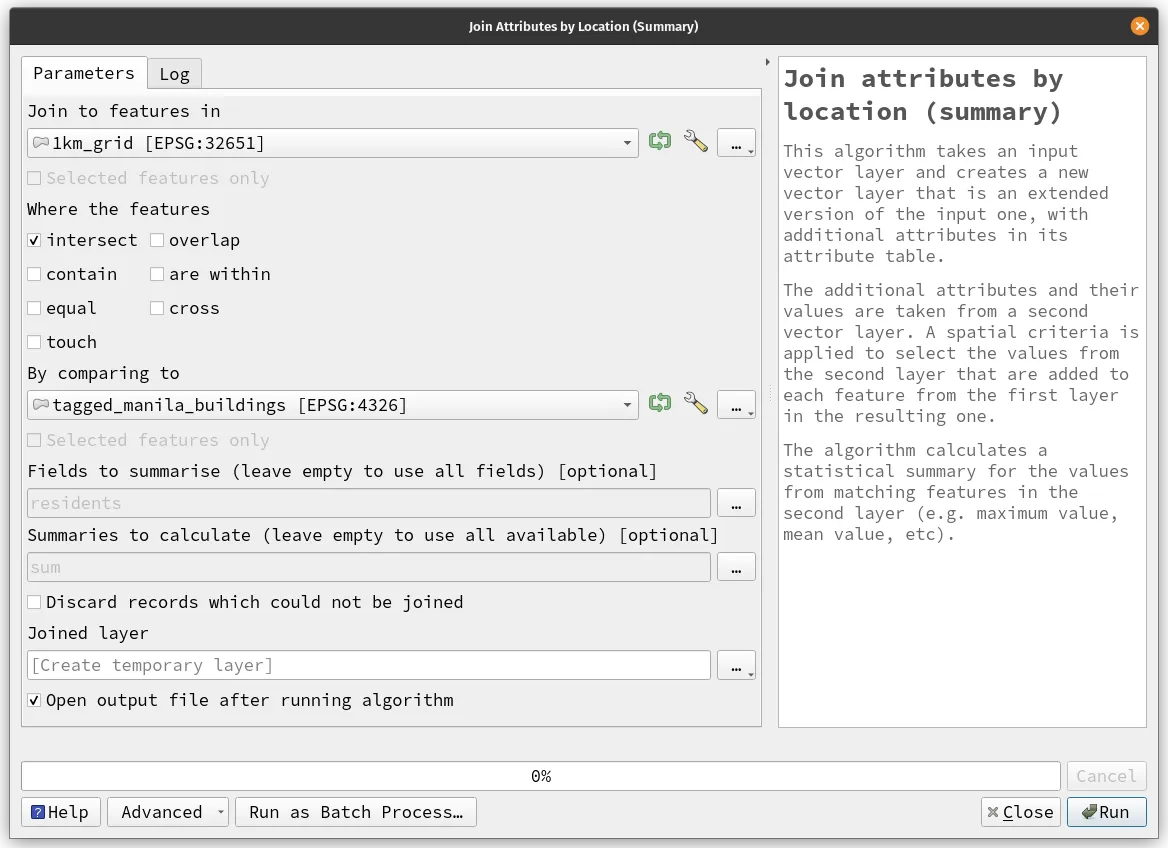
This is where the Join attributes by location (summary) algorithm comes in. Similar to the Join attributes by field value algorithm, this algorithm also takes an input vector layer (base) and a secondary vector layer and produces a new vector layer that is an extension of the input layer. However, instead of just adding the fields from the secondary layer, this algorithm calculates a statistical summary for the values from matching features in the second layer. It does this by applying a spatial criteria to select the values from the second layer that are added to each feature from the first layer. You can choose from a range of summary statistics such as the maximum, minimum, mean, or standard deviation.
Exercise 2.3. Counting the number of people at risk inside a specific area/location
Section titled “Exercise 2.3. Counting the number of people at risk inside a specific area/location”The data used in this exercise is found in the bnhr_qgis_working_with_layers_module_2.gpkg inside the data folder.
In this exercise, you will use Join attributes by location (summary) to compute for the total number (sum) of residents from the tagged_manila_buildings layer that you created in the previous exercise and located within each grid of the 1km_grid layer.
- Load the 1km_grid layer and style it appropriately.
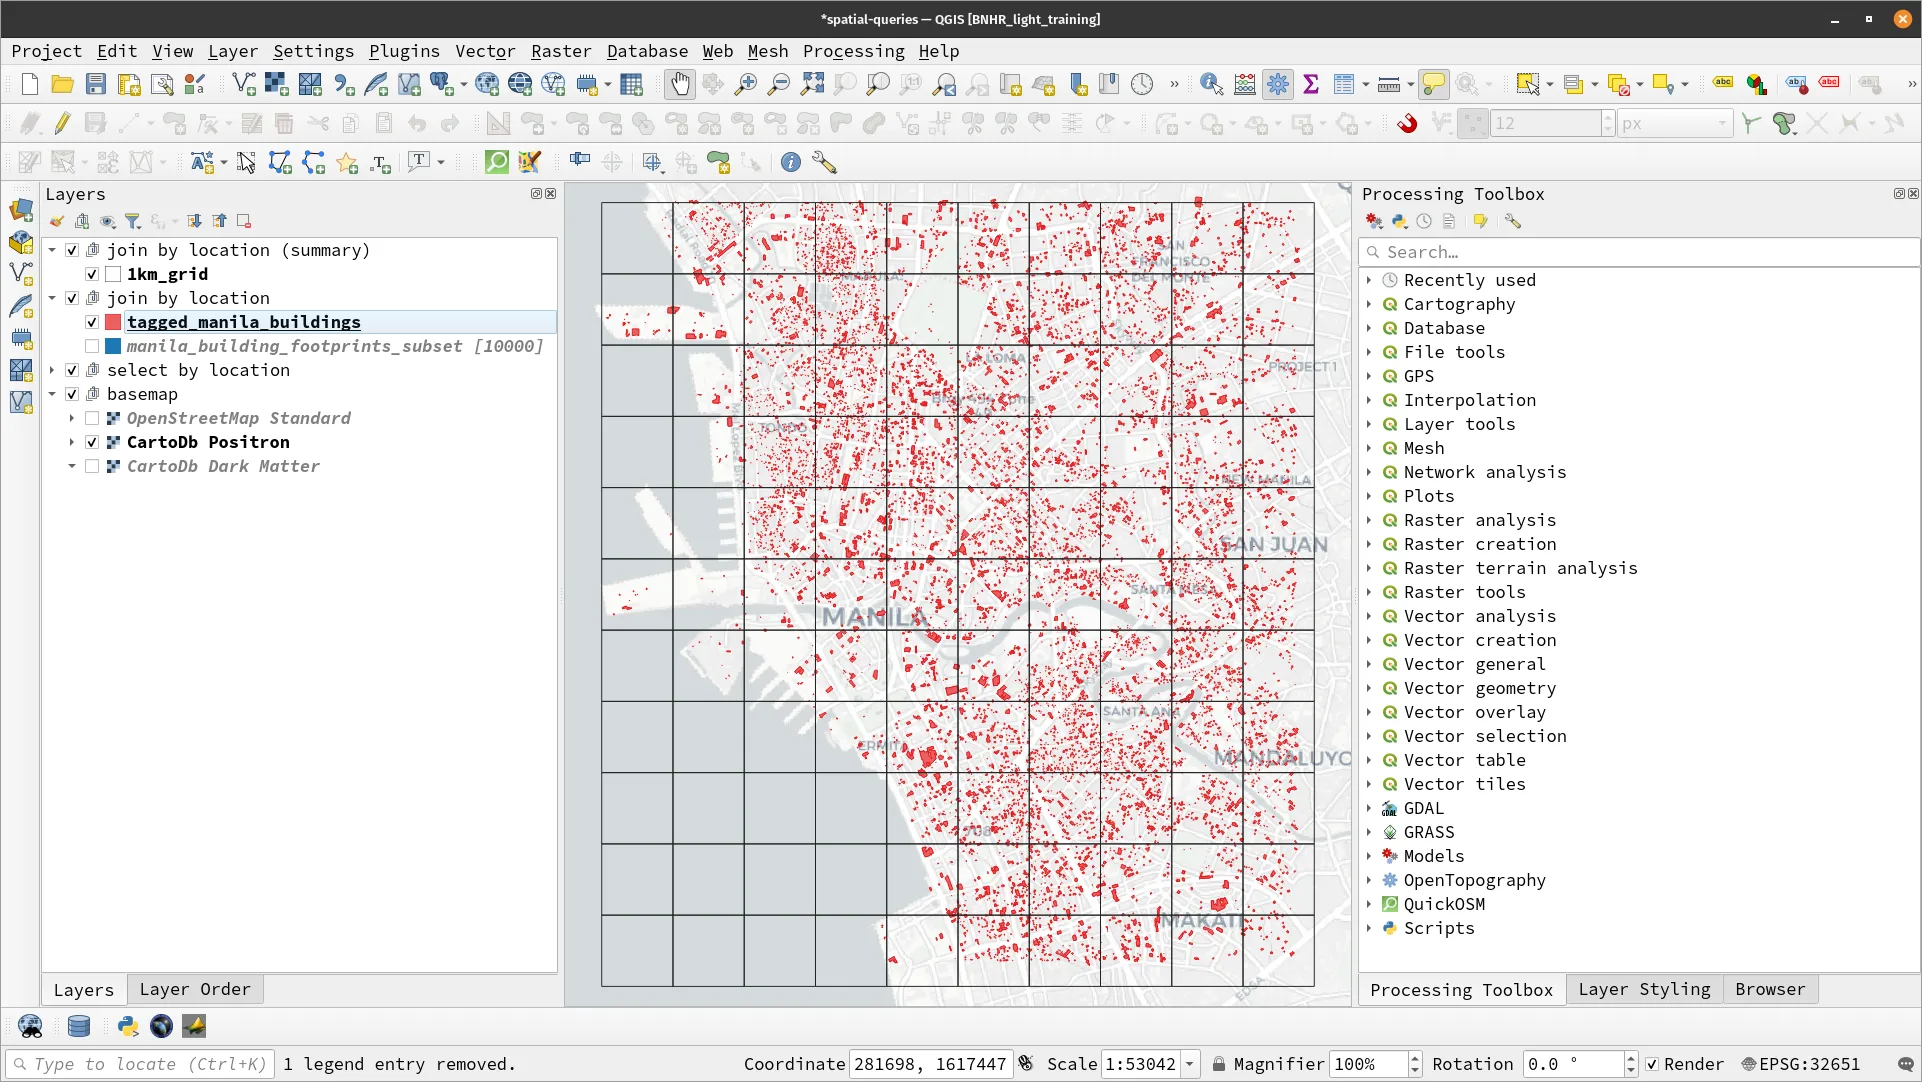
- To get the total number of residents per grid cell, run a Join attributes by location (summary) () algorithm with the following parameters.
- Join to features in: 1km_grid
- Where the feature: intersects
- By comparing to: tagged_manila_buildings
- Fields to summarize: residents
- Summaries to calculate: sum
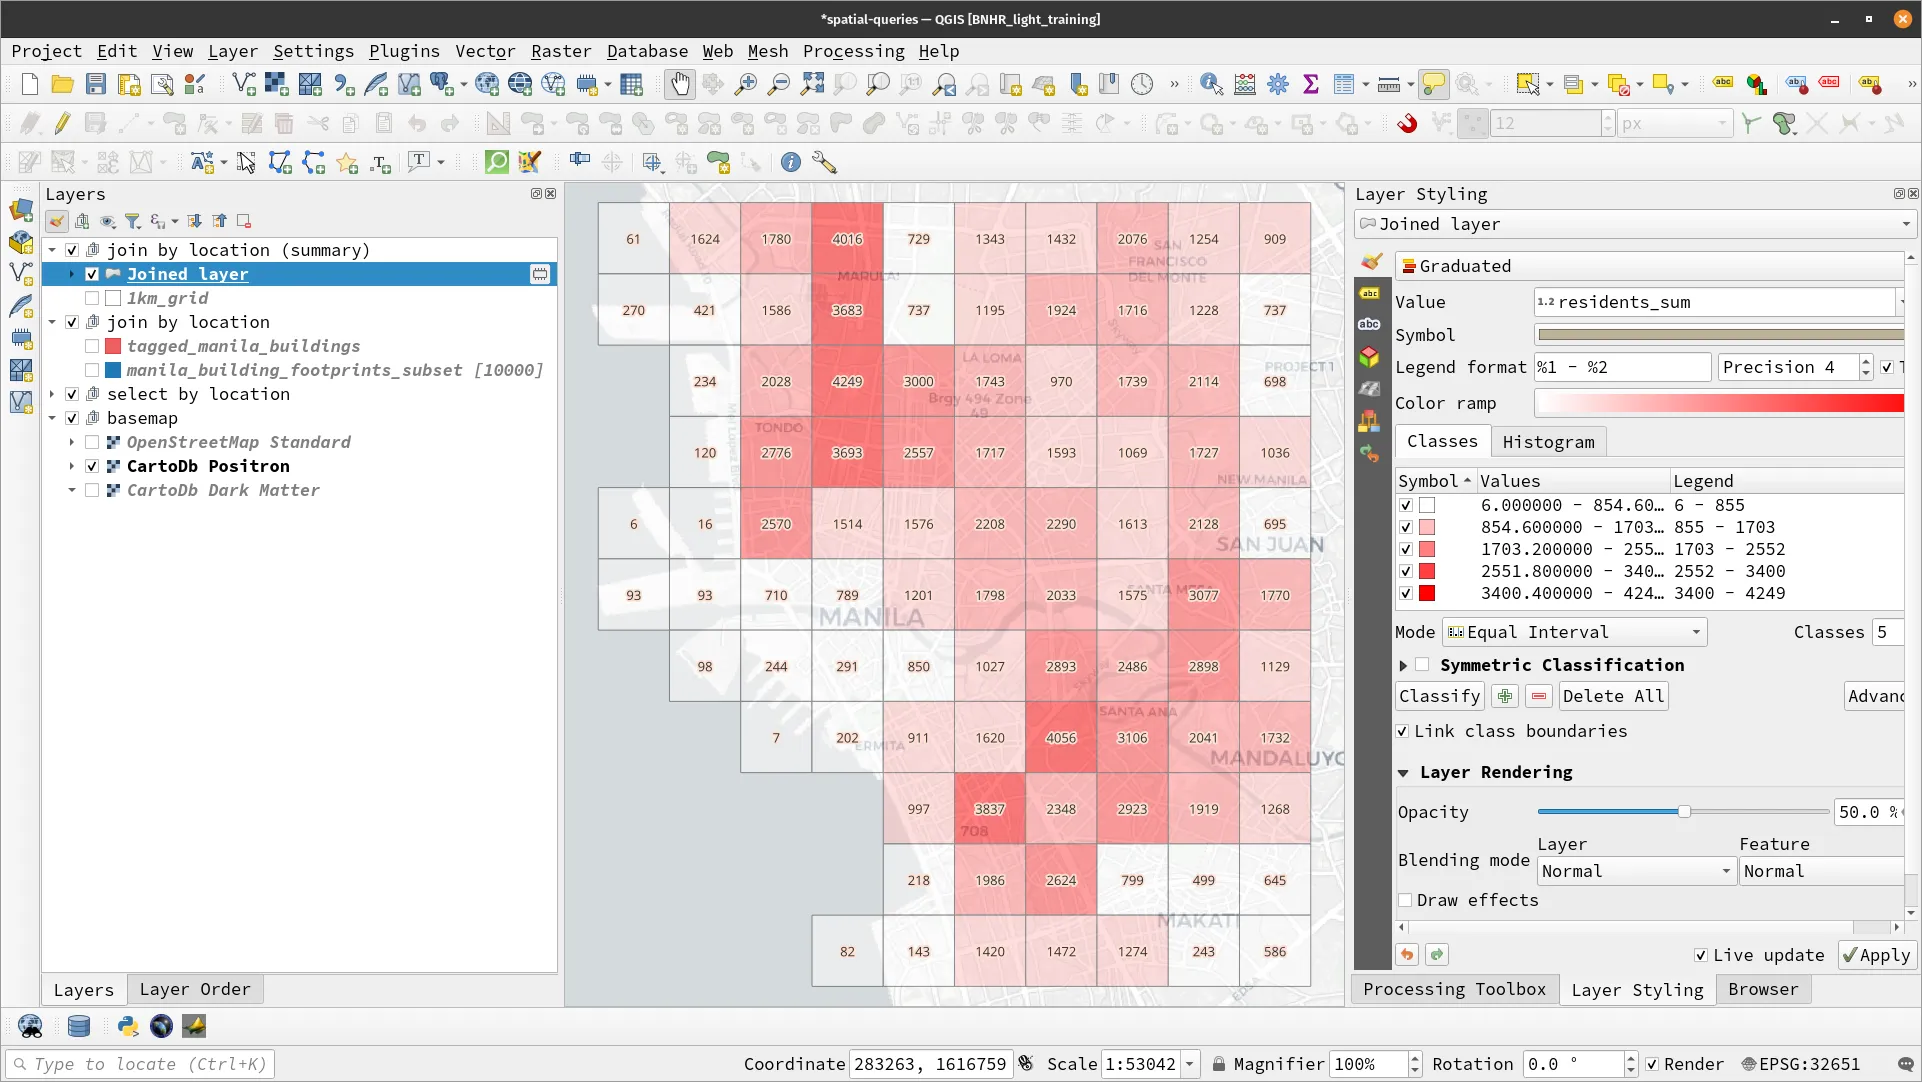
- You should have a resulting Joined layer in the Layers panel that has a residents_sum field which is the sum of residents inside the grid cell. Feel free to rename this layer and style appropriately.
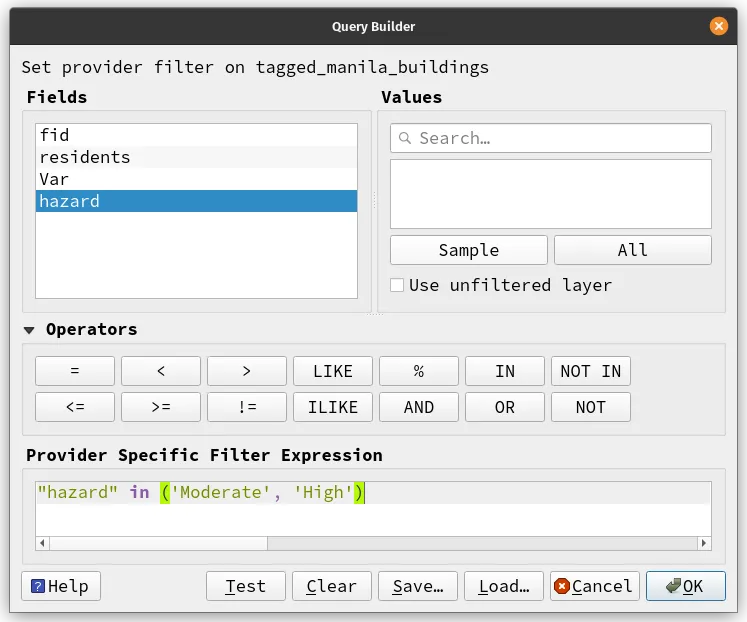
- Now what if you want to count just the number of residents that are in moderate or high hazard? What will you do?
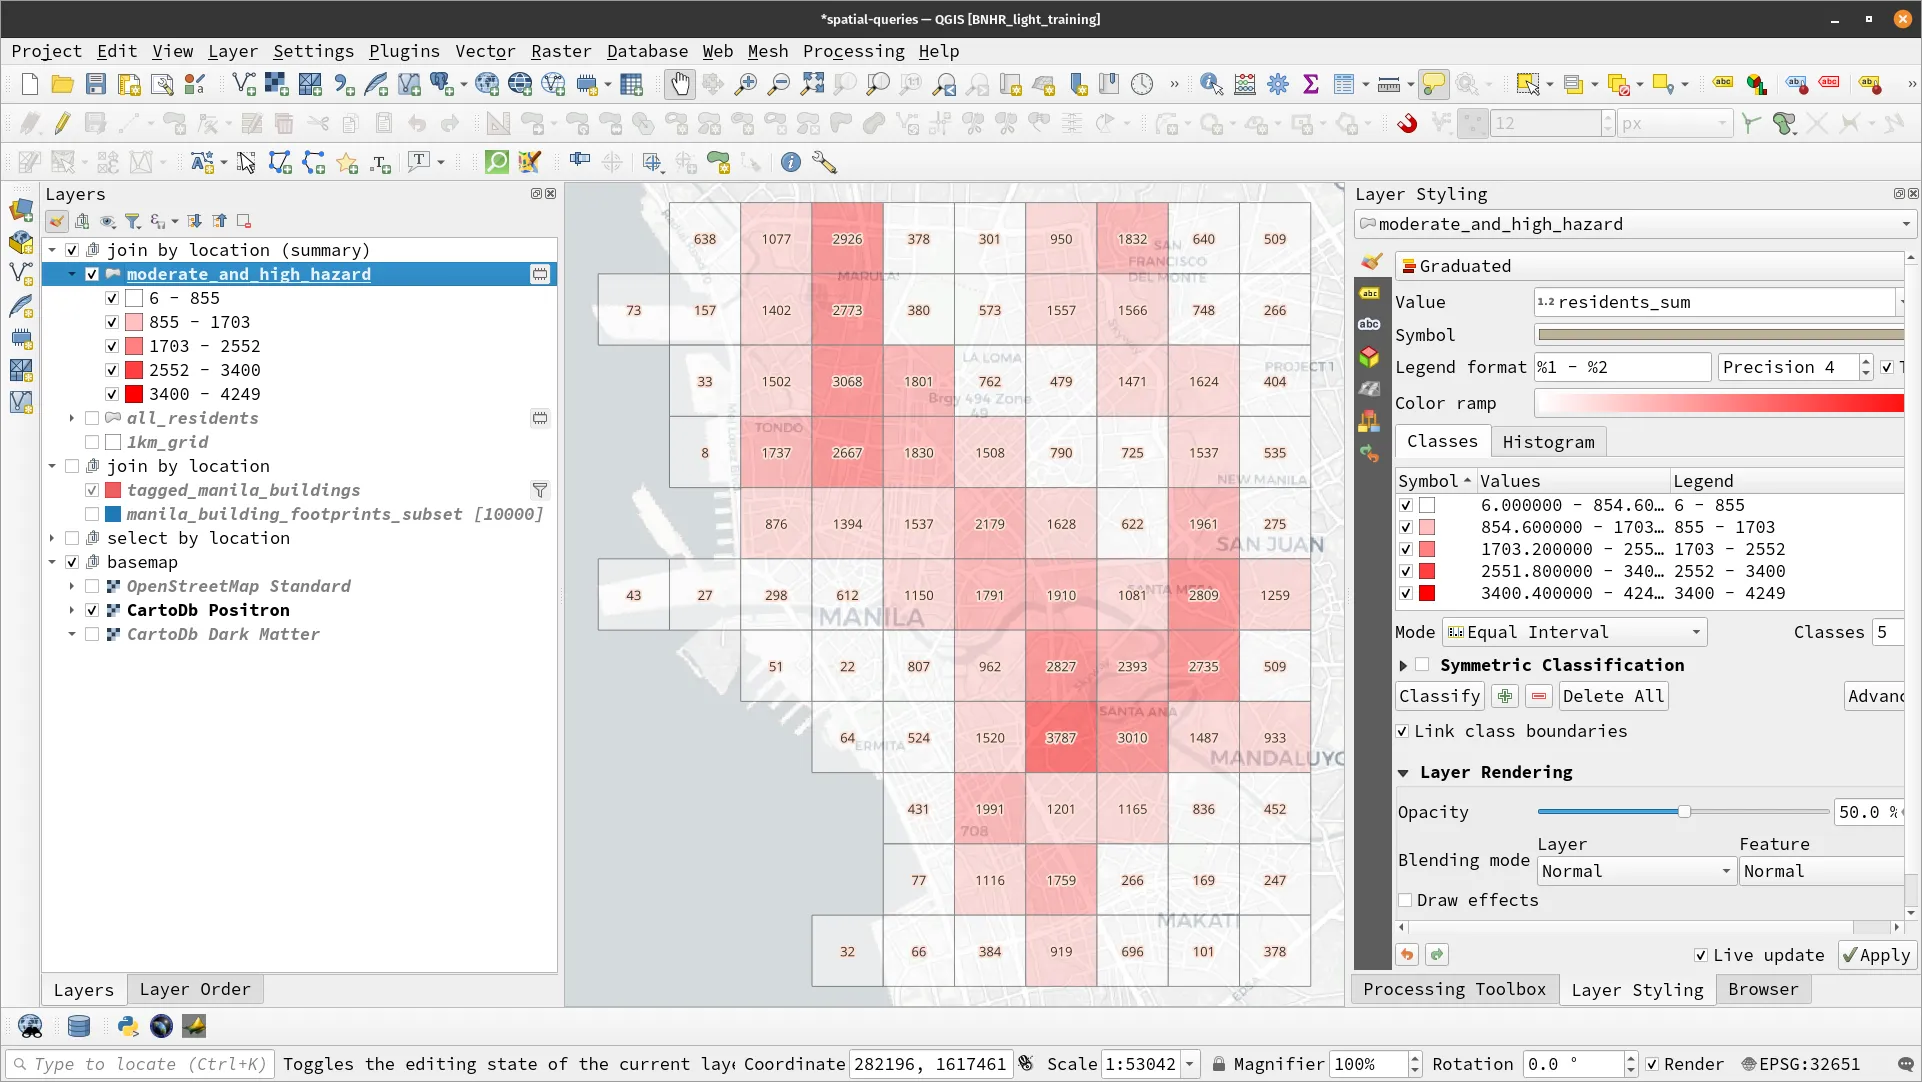
- Similar to exercise 2.1, you can either apply a filter or select to tagged_manila_buildings layer such that only the features with moderate or high hazard are left or selected. In this case, apply the following filter.
- Run the Join attributes by location (summary) algorithm again with the same parameters.
Memory boosters and review
Section titled “Memory boosters and review”What is the purpose of the “Join by Location” query in QGIS?
Section titled “What is the purpose of the “Join by Location” query in QGIS?”To join the attributes of two layers based on their spatial relationship.
What is the purpose of the “Select by Location” query in QGIS?
Section titled “What is the purpose of the “Select by Location” query in QGIS?”To select features in one layer that are spatially related to features in another layer.
What processing algorithm in QGIS can be used to compute statistics or aggregate data based on the spatial location of features?
Section titled “What processing algorithm in QGIS can be used to compute statistics or aggregate data based on the spatial location of features?”“Join attributes by location (summary)” algorithm.
What is the difference between a spatial join and a non-spatial/attribute join in QGIS?
Section titled “What is the difference between a spatial join and a non-spatial/attribute join in QGIS?”A spatial join joins two layers based on their spatial relationship, while a non-spatial join joins two layers based on a shared attribute or field value.
What does the “summary” part in the Join Attributes By Location (summary) algorithm mean?
Section titled “What does the “summary” part in the Join Attributes By Location (summary) algorithm mean?”It means that you can summarize data from the join layer based on certain conditions. For example, you can count the number of features or get the sum of a field from one layer that intersect with features from another layer.
Certification and support
Section titled “Certification and support”Contact us or sign-up to our courses if you are interested in having this as an instructor-led or self-paced course.