
Working with attributes
Introduction
Section titled “Introduction”This module provides an introduction to working with layers in QGIS. Layers are the building blocks of any GIS project and understanding how to work with them is essential for anyone seeking to create maps or conduct spatial analysis. The module is divided into four sections, each covering an important aspect of working with layers:
- Layer attributes and the attribute table provides an overview of the attribute table, including how to access and view attribute data for a layer.
- Attribute joins explains how to join attribute data from one layer to another based on a shared attribute field.
- Selects and Filters by attribute explores how to select and filter features based on attribute values.
- The Field Calculator focuses on how to use the Field Calculator to modify attribute data.
What you should already know
Section titled “What you should already know”Since this is a beginner module, no previous knowledge of GIS or QGIS is required. However, familiarity with the QGIS interface as discussed in QGIS: Essentials - Introduction to QGIS, how to load different kinds of layers as discussed in QGIS: Essentials - Introduction to layers in QGIS, and how to run processing algorithms as discussed in QGIS: Essentials - Basic geospatial processing techniques are preferred.
Layer attributes and the attribute table
Section titled “Layer attributes and the attribute table”In any GIS project, the spatial features on a map are only part of the story. Recall that in the Essentials workbook, we said that the way a GIS represents information about the real world is through spatial data models which are composed of spatial features and attributes.
In order to fully analyze and understand the data, it’s important to also work with the attribute data associated with each feature. In this chapter, we will cover the basics of layer attributes and the attribute table in QGIS including how to access and view attribute data in QGIS as well as how to modify that data to suit your needs.
What are attributes and what is the attribute table
Section titled “What are attributes and what is the attribute table”Attributes are information associated with a geographic feature, coverage, or area. They are also commonly known as fields. Examples include:
- name of an object
- length of a road
- area of a lot parcel
- population in a barangay
- flood hazard in an area
- elevation of a raster pixel
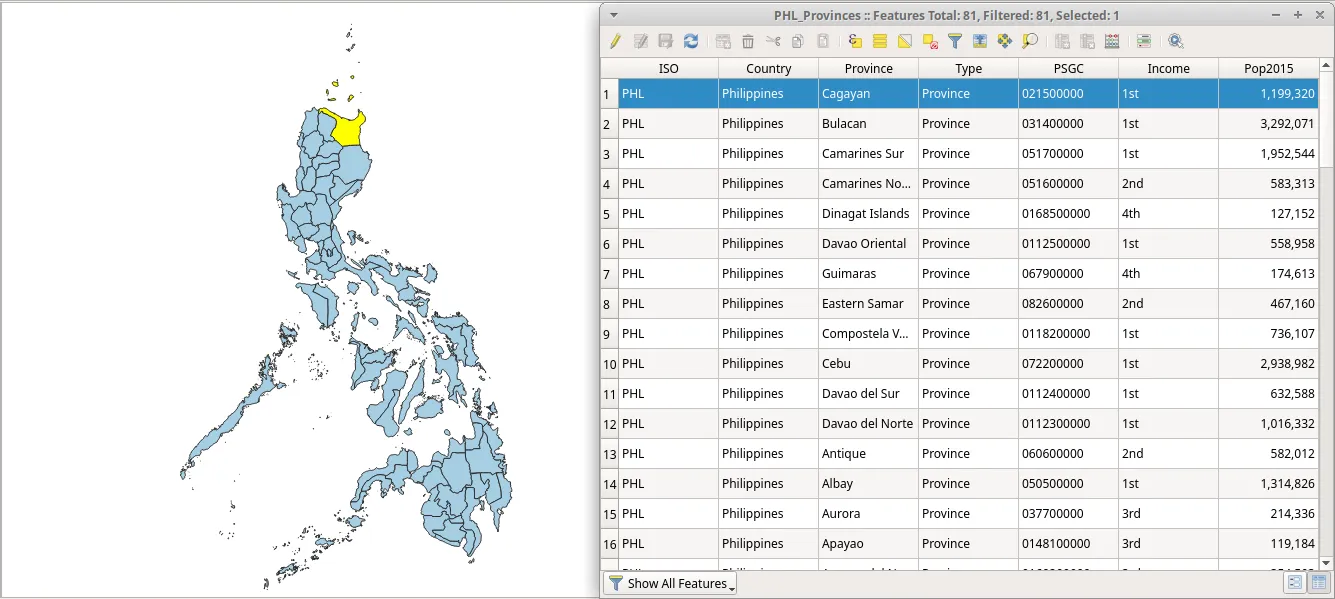
For vectors, the attribute table displays all of the attribute data for a layer. To put it simply:
- a row in the attribute table = a feature in the vector layer
- a column in the attribute table = a field or attribute of the vector layer
- a cell in the attribute table = attribute value of a specific feature in the vector layer
The attribute table also allows you to sort, filter, and edit the data as needed. It is the primary interface for working with attribute data in QGIS that provides a range of functionalities and features such as:
- View and edit attribute data: The attribute table enables users to view and edit the attribute data associated with a layer. This data could include information such as the name of a feature, its size or area, or any other attributes that are relevant to the layer.
- Sort and filter data: The attribute table allows users to sort and filter the data based on specific attributes. This can be useful when working with large datasets as it helps to identify relevant data quickly.
- Calculate fields: The attribute table also allows users to perform calculations on specific fields. This can be useful for creating new attributes or modifying existing ones.
- Join data: The attribute table can be used to join data from different sources enabling users to combine data from multiple layers and perform more complex analysis.
How about rasters (RAT or Raster Attribute Table)
Section titled “How about rasters (RAT or Raster Attribute Table)”QGIS 3.30 brought with it extensive support for Raster Attribute Tables (RATs) both through raster data providers (GDAL) and a generic value attribute table (VAT) file (.vat.dbf).
Most of the functionalties from the Python RAT plugin (see video below) were ported into QGIS. These include:
- Automatic Raster Styling
- RAT reclassification
- RAT identify
- RAT properties
- RAT editing
- RAT creation from current classification
Opening the attribute table
Section titled “Opening the attribute table”To open a layer’s attribute table, you can:
- Right-click layer ‣ Open Attribute Table,
- Open Attribute Table in the Attributes Toolbar, or
- Clicking F6 while a layer is active/selected
Once opened, the attribute table will display a list of the features in the layer along with their attribute values. From here, you can view and edit the attributes, sort the table, apply filters, and perform various analysis tasks using the toolbar located on top of the attribute table.

Editing the attribute table
Section titled “Editing the attribute table”You can edit the attribute values of a layer’s features directly in the attribute table. To do this, you must first enable editing mode on the layer:
- On the layer panel: right click on the layer ‣ Toggle Editing
- On the attribute table: Toggle editing mode (CTRL+E)
Afterwards, you can edit the attributes by:
- Manually editing the values in the individual cells
- Updating an entire row
- Using Expressions
You can also add and remove fields while editing mode is enabled.
To add a new field, click on the New Field (CTRL + W) button (![]() ) on the attribute table toolbar and provide the appropriate parameters.
) on the attribute table toolbar and provide the appropriate parameters.
To remove a field, click on the Delete Field (CTRL + L) button (![]() ) on the attribute table toolbar and select the field you want to delete.
) on the attribute table toolbar and select the field you want to delete.
Conditional formatting
Section titled “Conditional formatting”Conditional formatting is a useful tool in QGIS that allows you to highlight certain attribute values based on a set of rules. For example, you can use conditional formatting to highlight all features in a layer with a population greater than a certain value.
To apply conditional formatting, open the attribute table and click the Conditional formatting (![]() ) button.
) button.
Exercise 1.1. Getting familiar with the Attribute table
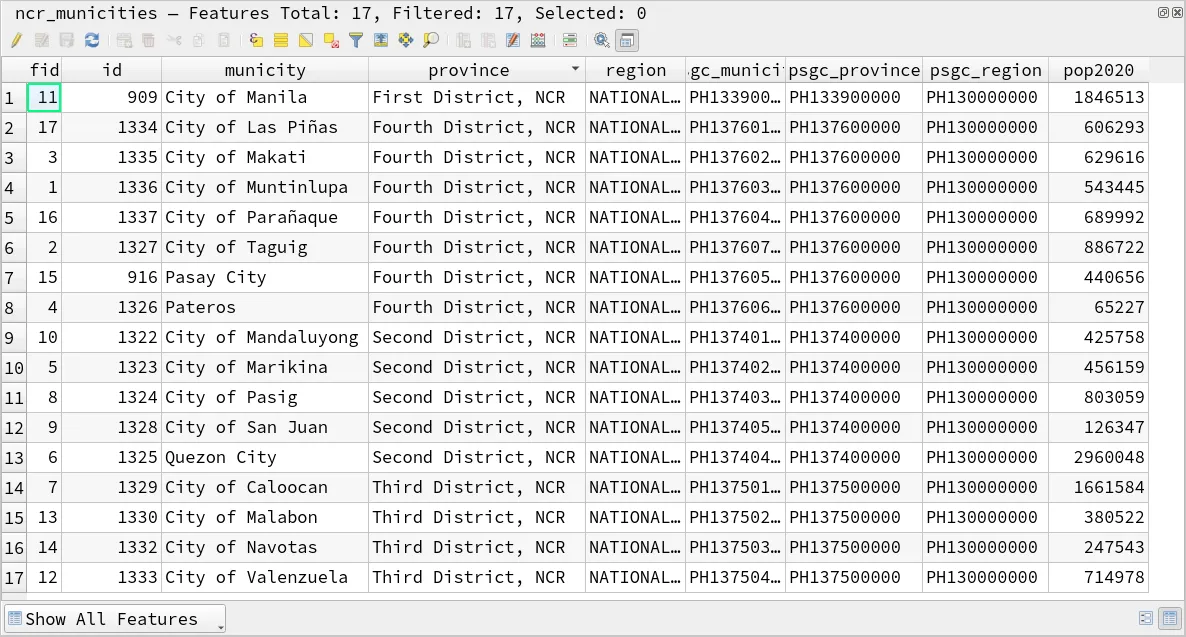
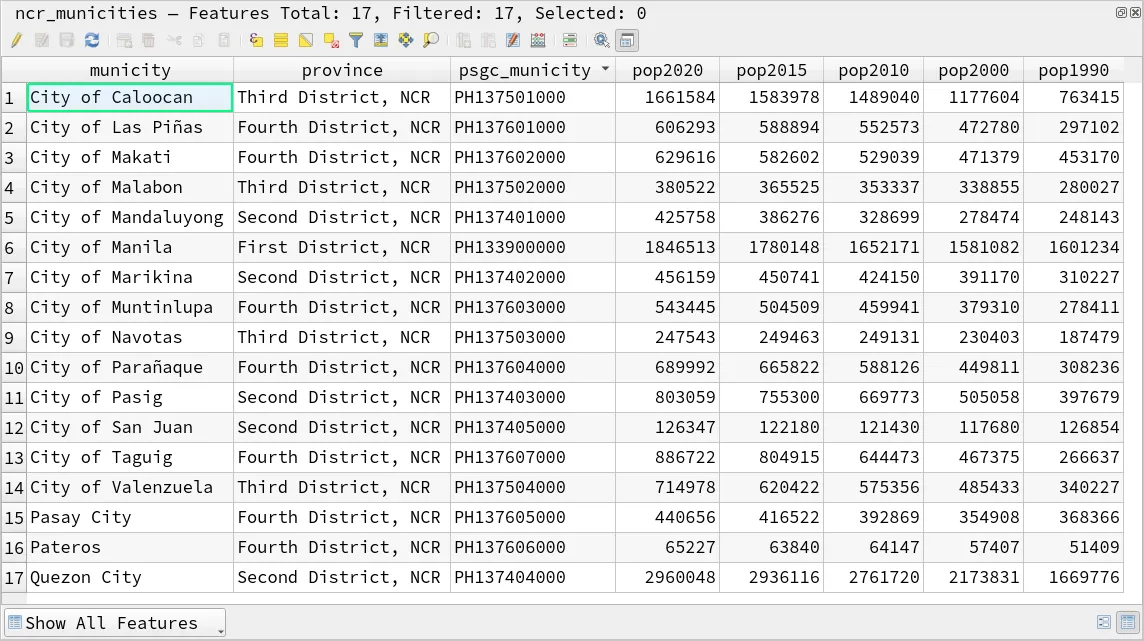
Section titled “Exercise 1.1. Getting familiar with the Attribute table”In this exercise, you will work with the attribute table of the ncr_municities layer. We will organize the table columns, add a new field for the 2015 population, and apply conditional formatting to better visualize the data.
- Load the ncr_municities layer.
- Open the attribute table of the layer.
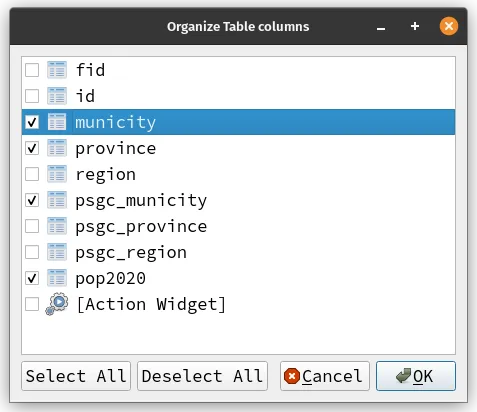
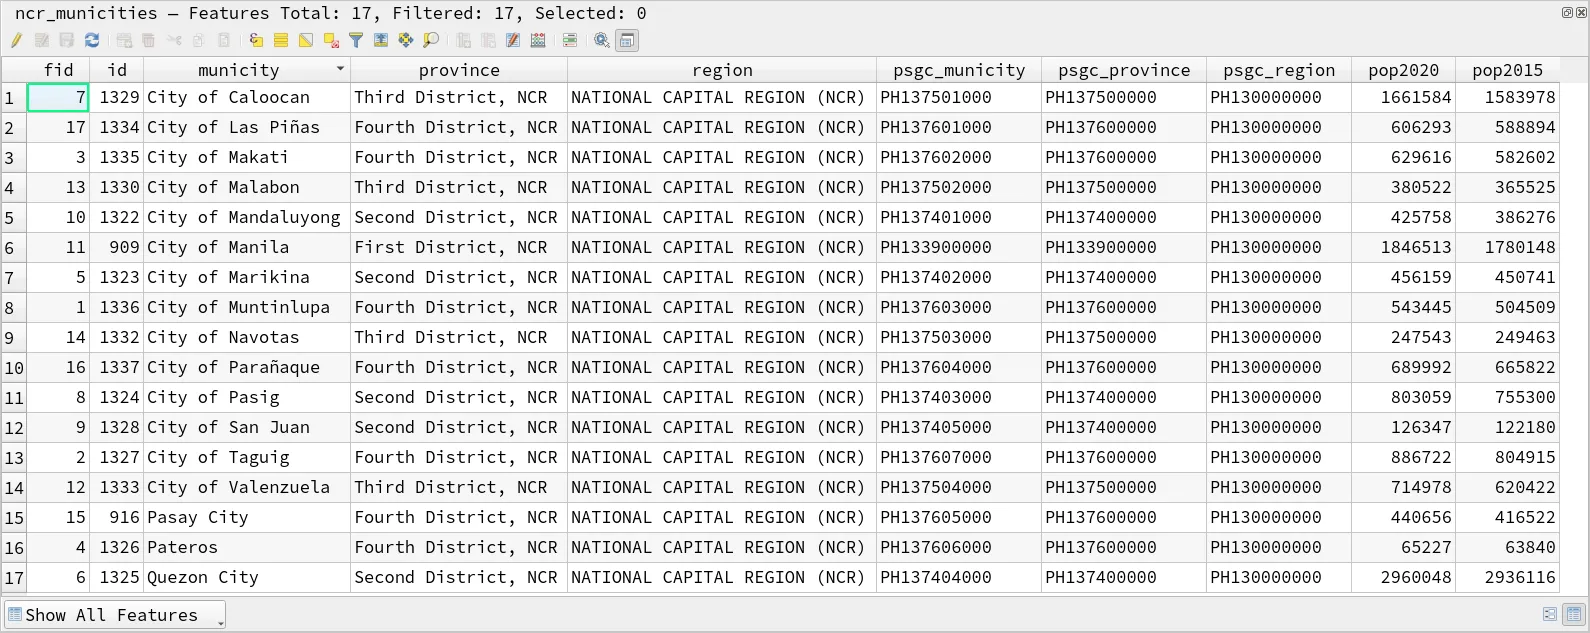
- Notice that the attribute table looks a bit cluttered. Let’s organize the table to show only the municity, province, psgc_municity, and pop2020 fields. To do this, you can click the Organize Columns button (
 ) on the attribute table or right-clicking on the header row ‣ Organize Columns…
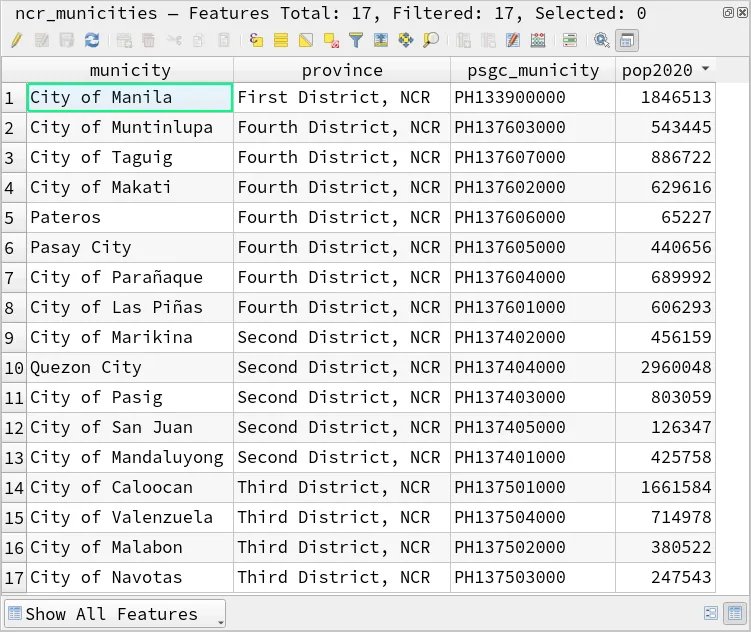
- Next, let’s add a new field to the layer for the population in each city/municipality in 2015. We can refer to the table below:
| municity | pop2015 |
|---|---|
| Caloocan City | 1583978 |
| Las Piñas City | 588894 |
| Makati City | 582602 |
| Malabon City | 365525 |
| Mandaluyong City | 386276 |
| Manila City | 1780148 |
| Marikina City | 450741 |
| Muntinlupa City | 504509 |
| Navotas City | 249463 |
| Parañaque City | 665822 |
| Pasay City | 416522 |
| Pasig City | 755300 |
| Pateros | 63840 |
| Quezon City | 2936116 |
| San Juan City | 122180 |
| Taguig City | 804915 |
| Valenzuela City | 620422 |
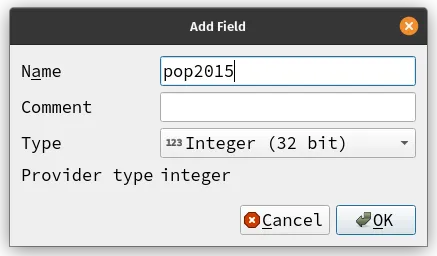
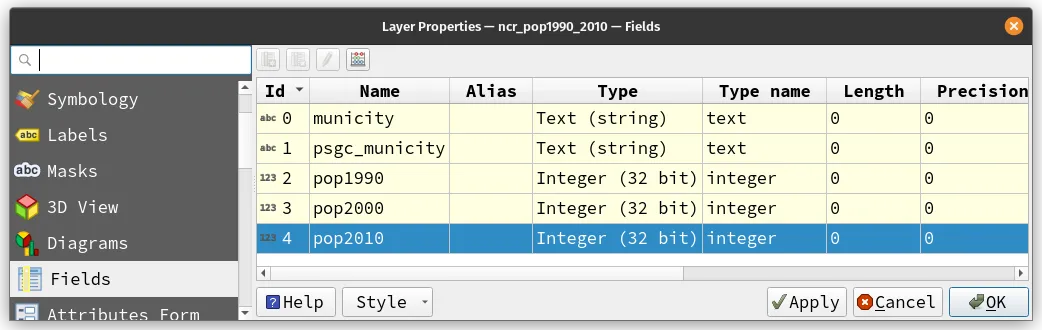
- Create a new field and name it pop2015. Your new attribute table should look like below:
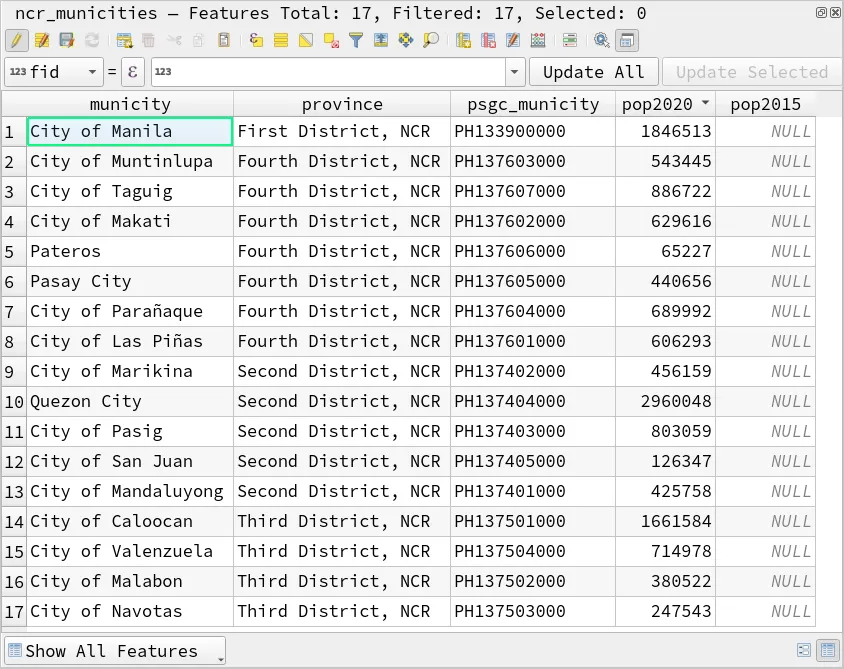
- Manually add the pop2015 values from Table 1 to your attribute table. Your new attribute layer should look like below:
- Don’t forget to save your edits!
Memory boosters and review
Section titled “Memory boosters and review”What is the attribute table?
Section titled “What is the attribute table?”A table that displays the attributes of each feature in a layer.
What is a feature?
Section titled “What is a feature?”A geographic object or entity, such as a point, line, or polygon.
What is a field/attribute?
Section titled “What is a field/attribute?”A column in the attribute table that stores attribute data for each feature.
Give one way to add a new field to an attribute table in QGIS.
Section titled “Give one way to add a new field to an attribute table in QGIS.”Right-click on the layer, select Open Attribute Table, click on the New Field button, and specify the field properties.
What are some common field data types in QGIS?
Section titled “What are some common field data types in QGIS?”Integer, String, Boolean, Date
Attribute joins
Section titled “Attribute joins”One of the most common operations in GIS is joining data from different sources based on a common attribute commonly referred to as attribute joins. Attribute joins are used in QGIS to combine the attributes of two or more data sources based on a common field. This is useful when you have data that is related to each other but stored in separate files. It is also one of the most important functions of a GIS as it allows for non-spatial data to be made spatial.
For example, you may have a vector layer of city boundaries and a CSV file of population data and you want to combine them to create a map of population density or population rate over time. You can do this by joining the attribute table of the CSV file with that of the vector layer.
There are two ways to perform attribute joins in QGIS. The first is via the Layer Properties ‣ Joins and the second is via the Join attributes by field value processing algorithm. The first one can be considered a soft join since it temporarily adds fields from the join table to the target table which can be removed/unjoined any time. The second option can be considered a hard join since it creates a new table from the joined attribute tables.
There are other join processing algorithms such as Join attributes by nearest, Join attributes by location, and Join attributes by location (summary) but these perform joins using spatial relationships instead of comparing attributes. These join algorithms are discussed further in Spatial relationships and queries.
Exercise 1.2. Using attribute joins
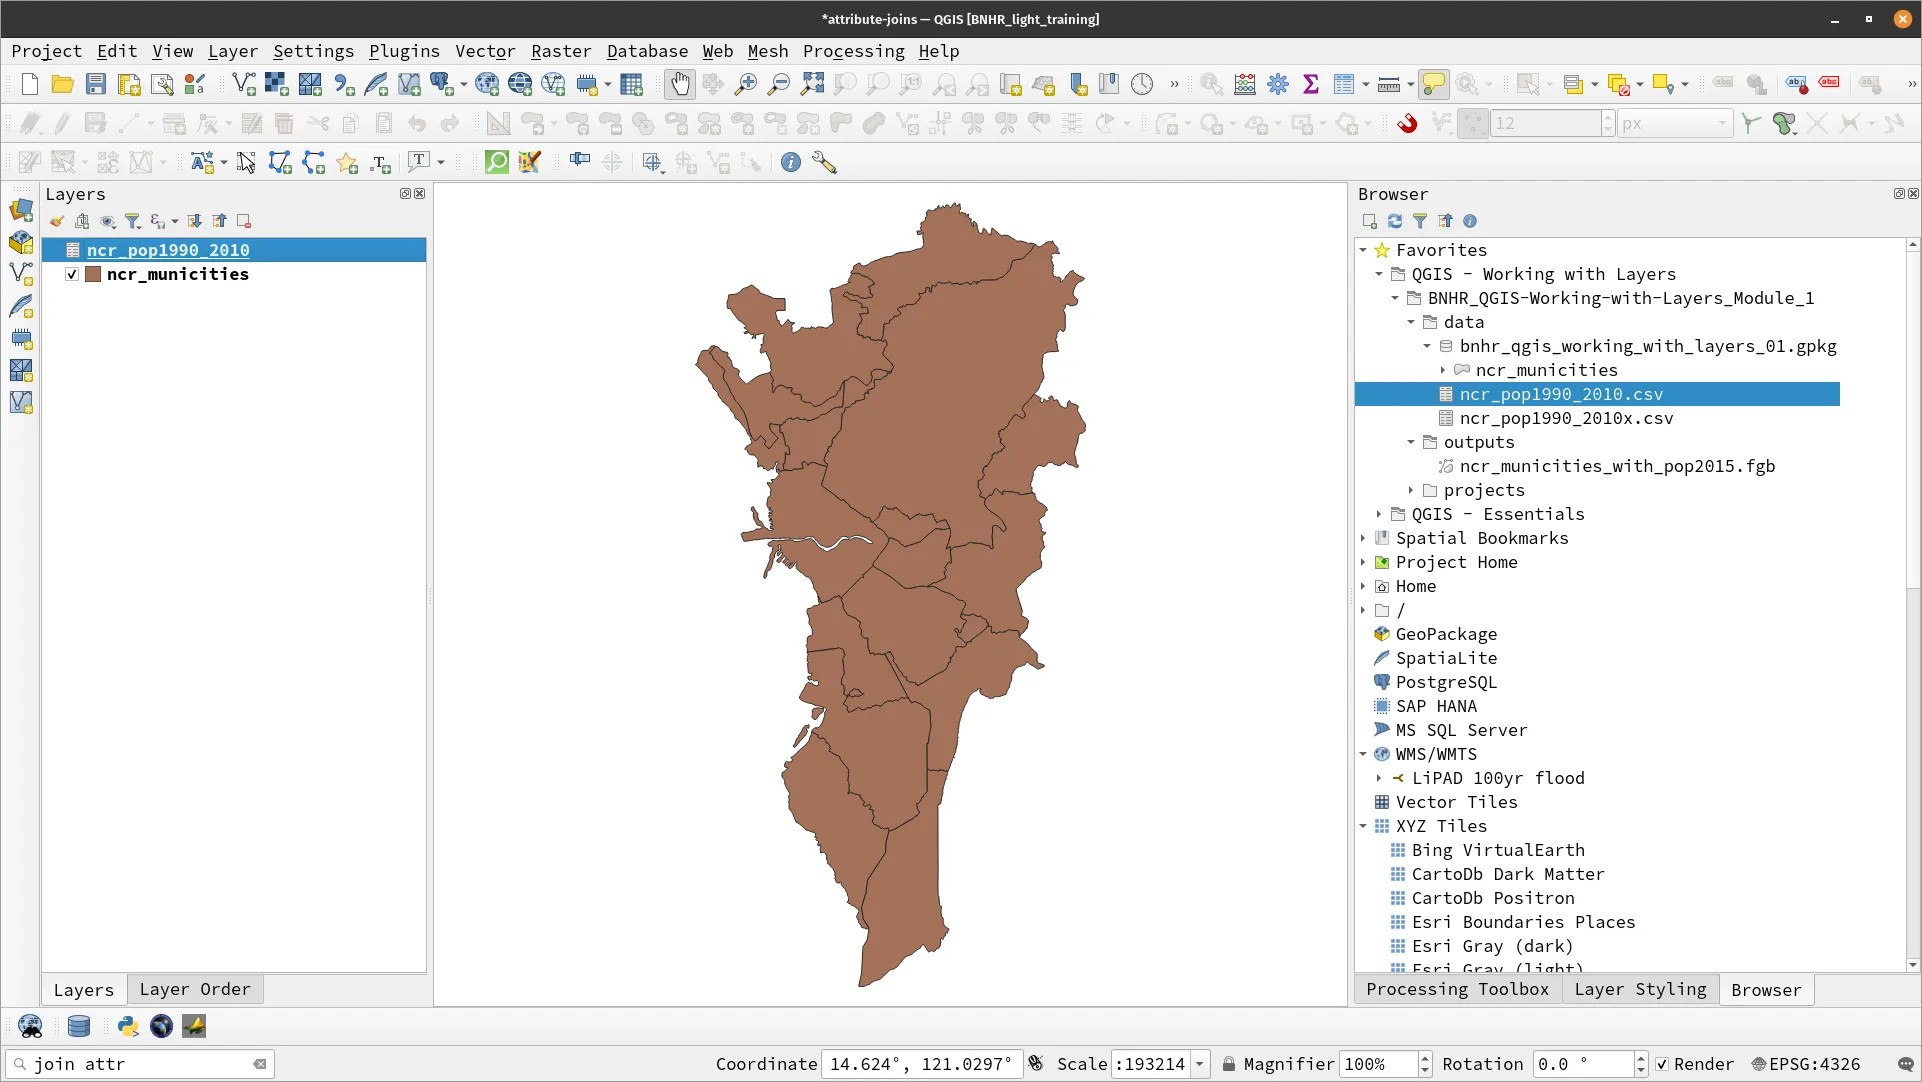
Section titled “Exercise 1.2. Using attribute joins”In this exercise, you will practice using attribute joins in QGIS. We will load the ncr_municities layer and ncr_pop1990_2010 CSV. Then, we will join the two datasets using a common field and explore the different types of joins available. Finally, we will verify the results of the join and check for any missing data or errors.
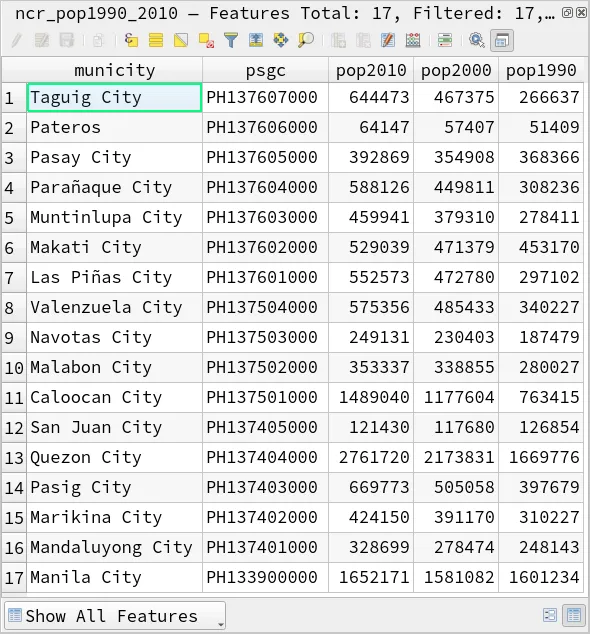
- Load the ncr_municities layer and ncr_pop1990_2010 CSV in QGIS. Make sure that you load the the CSV properly (via the Add Delimited Text option in the Data Source Manager) and that the population fields are all Integer types.
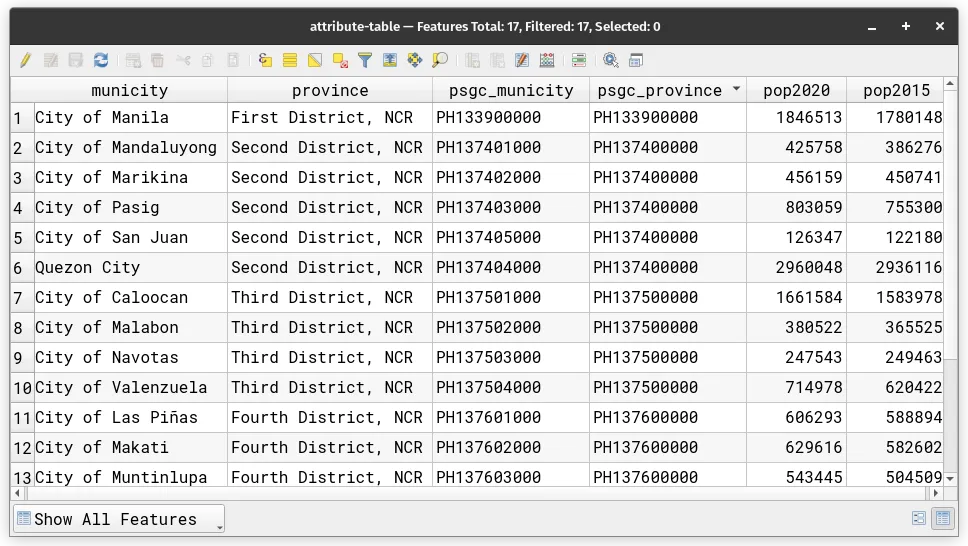
- Open the attribute table of the two layers and study them. What is/are common field/fields between the two? What can we use to join their attribute tables?
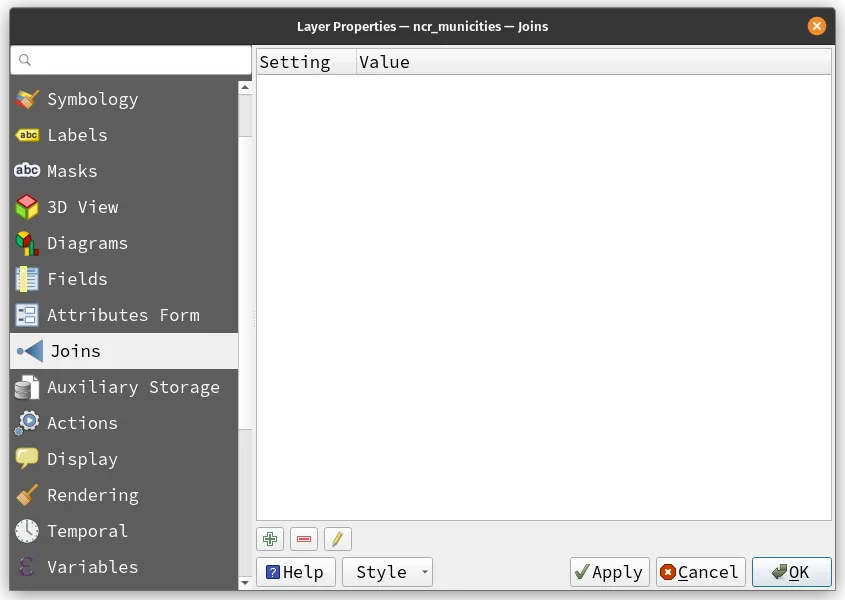
- Apply a soft join by going the the Layer Properties ‣ Joins tab of the ncr_municities layer. Click the green plus button (
 ) to add and join the ncr_pop1990_2010 layer.
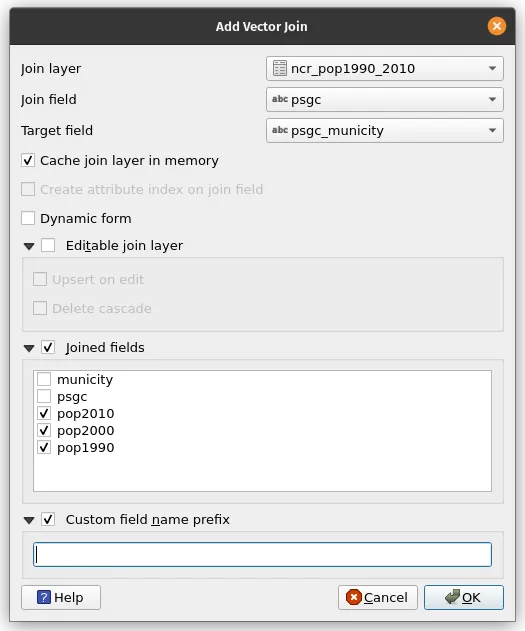
-
Click OK on the Add Vector Join dialog and OK again on the Joins tab.
-
Open the attribute table of the ncr_municities layer.
-
Remove the soft join.
-
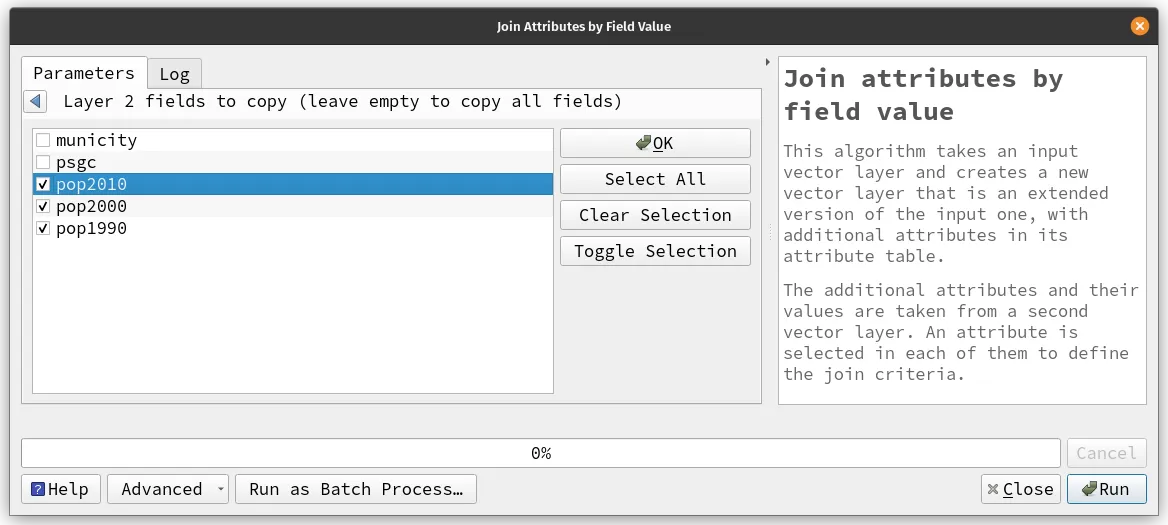
Perform a hard join by using the Join attributes by Field Value algorithm with the parameters below.
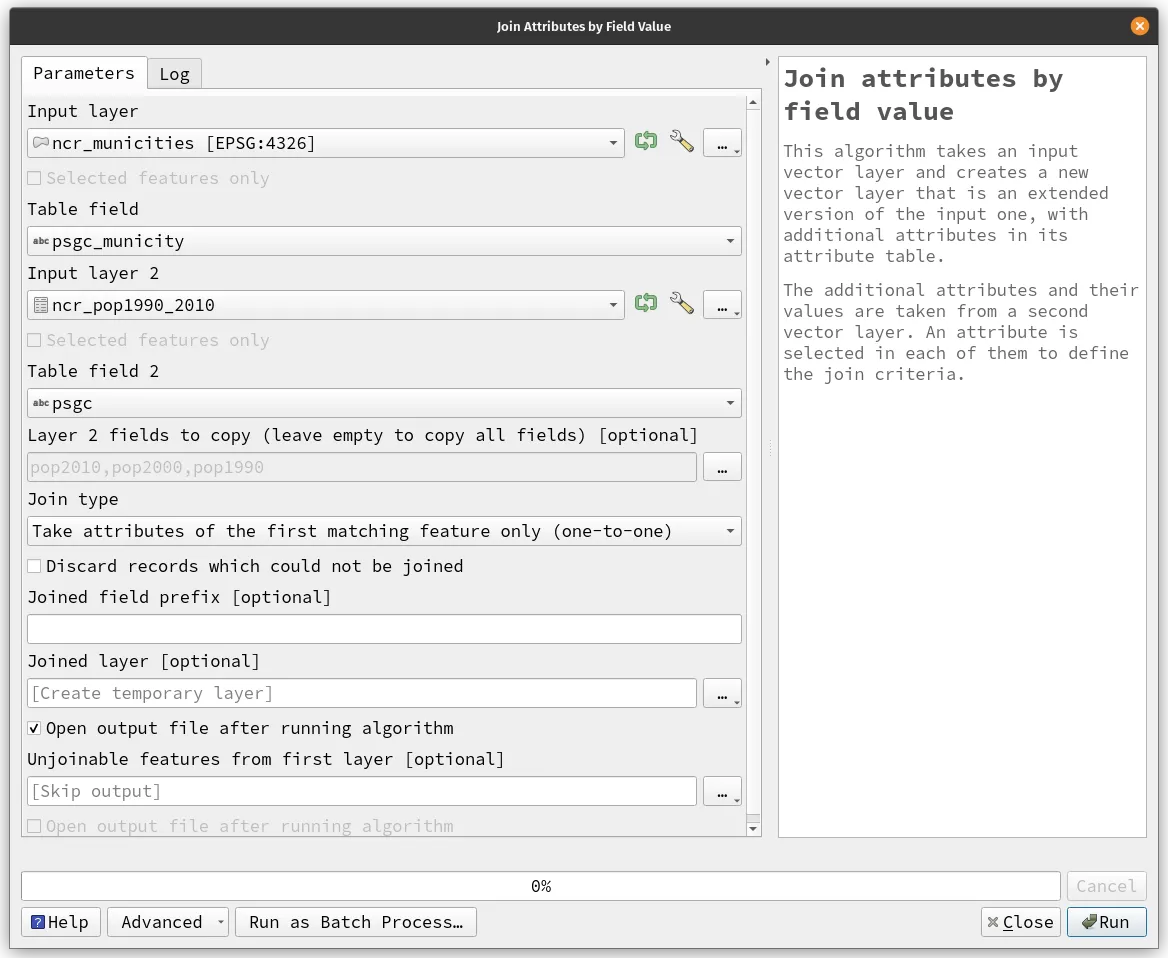
- What happened? What’s the difference between the soft join and hard join we did?
- Save one of the joined layers with all the population data and name it ncr_municities_pop.
Memory boosters and review
Section titled “Memory boosters and review”What is an attribute join?
Section titled “What is an attribute join?”A method of adding the attributes of one layer to another based on a common field.
What is the difference between using Layer Properties (soft) and using processing algorithms (hard) to do a join?
Section titled “What is the difference between using Layer Properties (soft) and using processing algorithms (hard) to do a join?”Using Layer Properties to do a join is a soft method that creates a virtual join, meaning that the join is only temporary and is not saved as a new layer. Using processing algorithms to do a join is a hard method that creates a new layer with the attributes permanently joined.
What are the steps to perform a (soft) join in QGIS
Section titled “What are the steps to perform a (soft) join in QGIS”Open the Layer Properties dialog box for the layer you want to join to, select the Joins tab, and add the join by selecting the Join Layer, Join Field, and Target Field.
What’s required for two attribute tables to be joined in QGIS?
Section titled “What’s required for two attribute tables to be joined in QGIS?”Two attribute tables must have a common field to be joined in QGIS.
Can you join more than two datasets using attribute joins in QGIS?
Section titled “Can you join more than two datasets using attribute joins in QGIS?”Yes. You just need to perform multiple joins by joining one dataset to the result of the previous join or adding multiple joined layers in the Layer properties.
The Field Calculator
Section titled “The Field Calculator”Sometimes, the attribute you want to observe is not explicitly part of the attribute table but could be calculated using existing values. For these purposes, QGIS has a powerful Field Calculator that allows you to perform calculations on fields in a layer. You can use it to create new fields, update existing fields, or calculate values based on existing fields. The kinds of operations you can run in the field calculator range from basic mathematical operations such as as addition, subtraction, multiplication, and division; boolean and conditional operations such as ifs and comparisons; as well as more complex calculations using the built-in functions and operators of the QGIS expression engine.
Accessing the Field Calculator
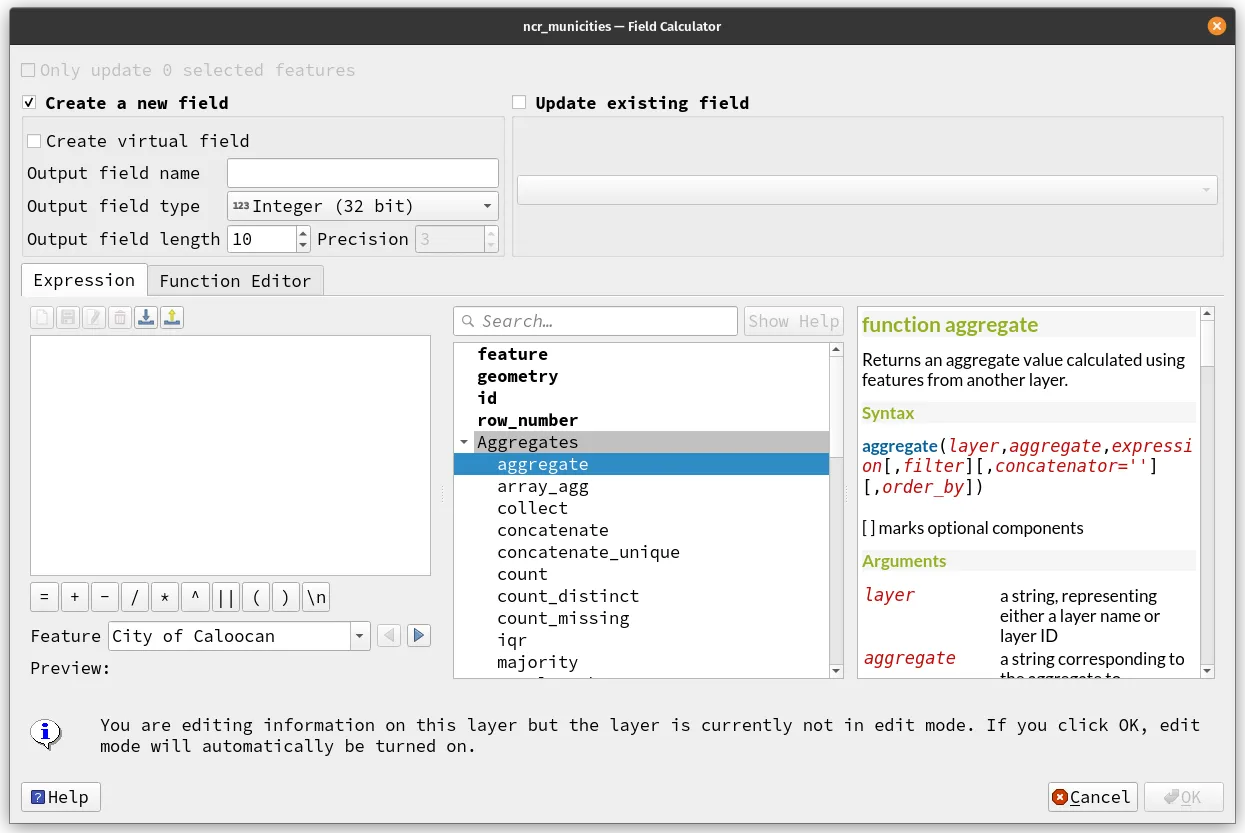
Section titled “Accessing the Field Calculator”The Field calculator can be accessed by clicking the Open Field Calculator button (![]() ) in the Attributes Toolbar or in the attribute table itself. This will open the Field Calculator dialog where you can input the parameters of the field you want to calculate, the expression or formula you want to use, and even be able to preview the results. You also have the option to use the Field Calculator to update and existing field.
) in the Attributes Toolbar or in the attribute table itself. This will open the Field Calculator dialog where you can input the parameters of the field you want to calculate, the expression or formula you want to use, and even be able to preview the results. You also have the option to use the Field Calculator to update and existing field.
Exercise 1.3. Creating new fields using the Field Calculator
Section titled “Exercise 1.3. Creating new fields using the Field Calculator”- Open the attribute table of the ncr_municities_pop layer that you created in the last exercise. Feel free to organize the columns to make it less cluttered.
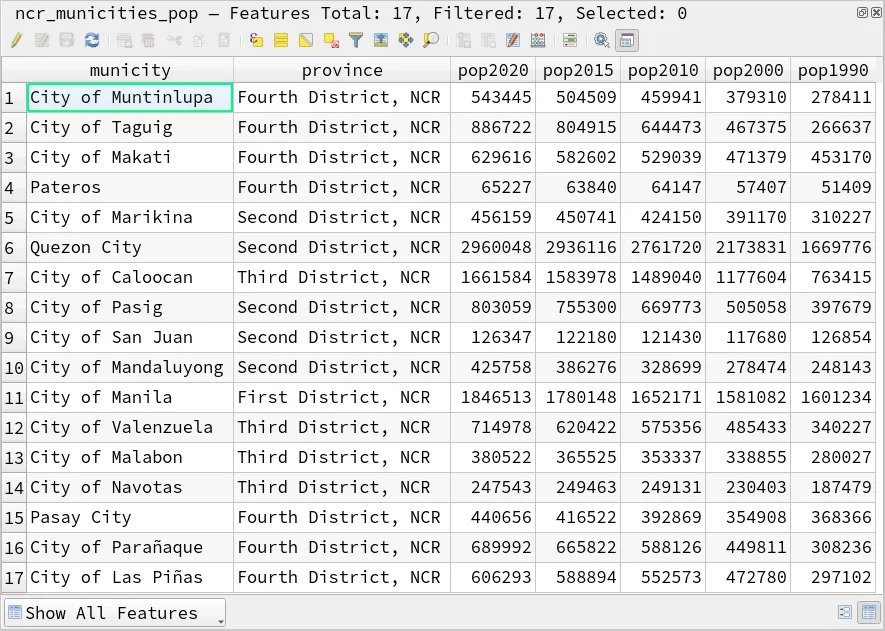
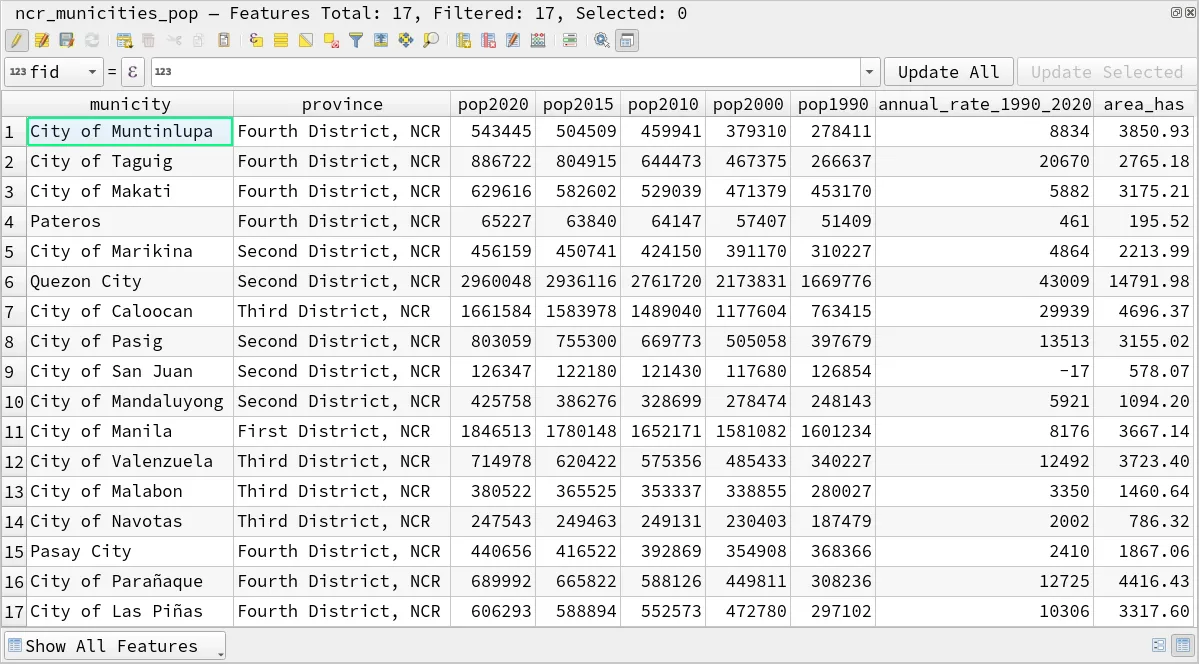
- We will be computing for the annual average rate of population change from 1990 to 2020 and adding it to a new field called annual_rate_1990_2020. The formula we will be using is:
(pop2020 - pop1990)/(2020 - 1990)
- Open the Field Calculator by clicking the Open field calculator (CTRL + I) button (
 ) and add the following parameters.
- Check Create new field
- Output field name:
annual_rate_1990_2020 - Output field type: Integer (32 bit)
- On the Expression tab:
(pop2020 - pop1990)/(2020 - 1990)
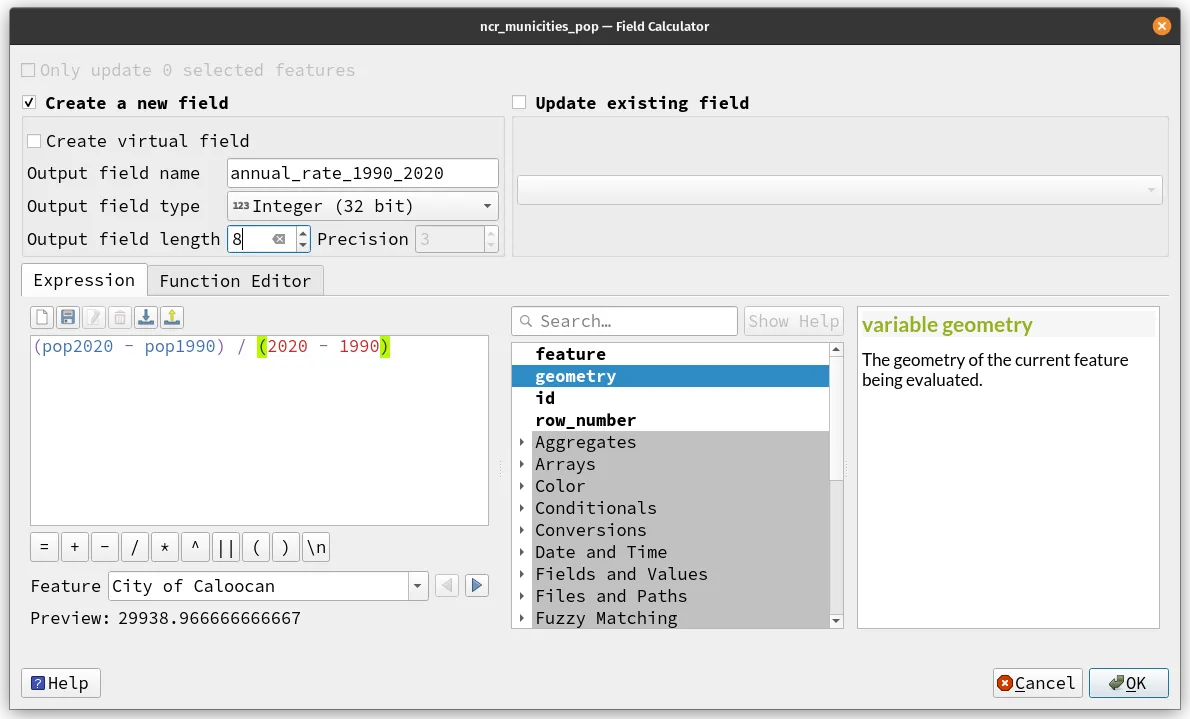
- Click OK
- Look at the attribute table of the layer, what do you notice?
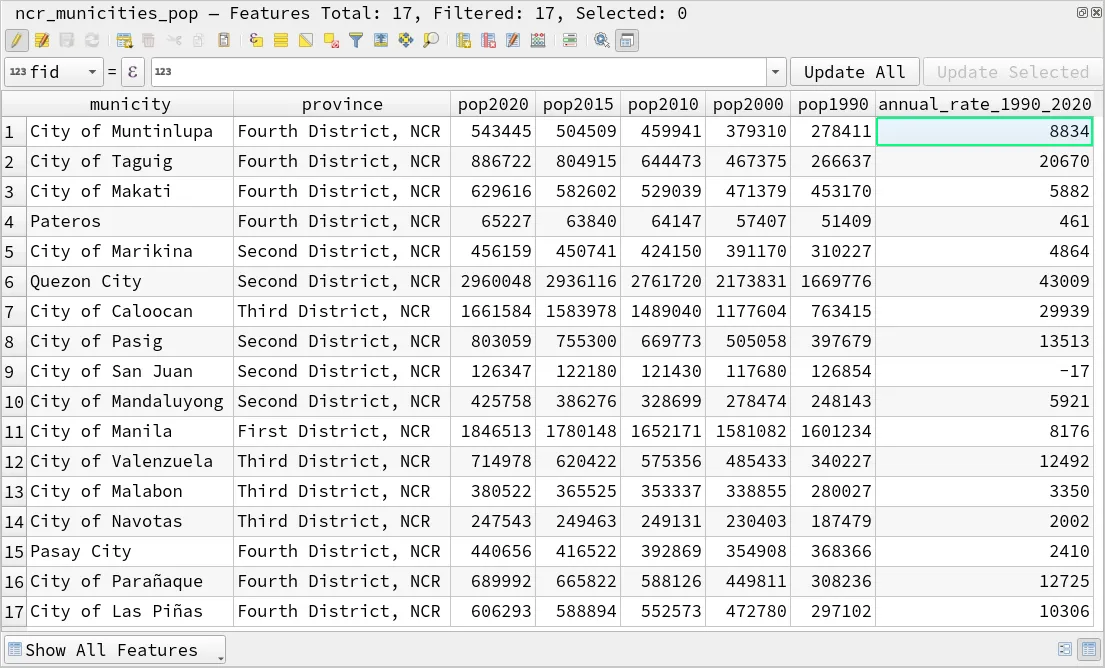
- Don’t forget to save your edits!
- Aside from numerical computations, there are built-in expressions and formulas that allow us to compute values based on feature geometry. For example, we can compute for the area of the city/municipality features by using the expression
$area. - Open the attribute table again and input the following parameters.
- Check Create new field
- Output field name:
area_has - Output field type: Decimal number (real)
- Output field length: 10
- Precision: 2
- On the Expression tab:
$area/10000
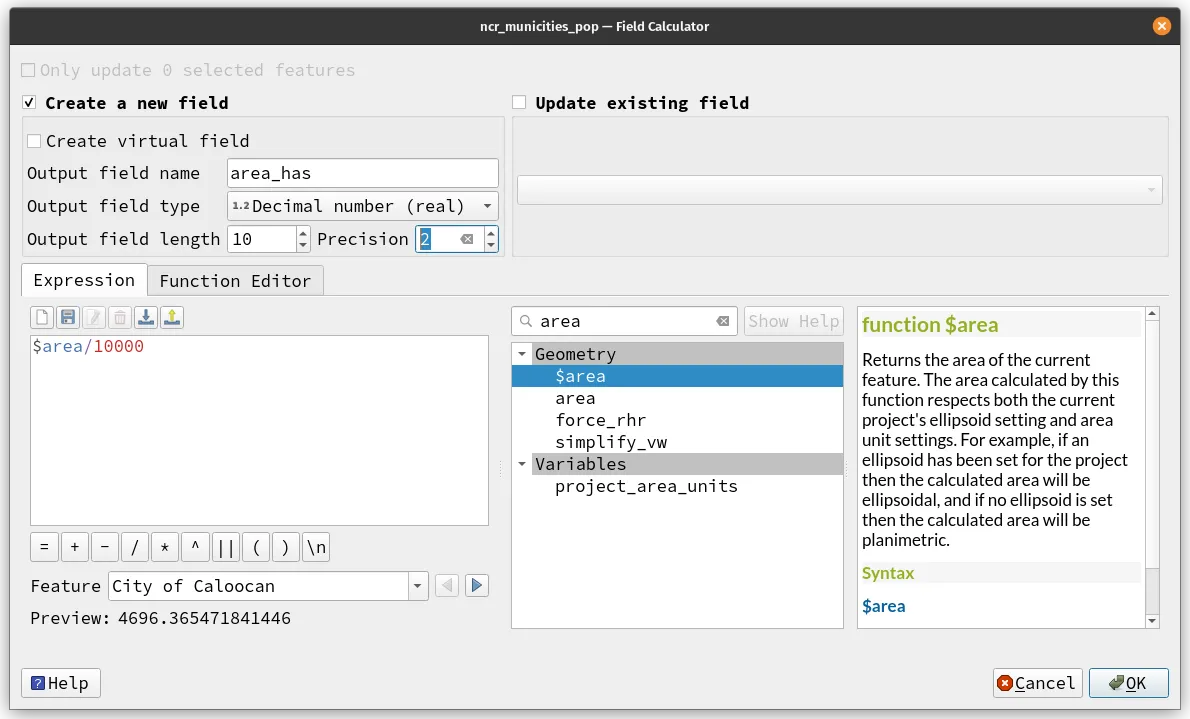
- Click OK and look at the attribute table.
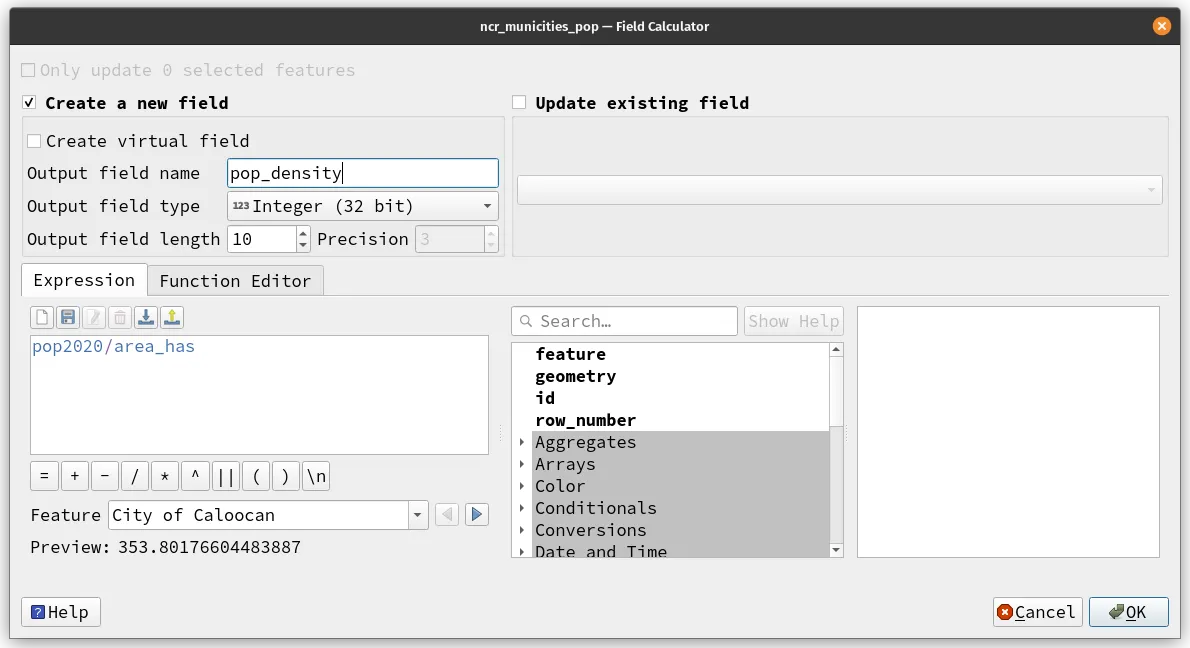
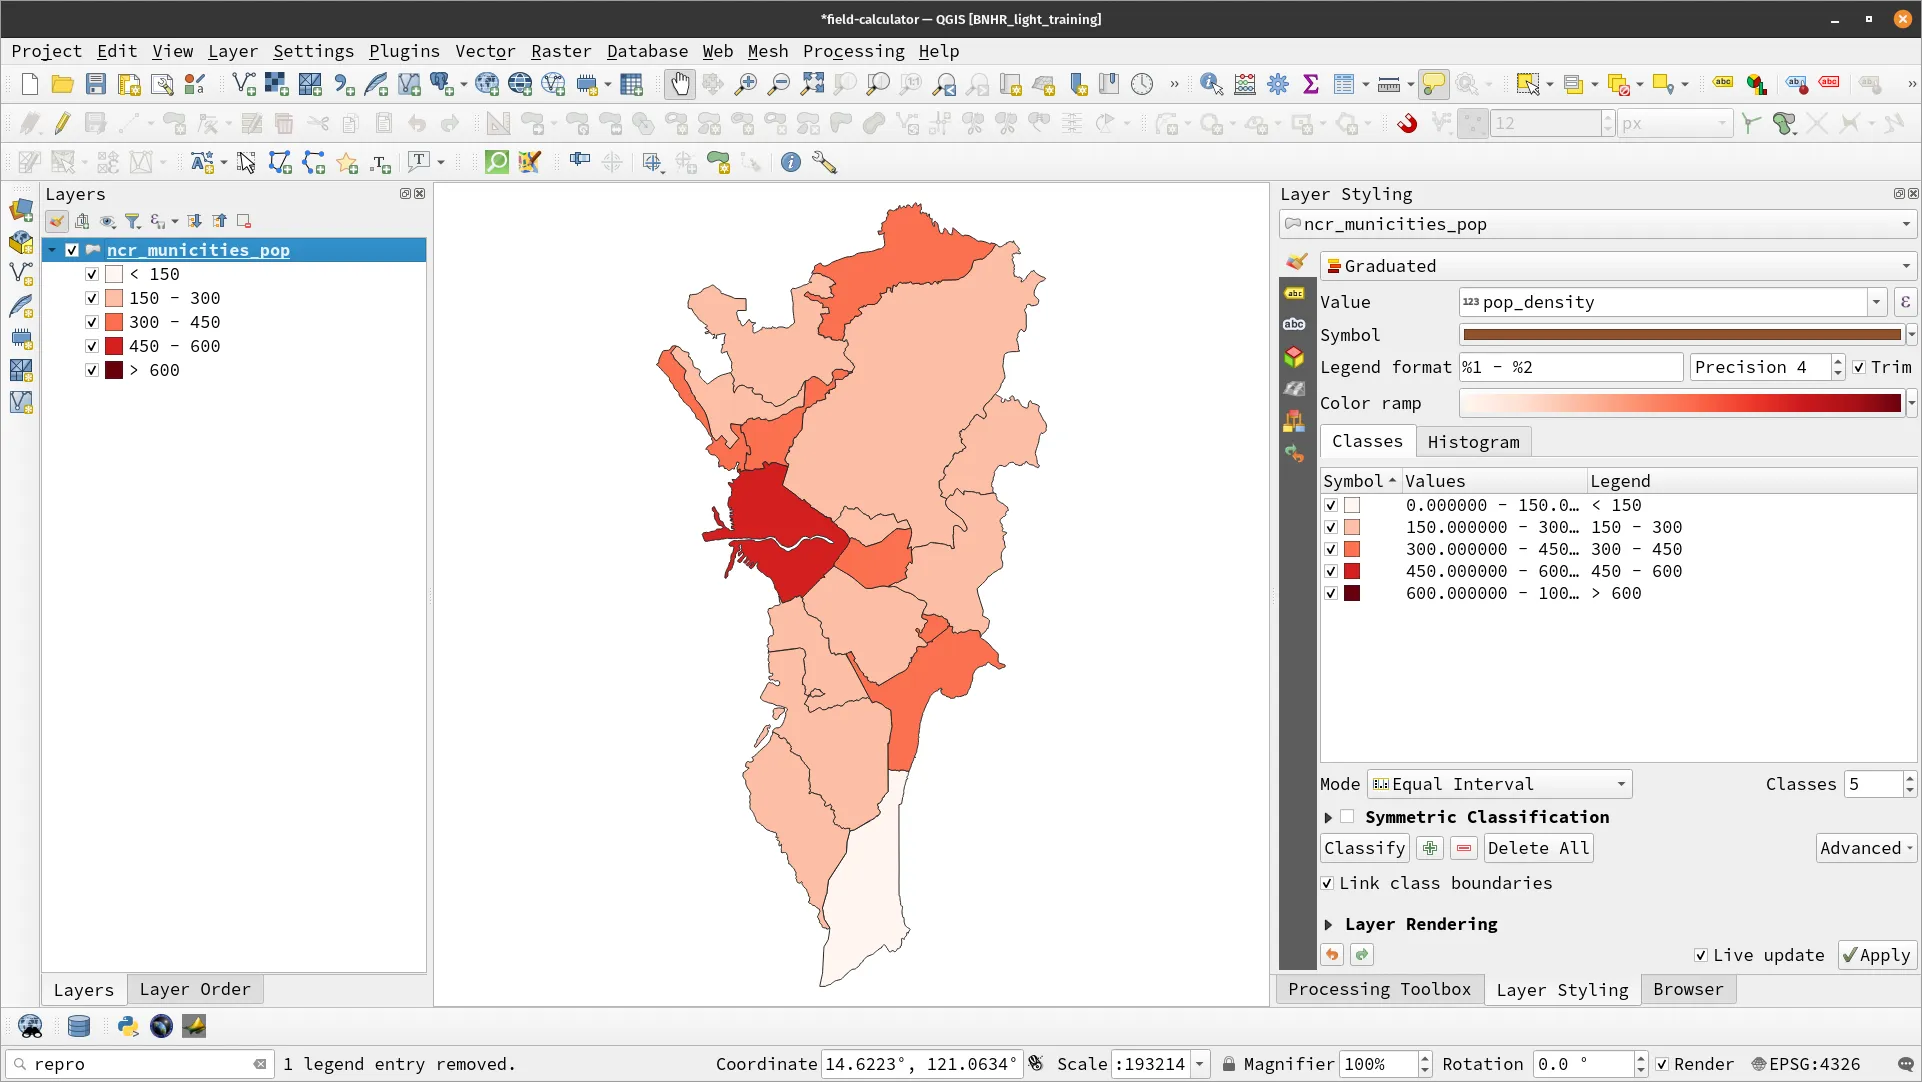
- Next, let’s compute for the population density of each city/municipality using a simple formula of population in 2020 / area in hectares. In expression form, this is:
pop2020/($area/10000)or we can use the field that we computedpop2020/area_has. Open the Field Calculator and create a new field named pop_density.- Check Create new field
- Output field name:
pop_density - Output field type: Integer (32 bit)
- On the Expression tab:
pop2020/area_has
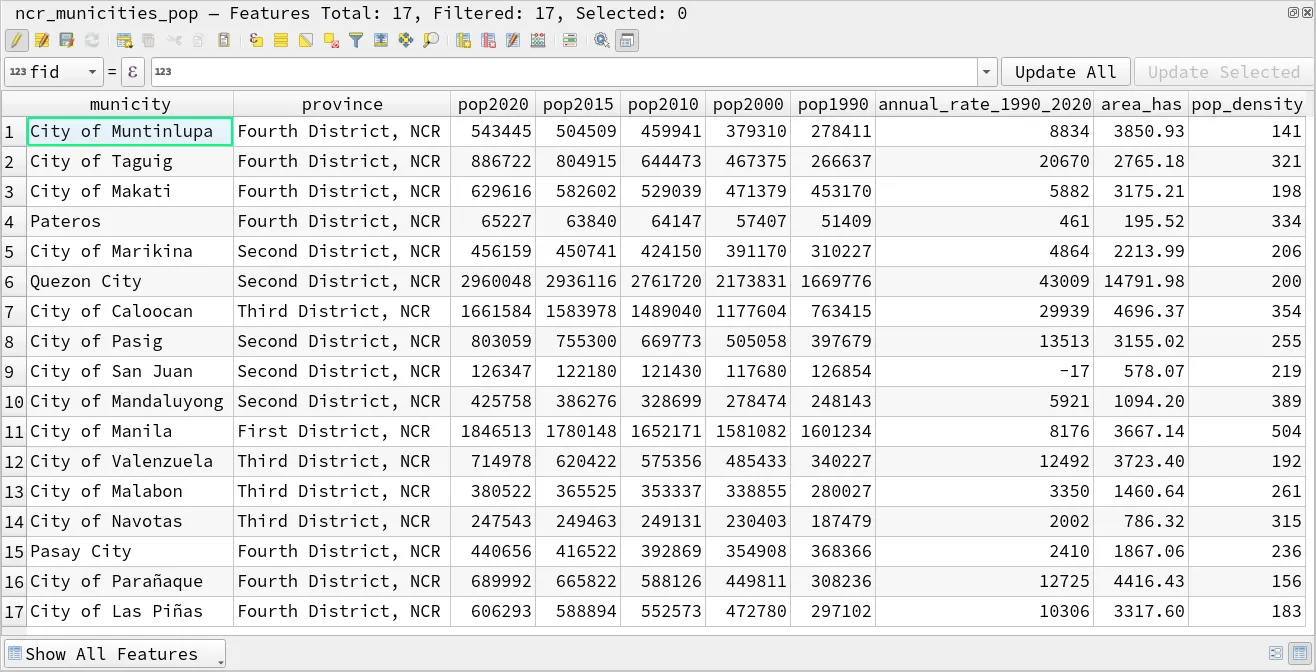
- You can use the fields you created using the Field Calculator to analyze or visualize your data.
Memory boosters and review
Section titled “Memory boosters and review”What is the Field Calculator?
Section titled “What is the Field Calculator?”A tool for calculating attribute values based on an expression.
What are examples of the types of expressions that can be used in the Field Calculator?
Section titled “What are examples of the types of expressions that can be used in the Field Calculator?”Mathematical, String, Date and Time, and Conditional expressions.
How can you access the Field Calculator in QGIS?
Section titled “How can you access the Field Calculator in QGIS?”By clicking the Field Calculator (![]() ) button in the Attributes toolbar while a vector layer is active or by clicking the same button in the attribute table itself.
) button in the Attributes toolbar while a vector layer is active or by clicking the same button in the attribute table itself.
What is the difference between an Update and a Create expression in the Field Calculator?
Section titled “What is the difference between an Update and a Create expression in the Field Calculator?”An Update expression modifies existing values in a field, while a Create expression creates a new field and populates it with calculated values.
Can you undo changes made by the Field Calculator in QGIS?
Section titled “Can you undo changes made by the Field Calculator in QGIS?”Yes, by using the Undo/Redo buttons in the attribute table but make sure that you haven’t saved your changes and closed the attribute table yet.
Selects and Filters by attribute
Section titled “Selects and Filters by attribute”There will be times when you will encounter a huge dataset but only a small part of it is useful for you. This is where the ability to select or filter data in QGIS becomes important. This enables you to optimize your workflow by allowing you to work only with the relevant data you need thus saving time, energy, and resources.
Select and filter expressions in QGIS work similarly but they have distinct differences.
A select does not modify the features shown by the layer but merely selects or highlights the features that meet the specified criteria. By default, running algorithms on a layer with some selected features would still result in having the algorithm go over all of the layer’s features. However, QGIS provides the option Run on selected features only in most of its processing algorithms in case you only want to run your algorithm in the subset you selected. This is also true in exporting a layer with selected features. QGIS provides the option to Save Selected Features Only…
A filter will temporarily disable or hide features that do not meet its specified criteria. This means that when running a processing algorithm, a layer with filtered features will only use the filtered features (subset) compared to a layer with selected features which will use all the features by default. This is also the case when exporting a filtered layer: only the filtered features are exported.
Performing selections
Section titled “Performing selections”There are several methods to perform a selection in QGIS. You can select features by polygon, freehand, or radius; or select features by their attribute values, expressions, and location.
Selecting features can be done on the attribute table, map canvas, or using the Selection toolbar. When making a selection, QGIS also offers options such as selecting all features, inverting the selection, or deselecting features.
You can find the different selection modes in the attribute table or the Selection Toolbar.
![]()
Applying filters
Section titled “Applying filters”Filtering data in QGIS is also straightforward. Users can right-click on a layer and choose Filter to use the Query Builder.
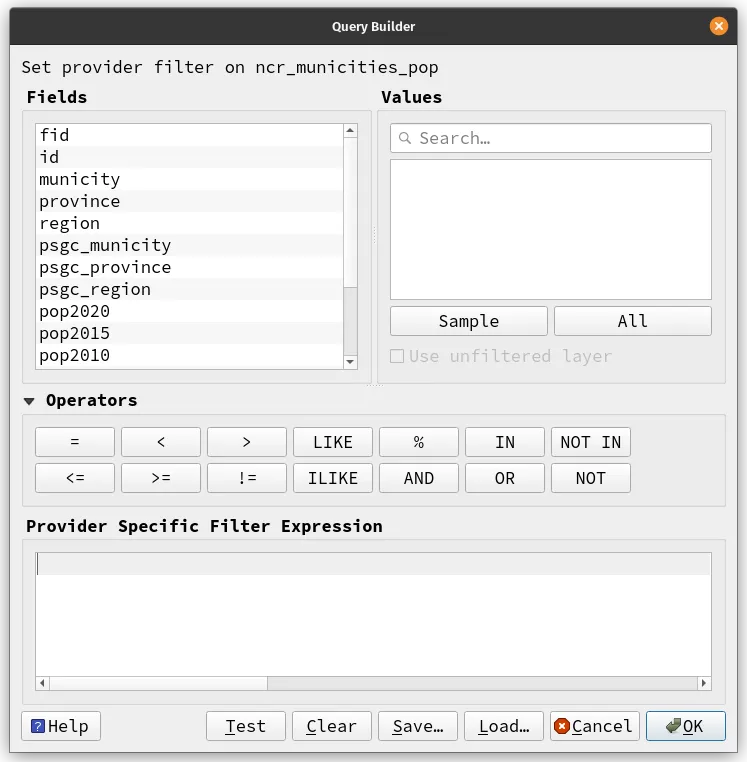
The Query Builder utilizes the QGIS Expression Engine, allowing users to create complex queries that filter out irrelevant data. Filtering is an excellent way to work with only the data that is relevant to the task at hand.
When working with data in QGIS, selecting and filtering data are essential tools that can make working with large datasets more manageable. They can help you analyze data more effectively and save time when running processing algorithms. By using the selection and filter options in QGIS, you can focus on the data that matters and accomplish your tasks with greater efficiency.
Exercise 1.4. Performing selections and applying filters
Section titled “Exercise 1.4. Performing selections and applying filters”In this exercise, you will learn how to use the selection and filter tools in QGIS to extract specific data from a layer. You will use attribute-based selection and filtering to select features based on population, population rate, and population density criteria.
- Load the layer you created from the last exercise. It should have the fields for the population in 2020, annual average population change, and population density.
- You will select the features with population in 2020 greater than 500,000 and you will utilize two modes:
- Select Features by Value (F3)
- Select Features by Expression (CTRL + F3)
- Open the Select Features by Value dialog by clicking the appropriate button (
 ) on the attribute table of the layer. Alternatively, you can go to Select Features by Value in the Selection Toolbar.
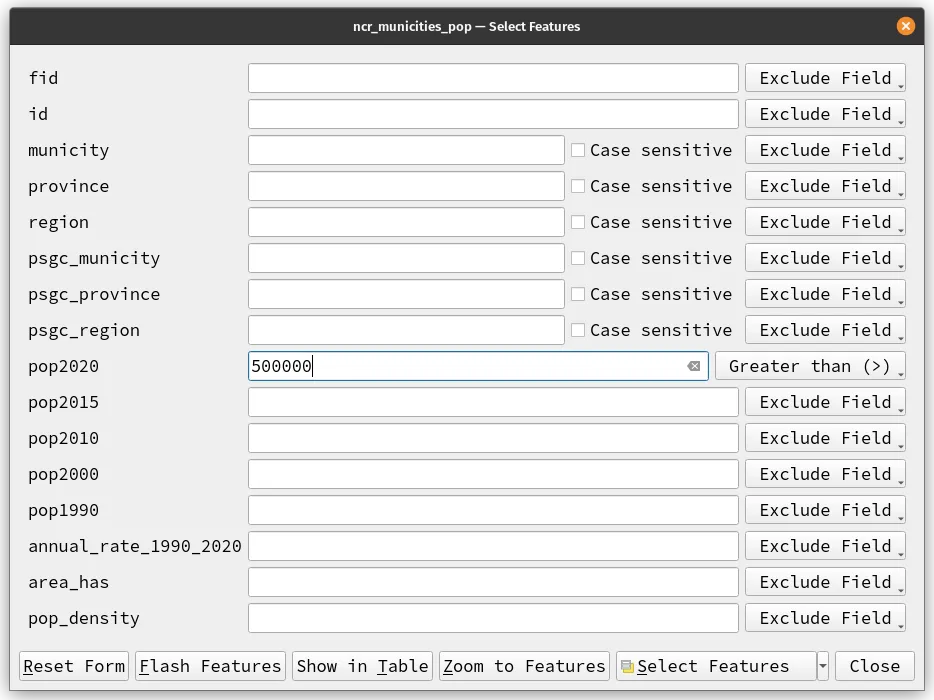
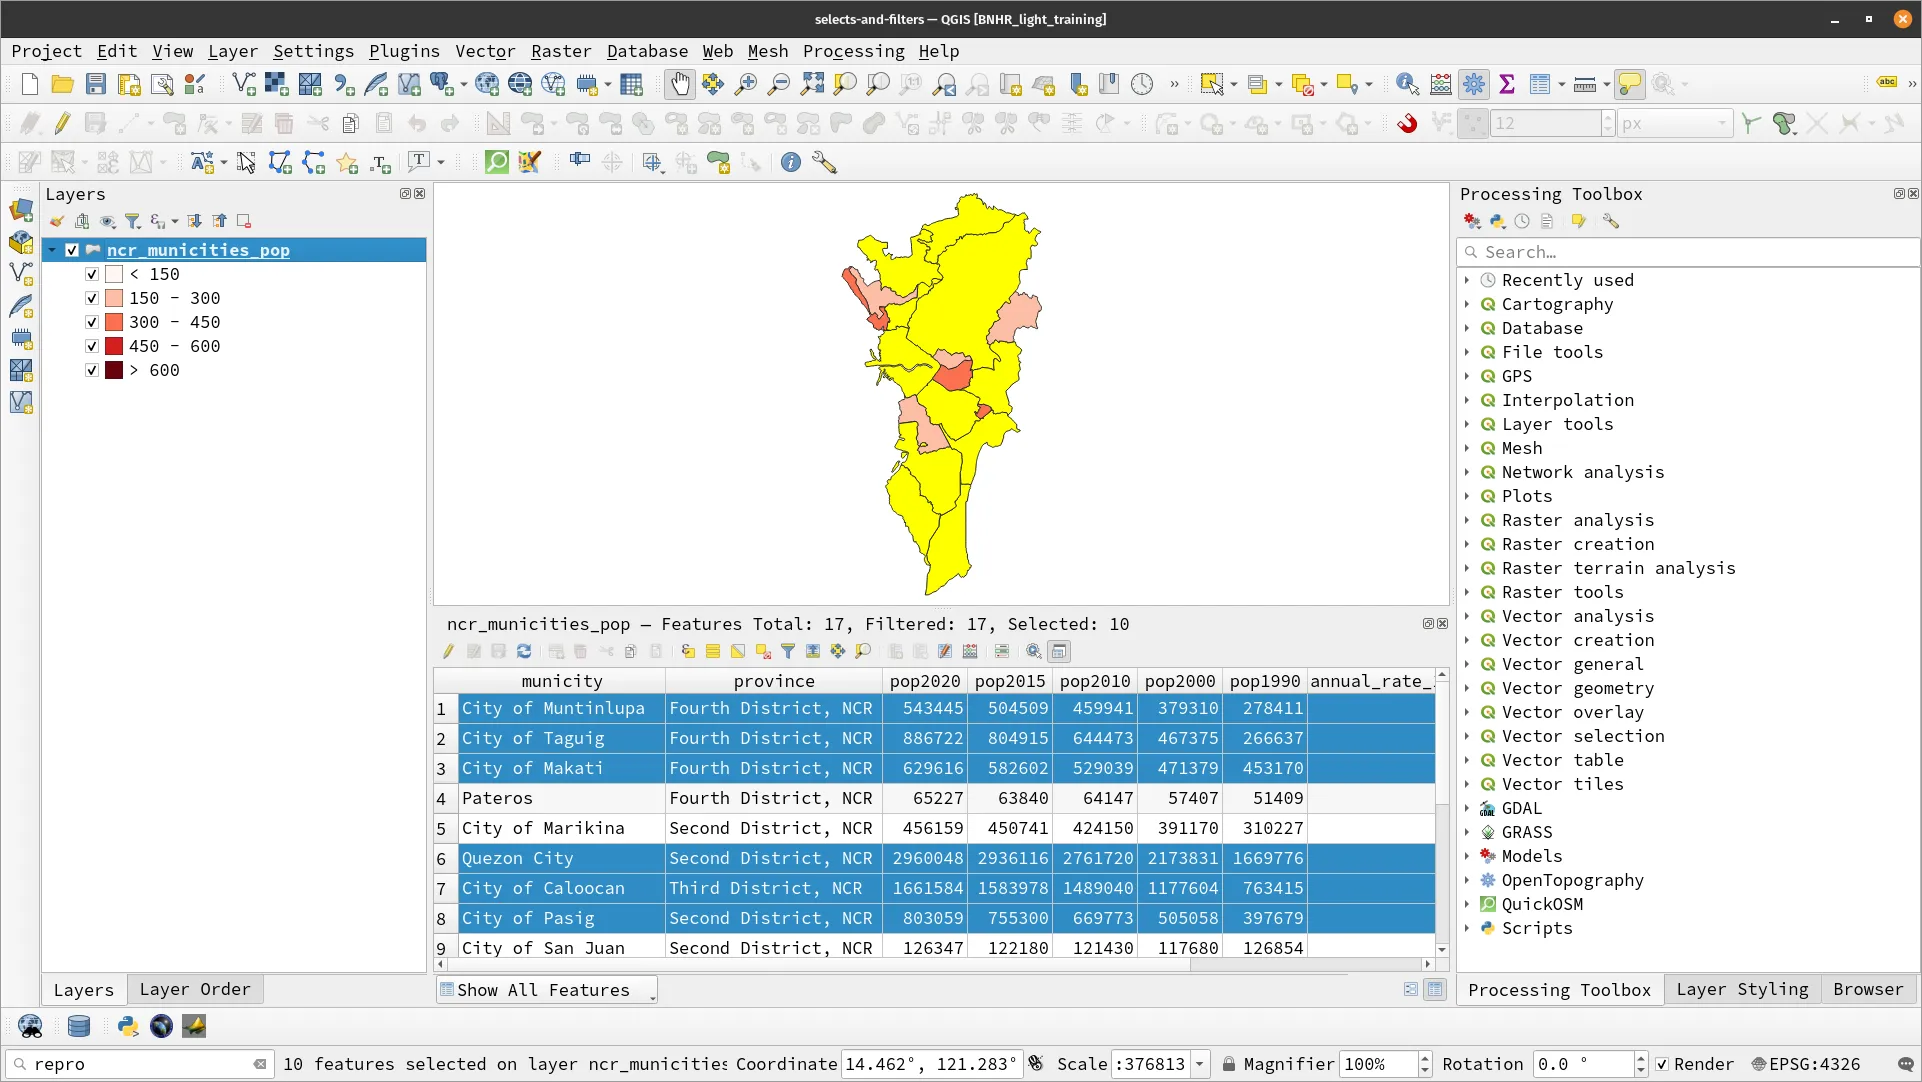
- You should see the features that meet the selection criteria highlighted in the map canvas and in the attribute table.
-
Deselect the features by clicking the Deselect all (CTRL + SHIFT + A) button (
 ) in the attribute table or in the Selection Toolbar.
 -
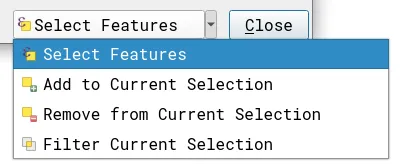
You’ll perform the same selection using an Expression. Open the Select Features by Expression dialog by clicking the appropriate button (
 ) on the attribute table of the layer. Alternatively, you can go to Select Features by Expression in the Selection Toolbar. A Query Builder dialog will appear. Input the expression:
pop2020 > 500000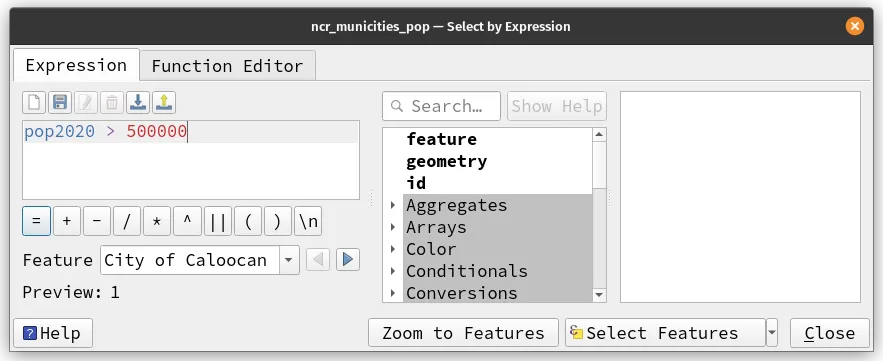
- Click Select Features. What happened? Were the same features selected?
- Deselect all the features again.
-
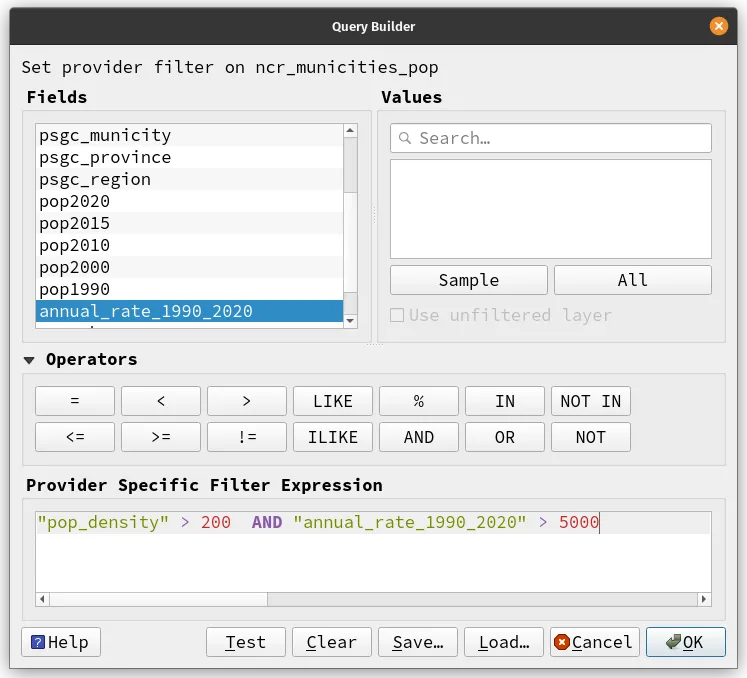
This time, you will apply a filter to the layer. For example, you want to find the cities or municipality in NCR with population density greater 200 and annual rate of population change since 1990 greater than 5000.
-
Open the query builder by right clicking on the layer and clicking Filter. Apply this filter statement:
pop_density > 200 AND annual_rate_1990_2020 > 5000then click OK. You can click Test to check if your filter before applying it to the layer.
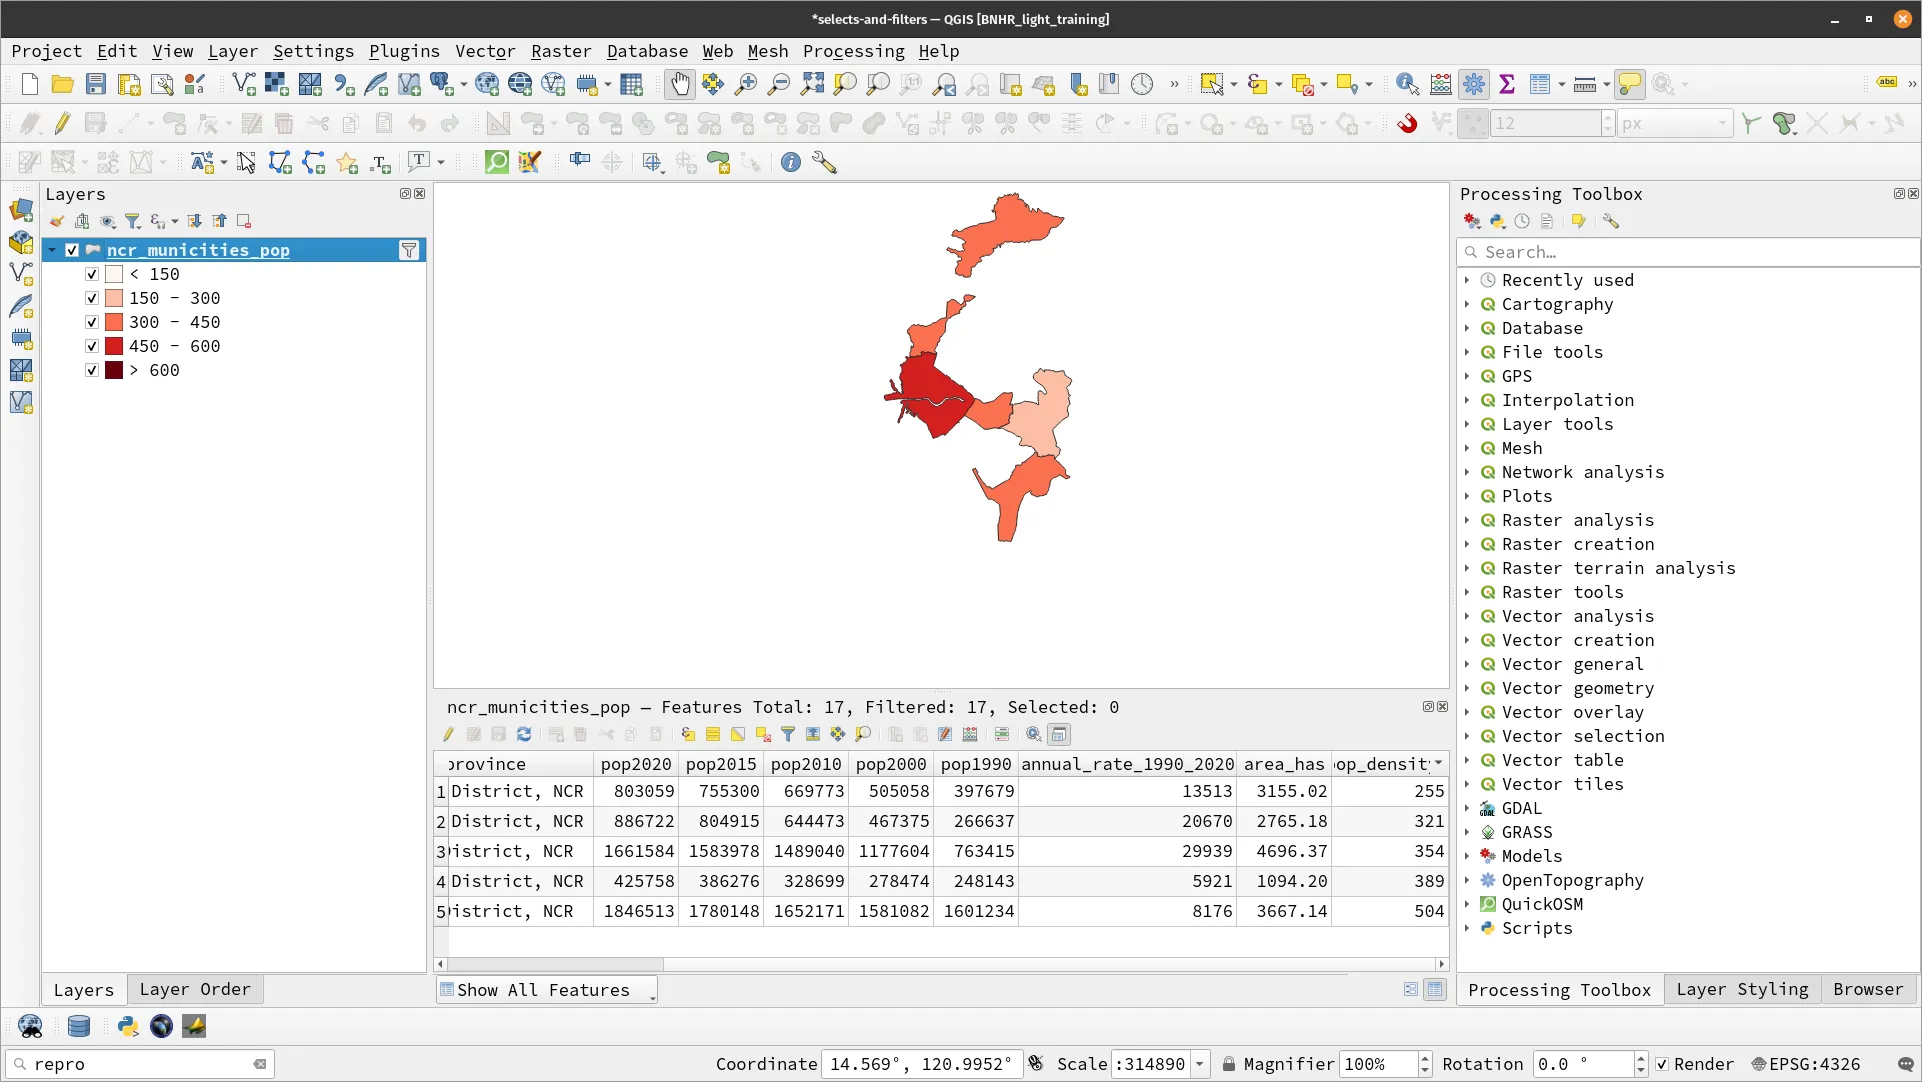
- You will notice that a layer has a filter applied because it will have a filter icon next to its name in the Layers Panel.
![]()
- Notice also that only the features that meet the specified criteria are visible in the map canvas and the attribute table of the layer.
- What other ways can you apply this filter?
Memory boosters and review
Section titled “Memory boosters and review”What is a selection in QGIS?
Section titled “What is a selection in QGIS?”A method of highlighting and isolating specific features in a layer.
Give an example of how you can make a selection in QGIS.
Section titled “Give an example of how you can make a selection in QGIS.”By using the Select Features by Rectangle tool, Select Features by Polygon tool, or Select Features by Freehand tool. You can also make a selection by using a SQL query or by selecting features based on their attributes.
What is a filter in QGIS?
Section titled “What is a filter in QGIS?”A method of displaying only certain features in a layer based on a specified attribute value, condition, or expression.
How do you create a filter in QGIS?
Section titled “How do you create a filter in QGIS?”To create a filter in QGIS, right-click on the layer you want to filter and select “Filter…”, then set the filter expression you want to filter by.
What is the difference between selects and filters in QGIS?
Section titled “What is the difference between selects and filters in QGIS?”Selects temporarily highlight features in the map canvas that meet a condition while filters show only the selected features and hide the rest.
Certification and support
Section titled “Certification and support”Contact us or sign-up to our courses if you are interested in having this as an instructor-led or self-paced course.