
Dynamic and automated maps with the QGIS Atlas
Introduction
Section titled “Introduction”QGIS Atlas allows you to automatically create a series of maps using a single layout. A properly configured QGIS Atlas will save you countless hours.
What you should already know
Section titled “What you should already know”As an intermediate level workbook, you are expected to already know basic GIS concepts such as spatial data models and formats and QGIS functions such as loading and styling layers, running processing algorithms, saving QGIS projects, etc.
A simple Atlas with data-driven elements
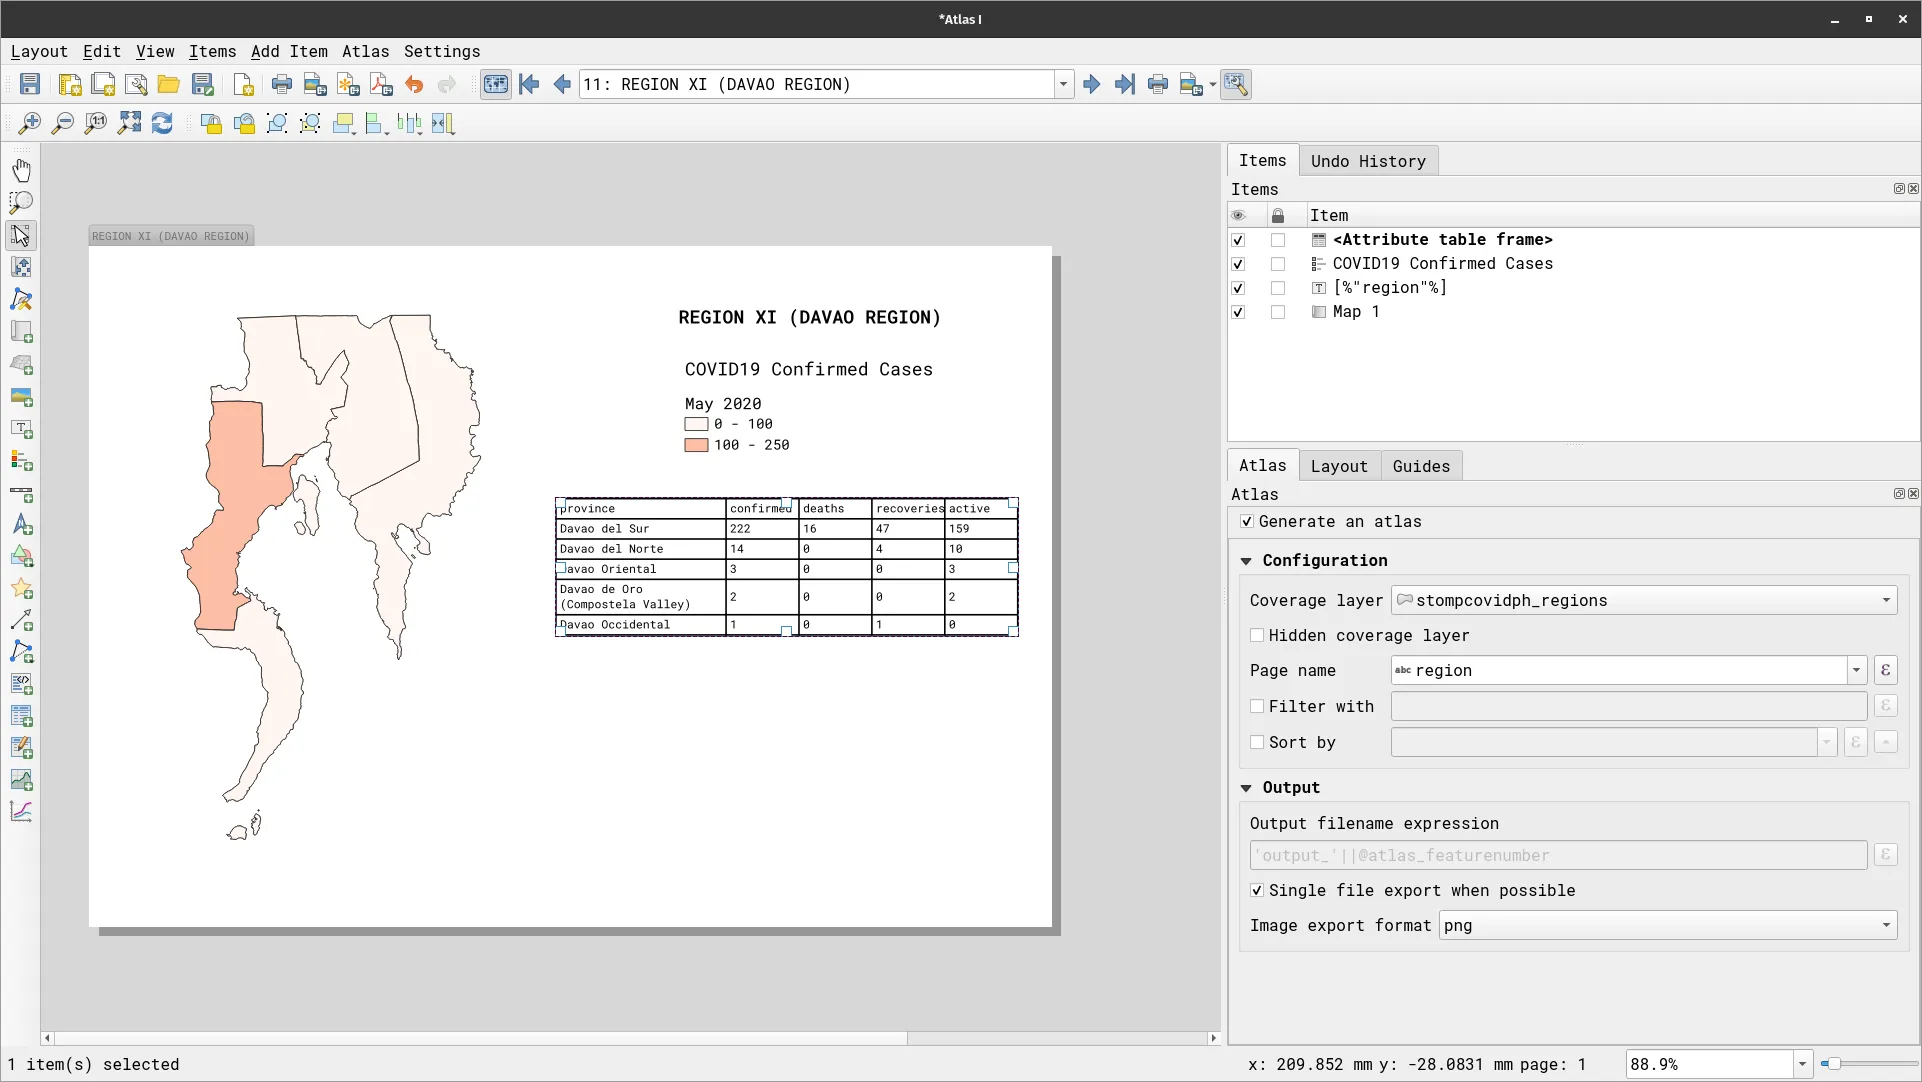
Section titled “A simple Atlas with data-driven elements”Exercise 4.1. Regional map of the Philippines showing statistics per province
Section titled “Exercise 4.1. Regional map of the Philippines showing statistics per province”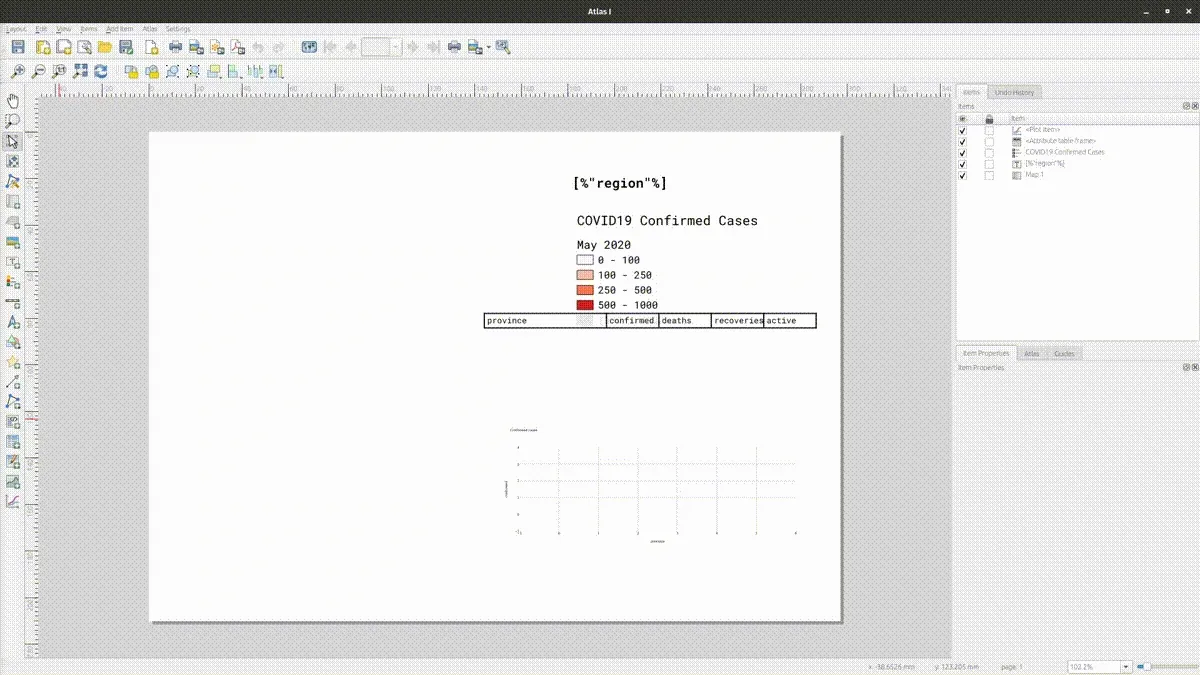
You may use the following video as reference.
The video below is in FilipinoIn this exercise, you will take the COVID-19 map you created in a previous exercise and create an atlas that generates one map per region but shows information about the provinces inside that region. To do that, you will utilize data-defined overrides and expressions.
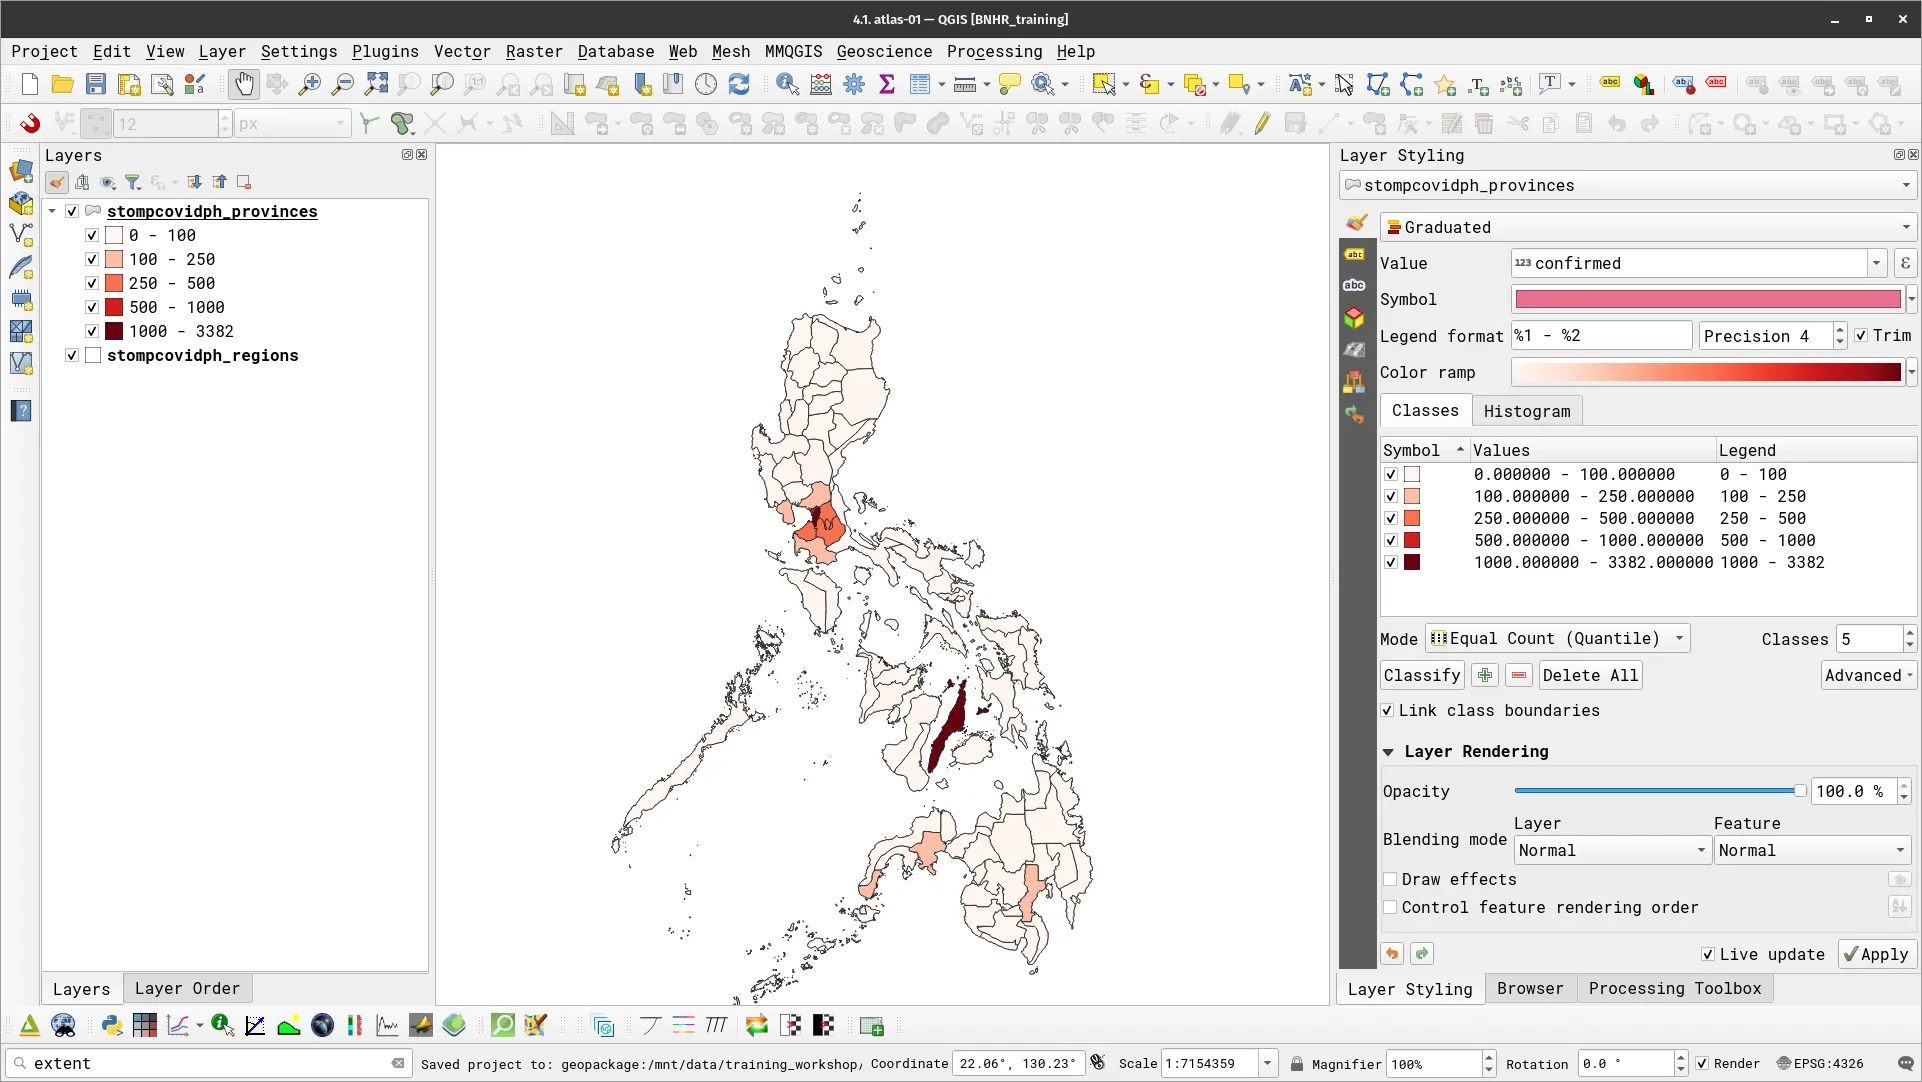
- Load the stompcovidph_provinces vector layer and style it accordingly.
- Load the stompcovidph_regions vector layer. No need to style this layer right now. You will use this layer as your coverage layer. Remember: each feature in your coverage layer equals one map. Since the regions layer is composed of features for each region, you will have one map per region after you’ve created the atlas.
- Create a new Print Layout and add a map.
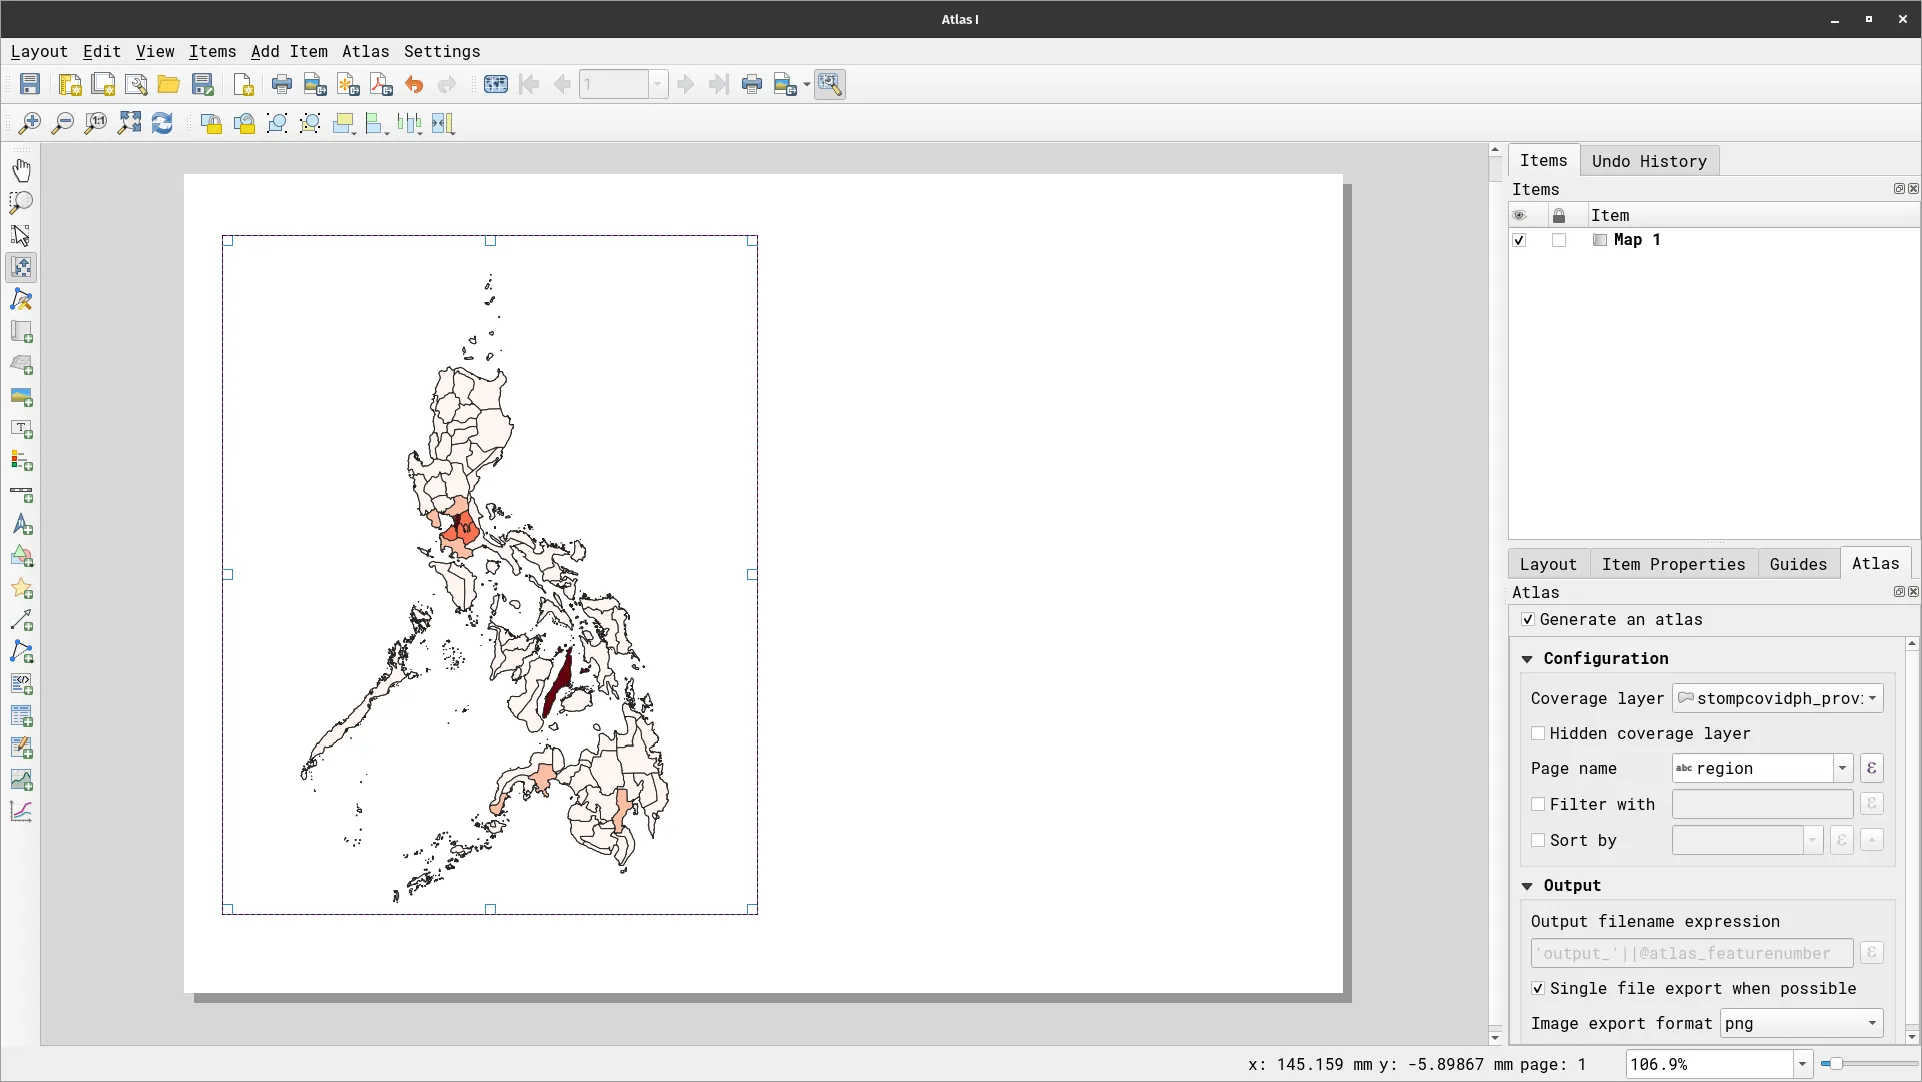
- Let’s configure your Atlas. Click the Configure Atlas button
 on the top toolbar to open the Atlas Settings.
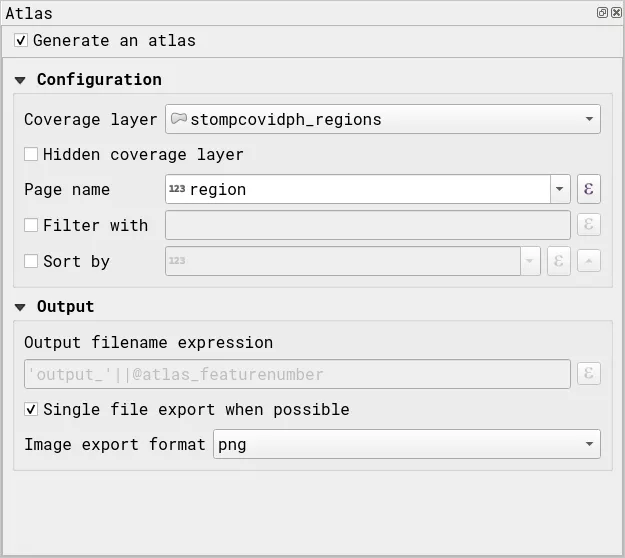
 - Check Generate an atlas and apply the following parameters:
- Configuration
- Coverage layer: stompcovidph_regions
- Page name: region
- Configuration
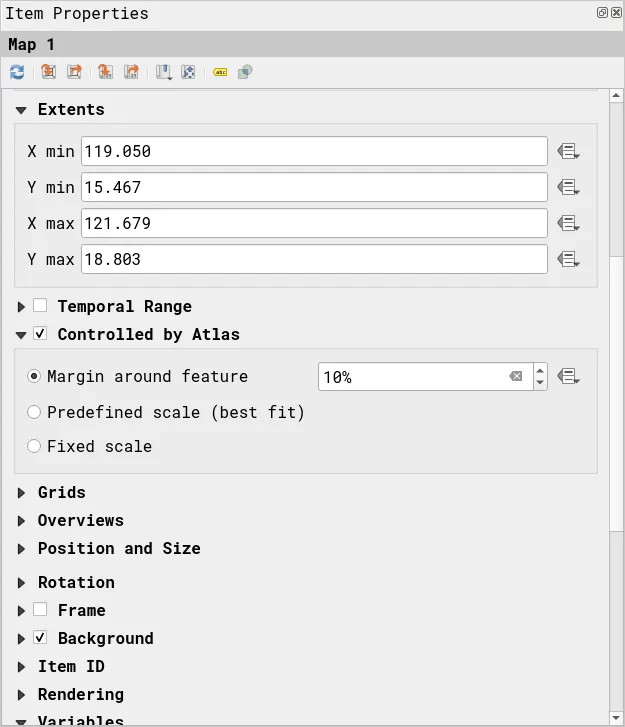
- Modify the Item Properties of the Map and check Controlled by Atlas.
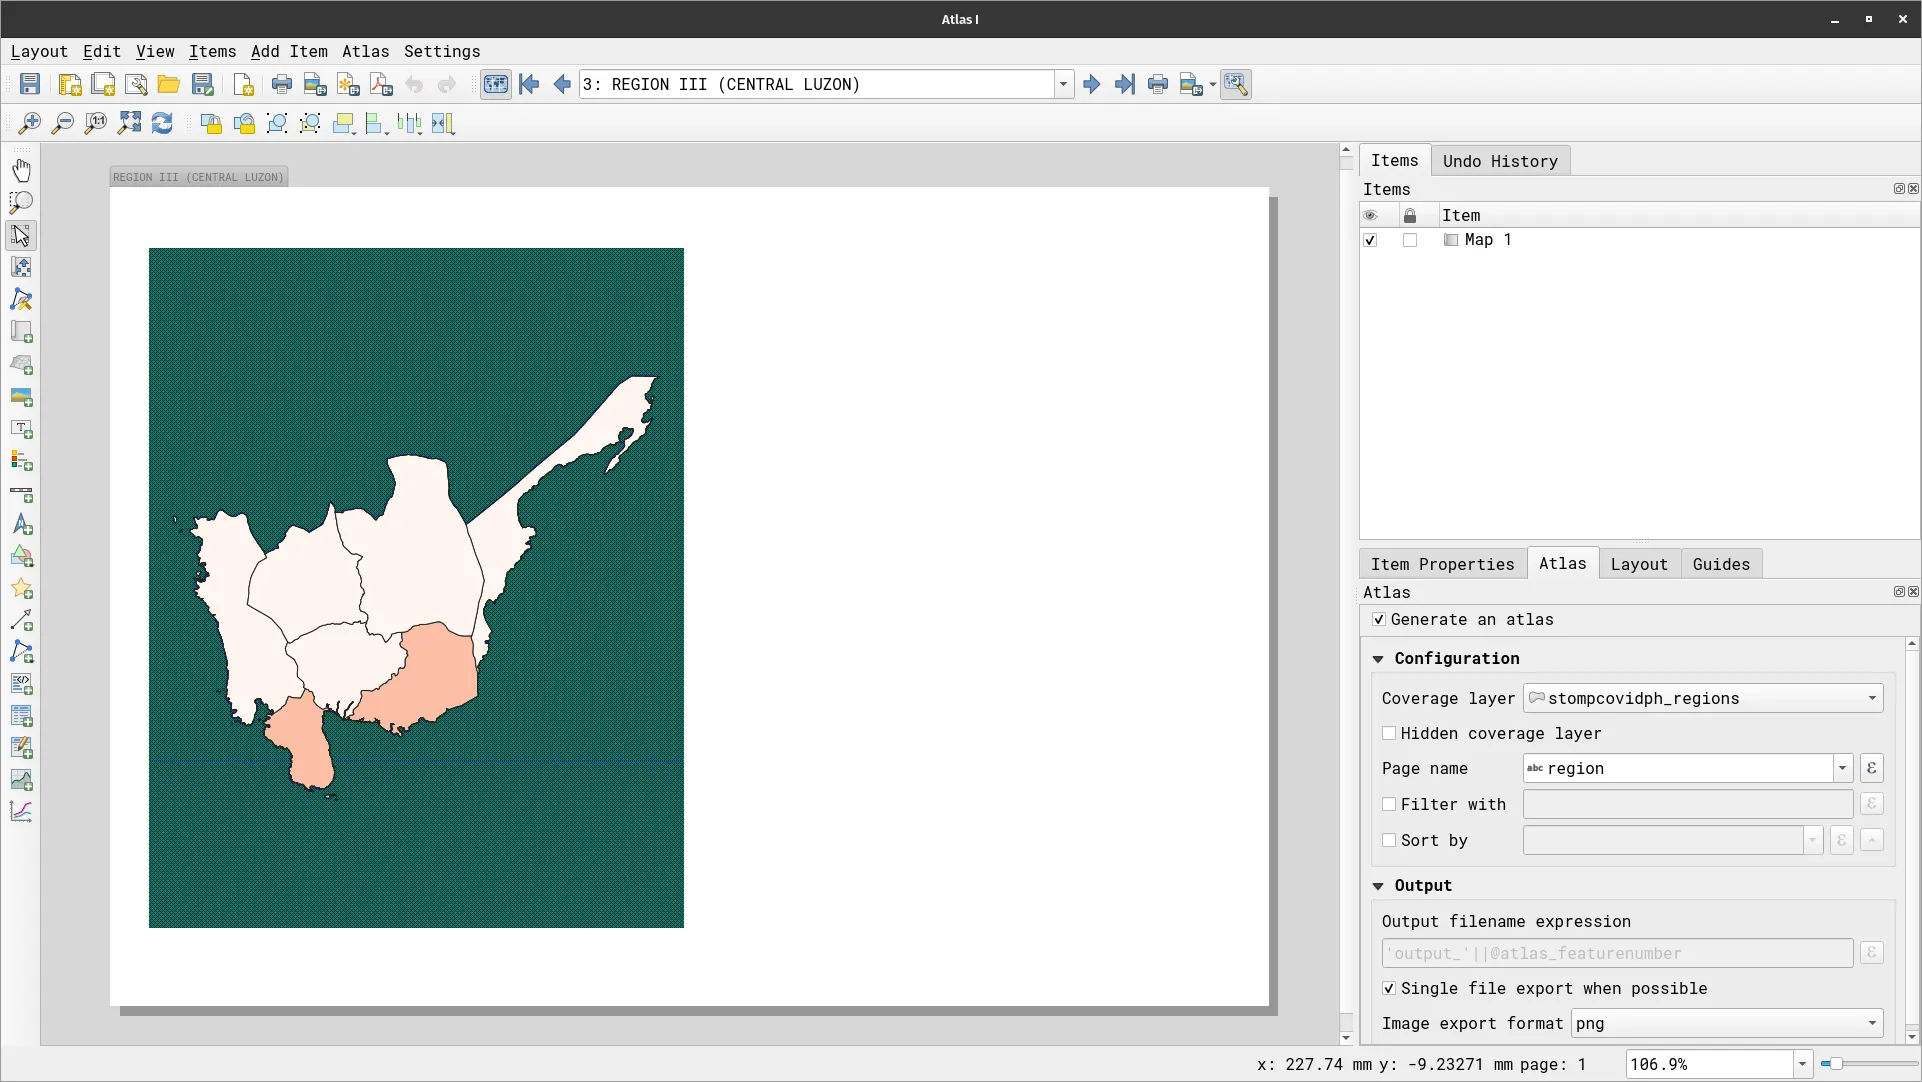
- Click the Atlas button (
 ) on the top toolbar to preview your atlas. The Atlas Toolbar shown below allows you to see the different maps in your atlas. Try to click the arrow buttons and see what happens to the map.
![]()
Showing only the region of interest
Section titled “Showing only the region of interest”Although your atlas does what it’s supposed to—which is to generate a map for each region automatically—it doesn’t look that appealing. What you can do is to utilize some techniques to improve the map.
For example, we can have only provinces inside the region be visible in the atlas maps. To do that, we can use two approaches.
Option 1: Styling the stompcovidph_regions layer
- Using this approach, you can apply a style to the regions layer such that when it is the feature being used by the atlas, it will cover all other features outside of itself. In essence, this just means that you will apply an Inverted Polygon symbology to the current atlas feature.
- This can easily be done by combining rule-based symbology, inverted polygon symbology, and expressions.
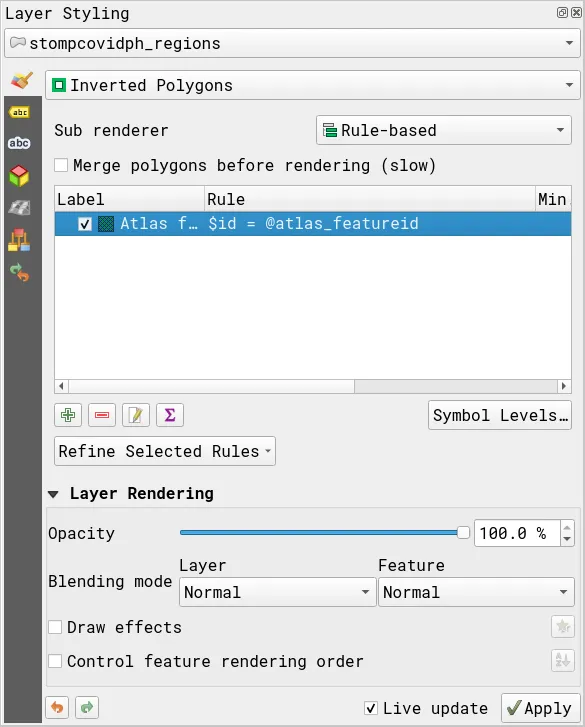
- Apply the following styles to the stompcovidph_regions layer: Inverted Polygons with a Rule-based Sub renderer.
- Create a rule to get the current atlas feature by using this expression:
$id = @atlas_featureid
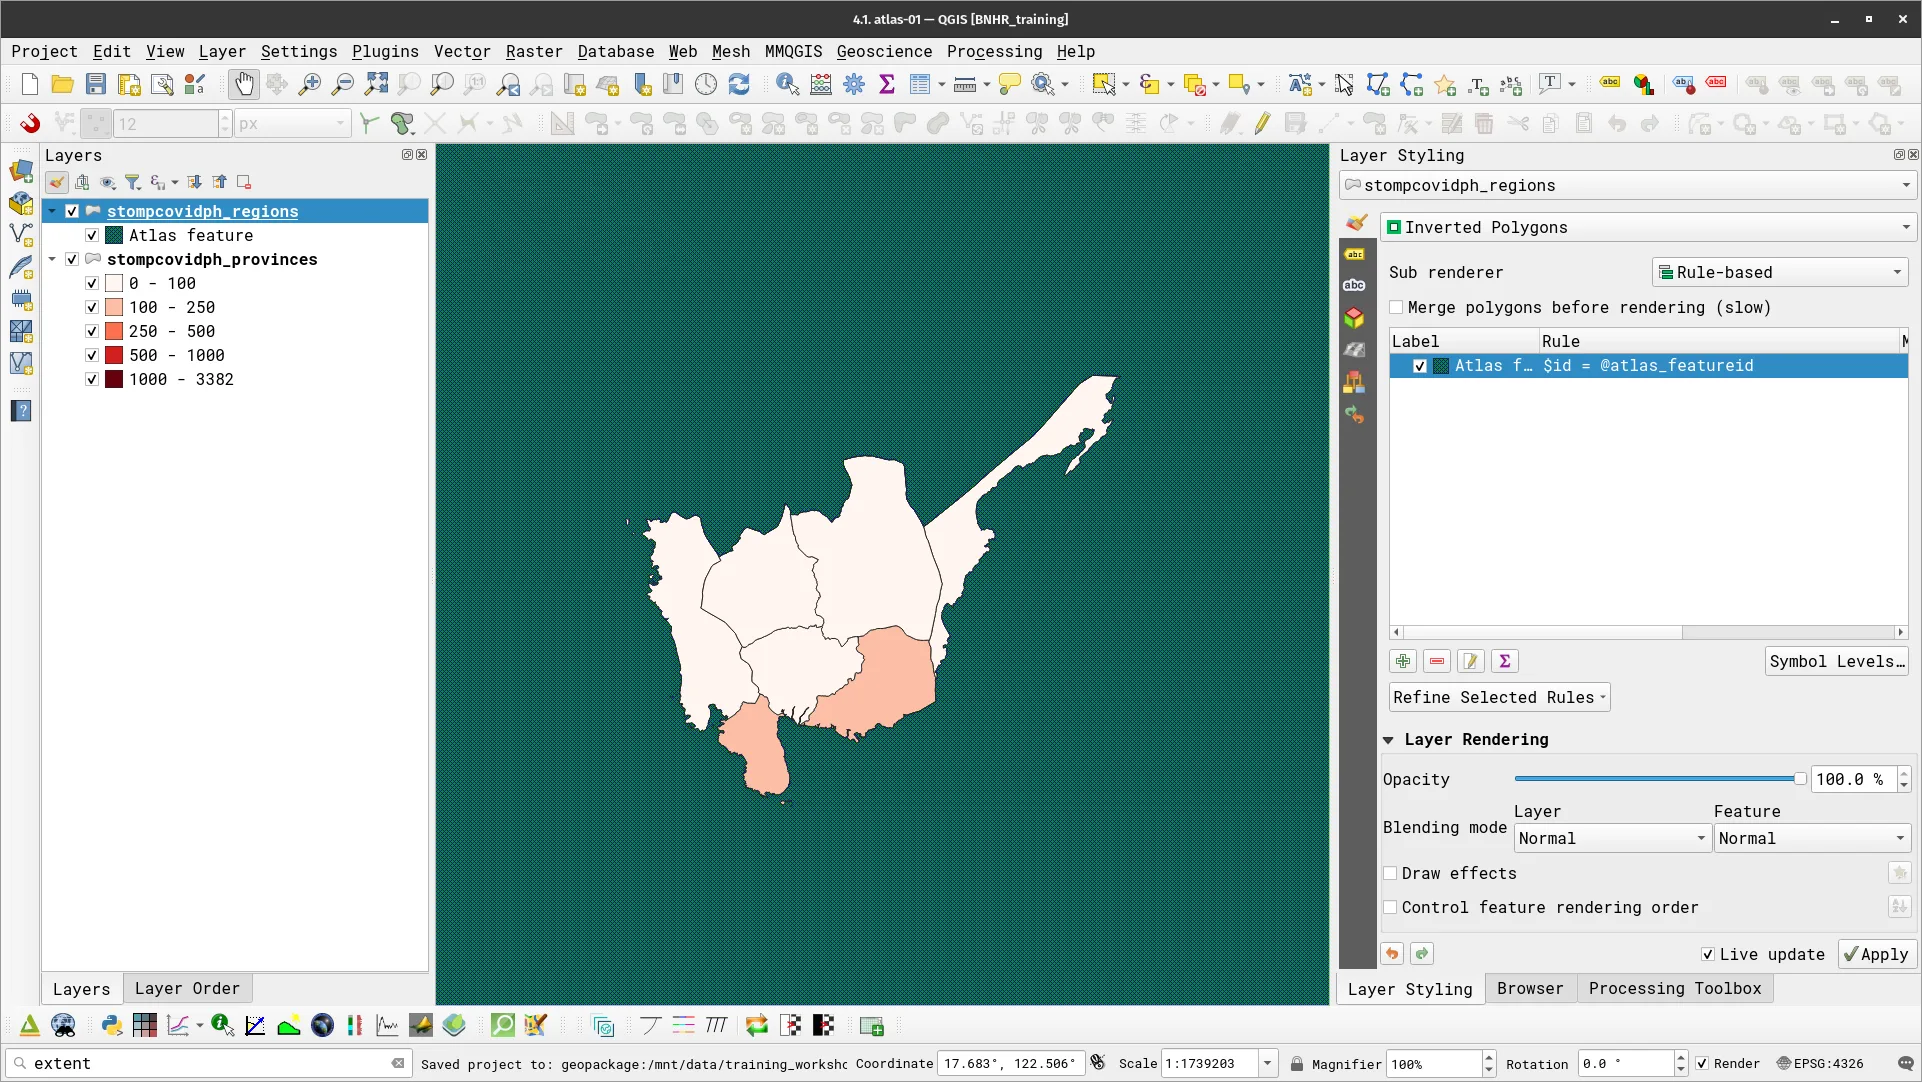
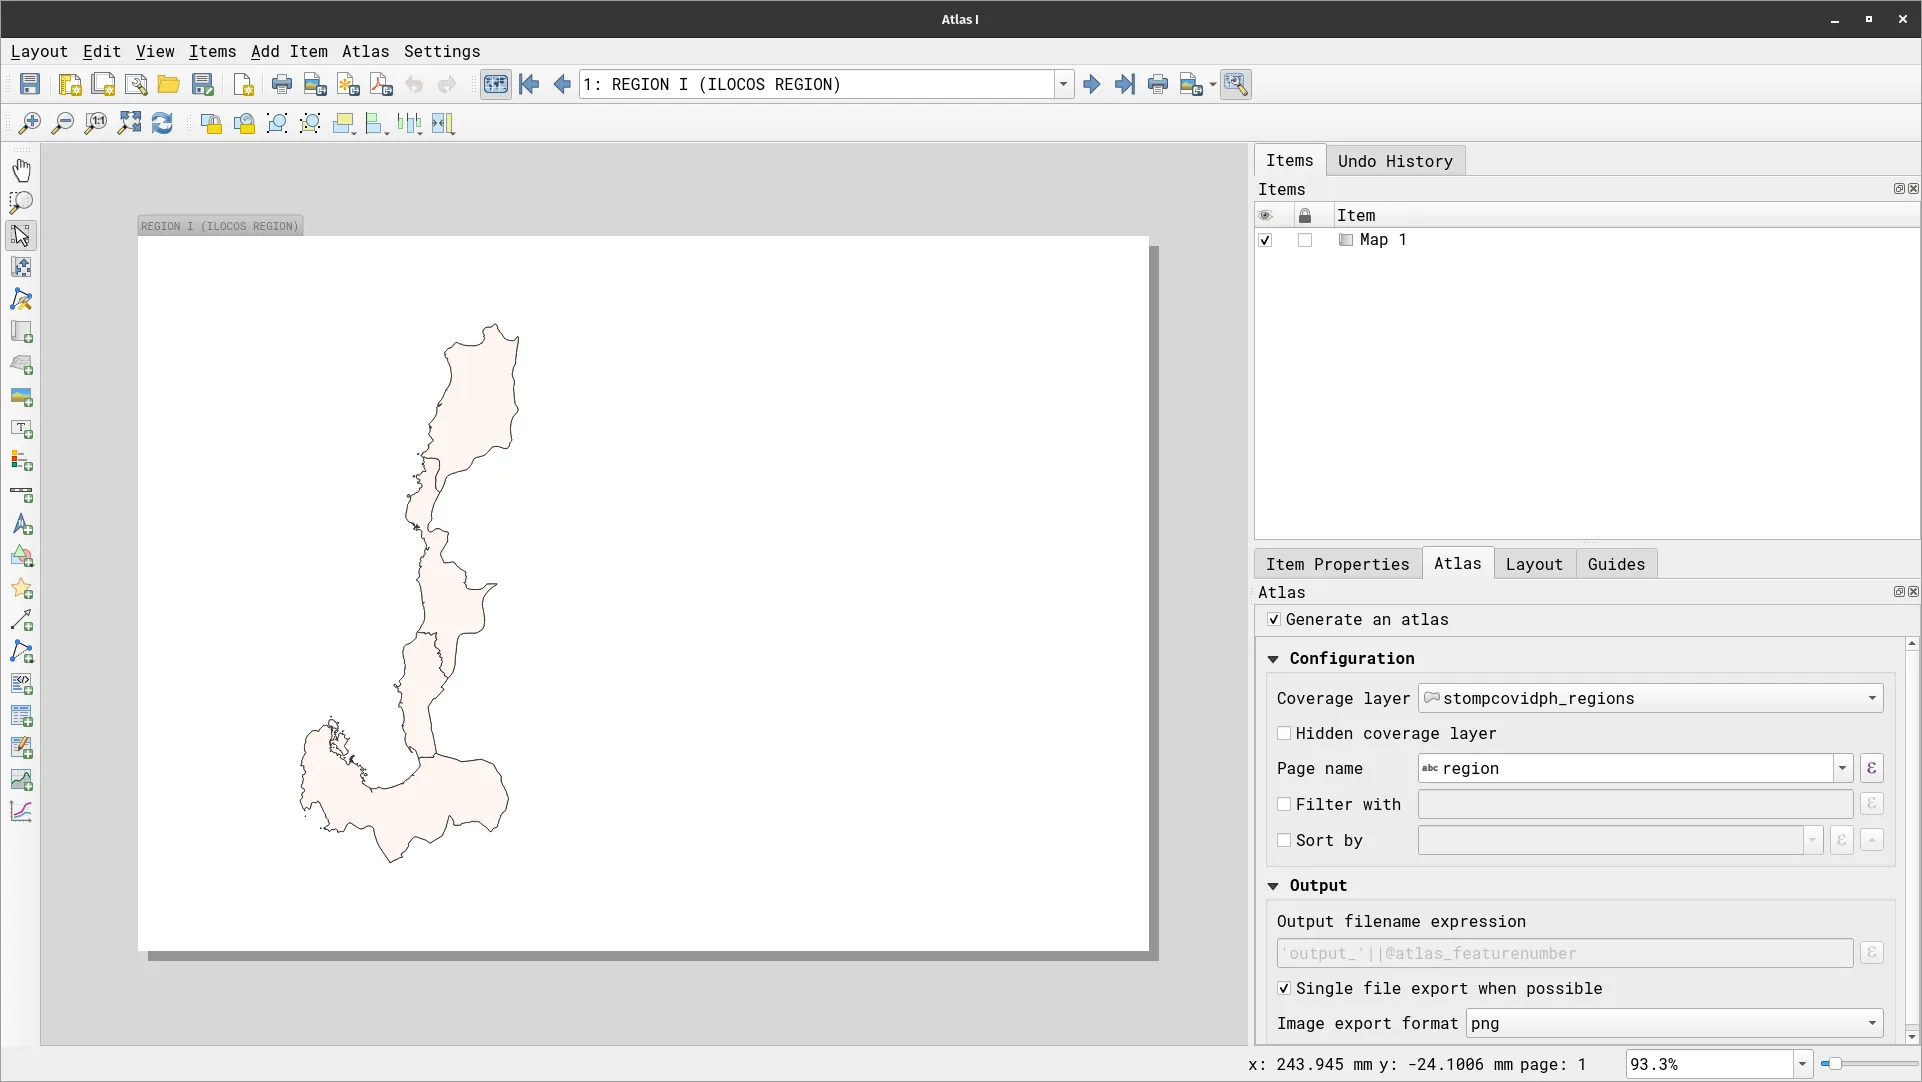
- As long as the stompcovidph_regions layer is rendered above the stompcovidph_provinces layer, then you should see a map canvas similar to the one below.
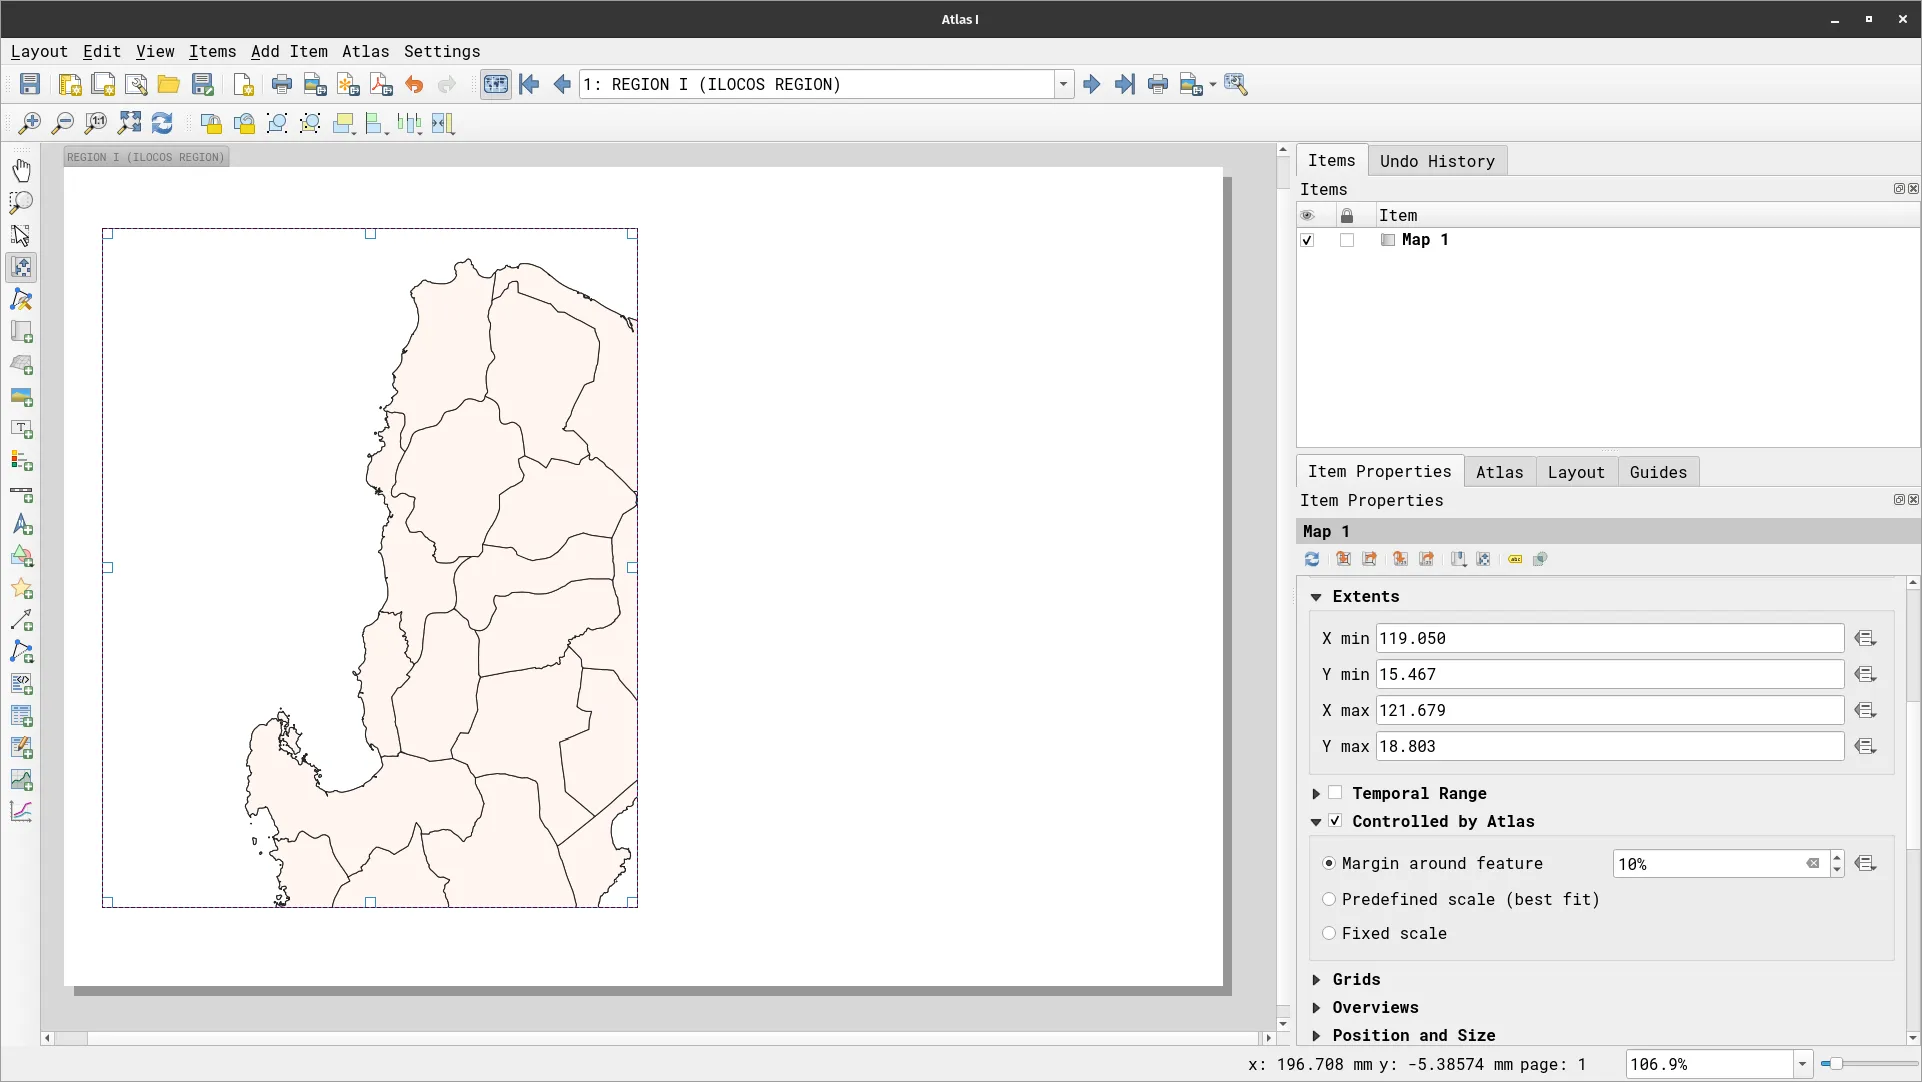
- This also reflects on the Print Layout and you should see something similar in the Atlas you created.
Option 2: Using expressions to filter the stompcovidph_provinces layer
The second option is to apply the same kind of filter directly to the provinces layer. In this case, you can use an expression that checks if a province is inside of a region and if yes, it will style the province. If not, it will not apply any styles (e.g. make it not visible).
This can be done by using a refined/nested rule-based symbology where the topmost rule checks whether or not a province is within a region (spatially) and the sub-rules apply the symbology.
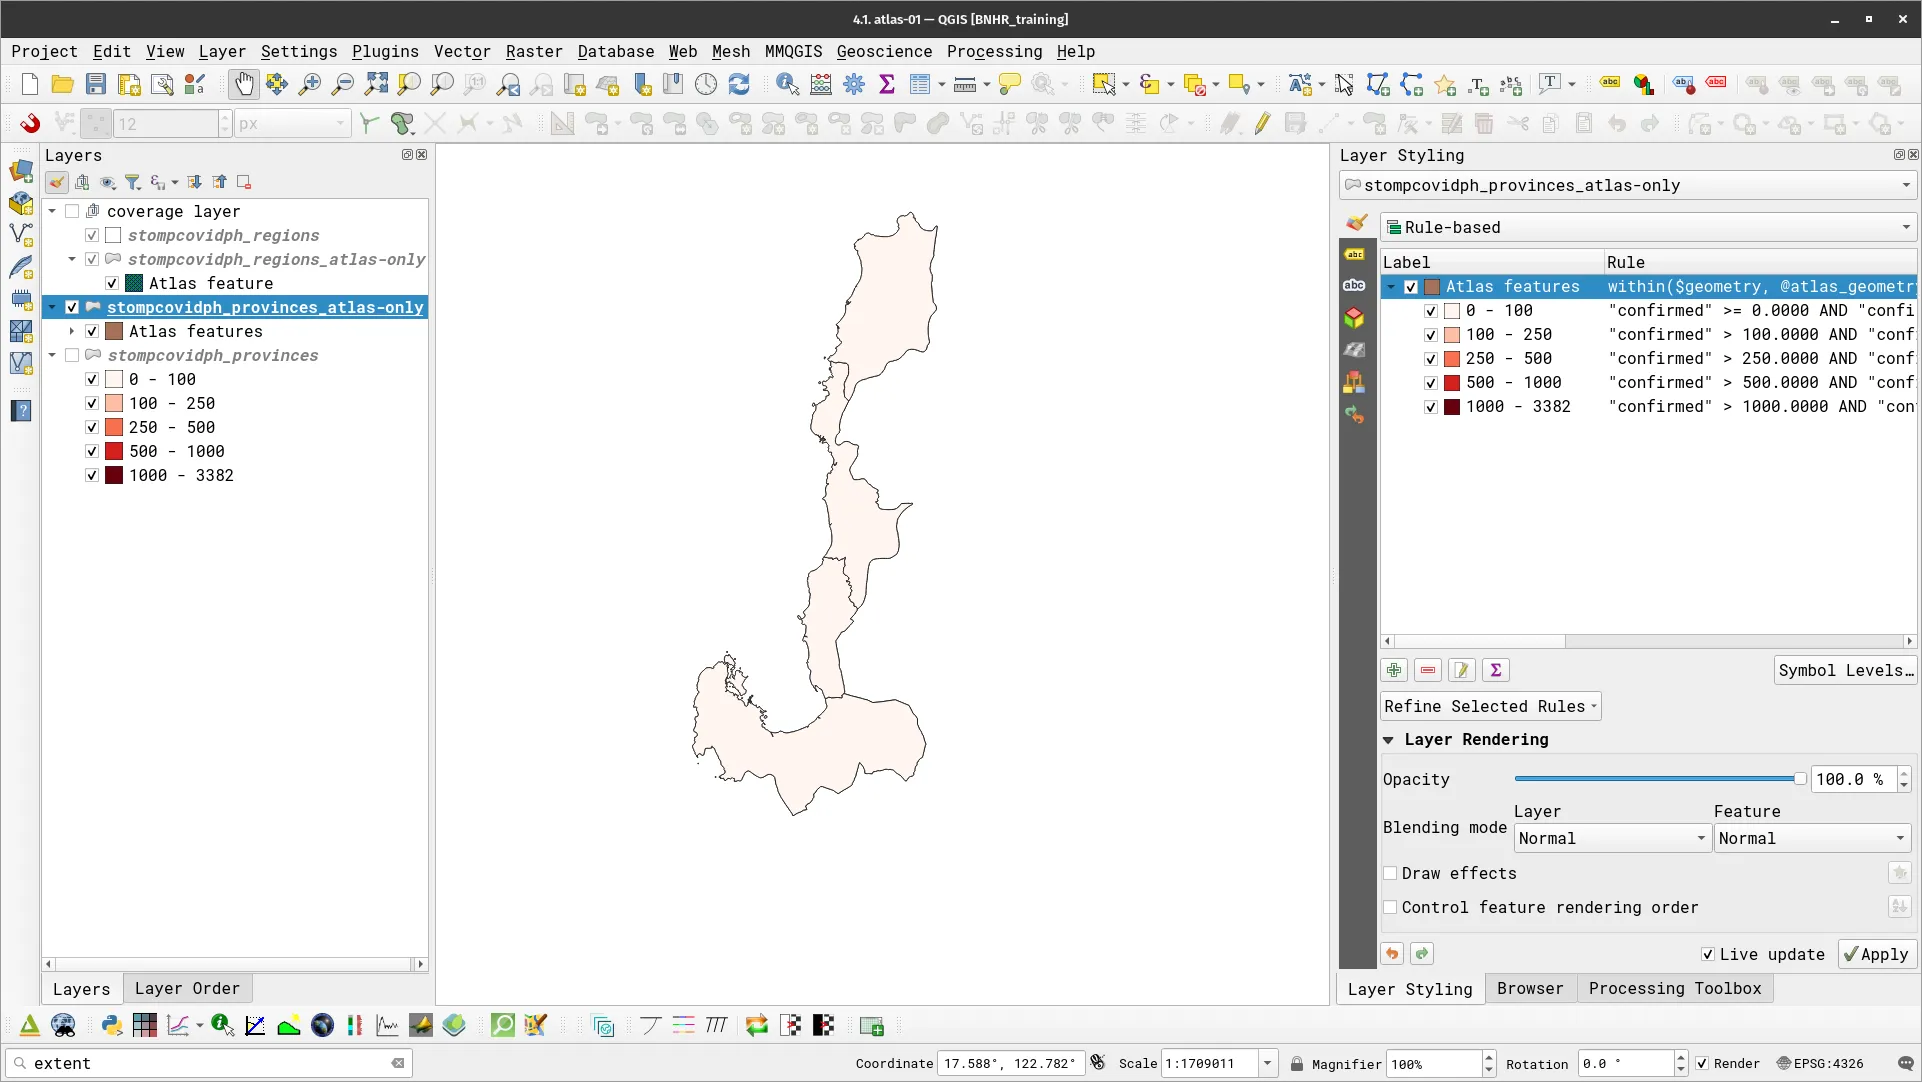
- Apply the following style to the stompcovidph_provinces layer.
- The topmost rule uses the following expression:
within($geometry, @atlas_geometry)
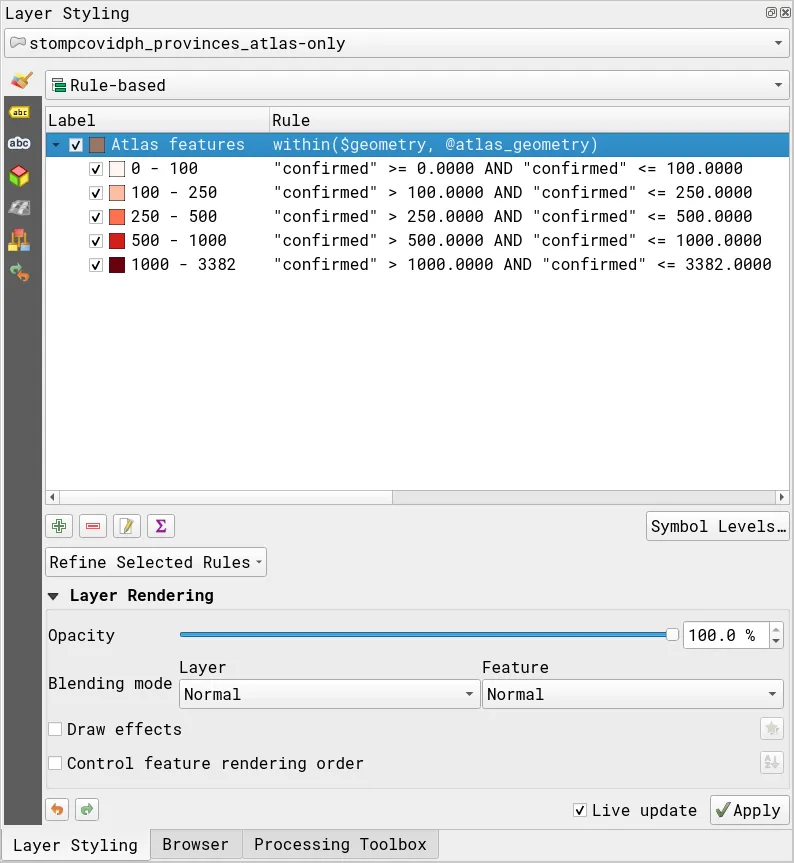
- Your map canvas should look like below:
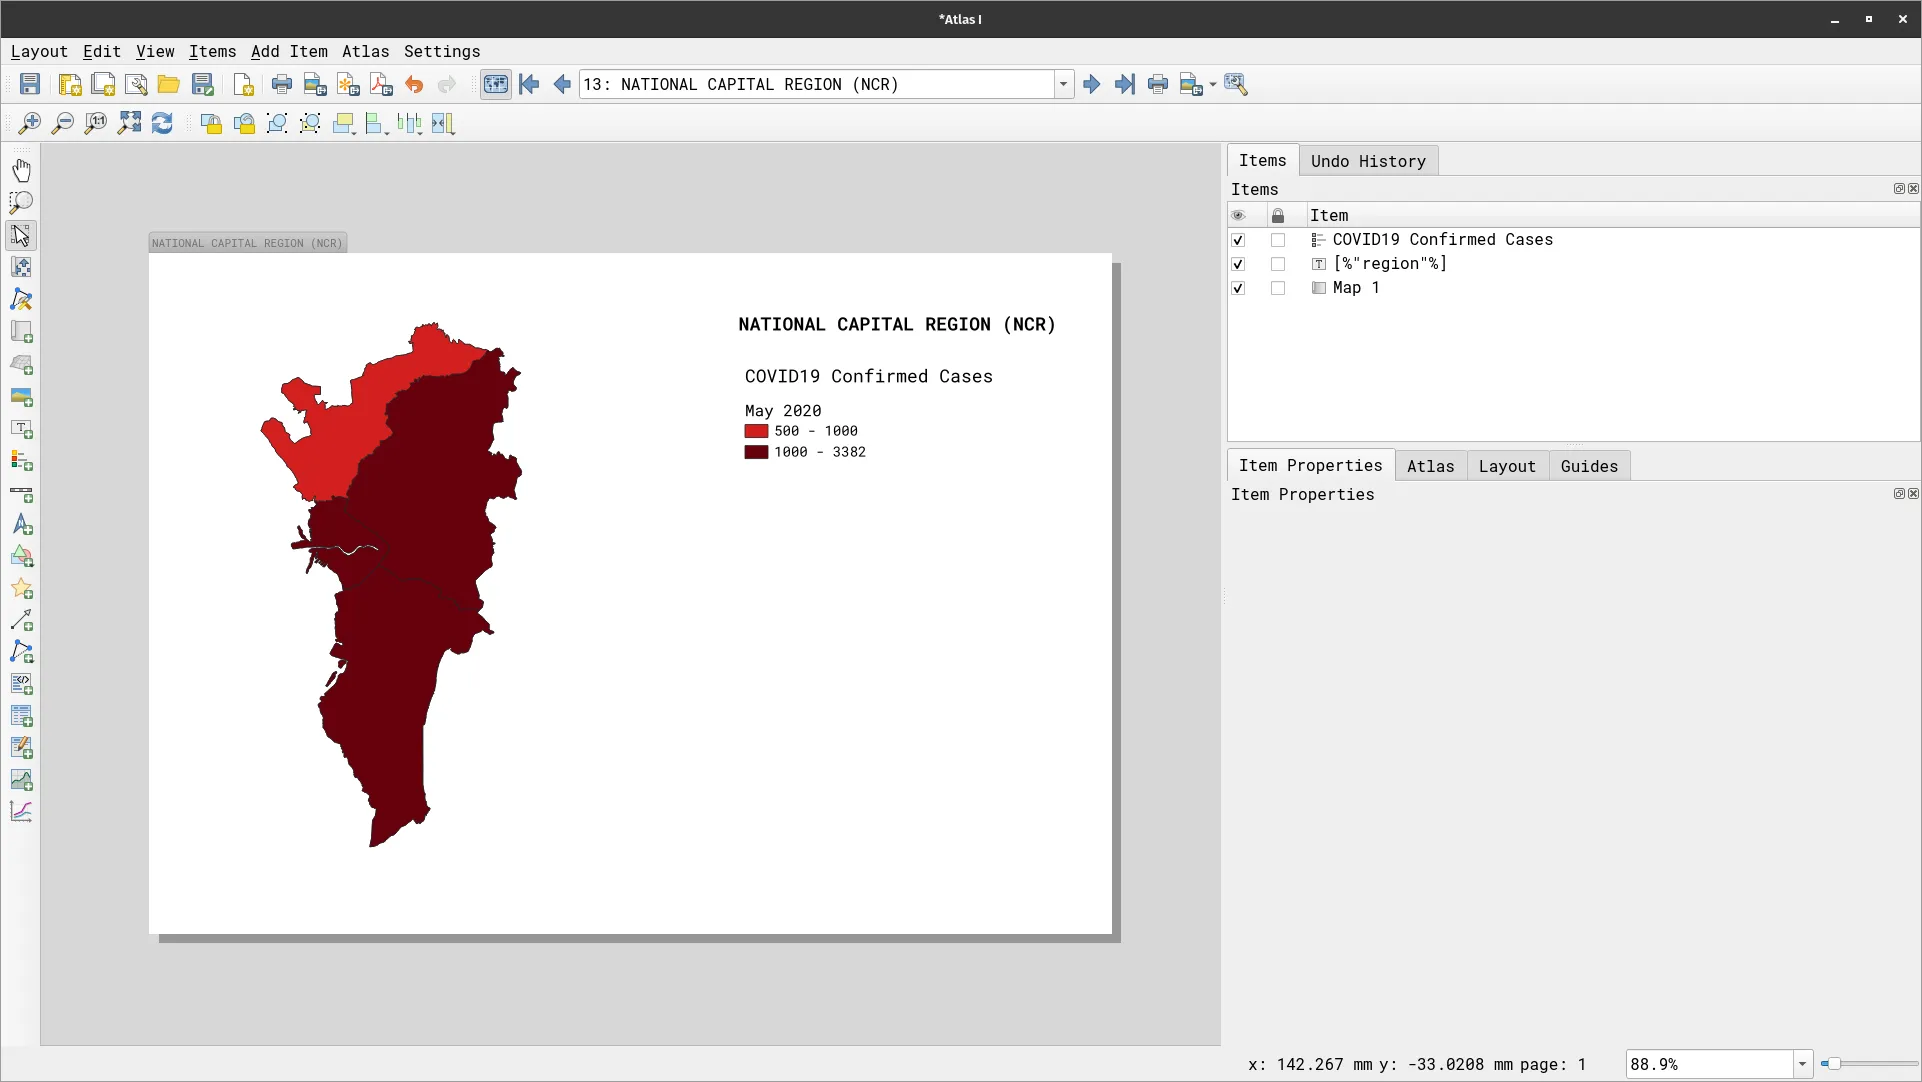
- Similar to the first option, this also reflects in the Atlas or Print Layout.
You can select which approach you like better.
In the next section, you will be adding more data-defined elements to your Atlas such as a texts, legends, and tables that change depending on the current atlas feature being mapped.
Data-defined elements
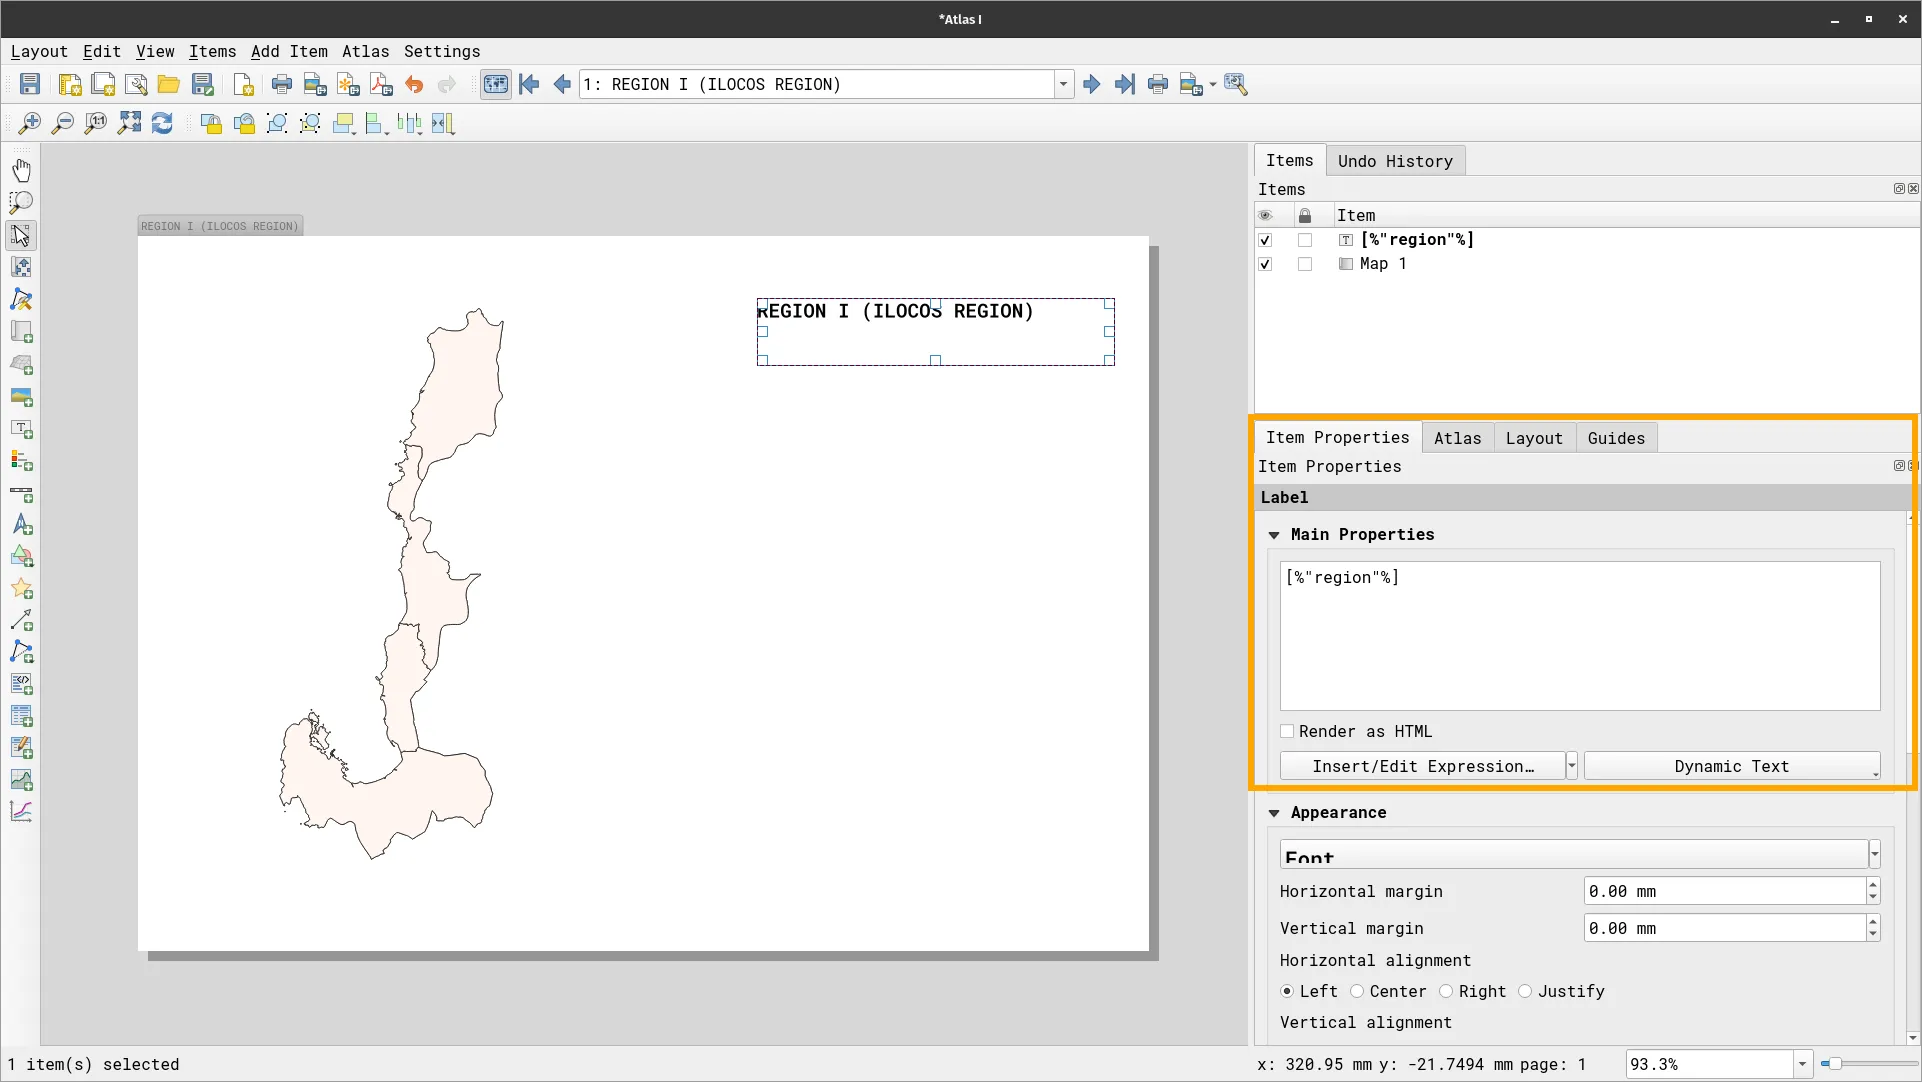
Section titled “Data-defined elements”Data-defined title
Section titled “Data-defined title”- Add a data-defined label to your map that shows the region.
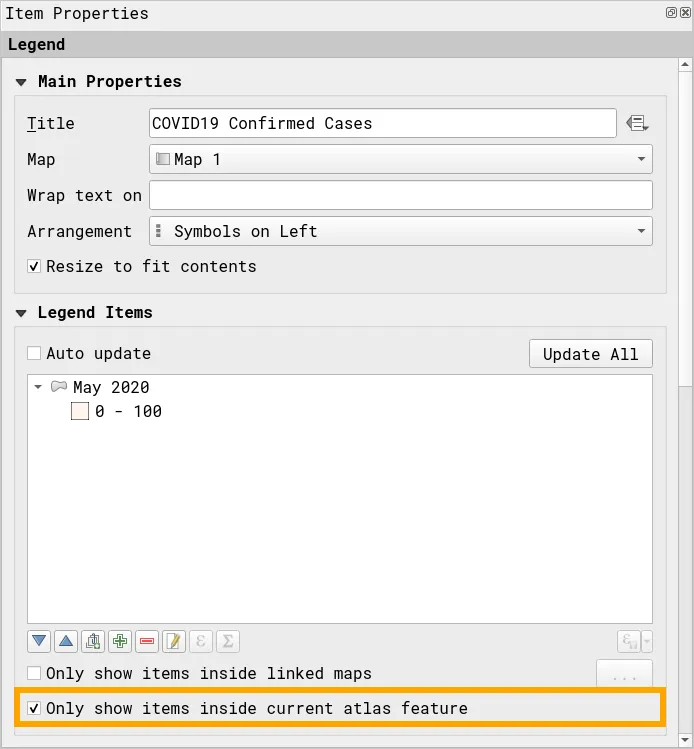
Atlas-defined legend
Section titled “Atlas-defined legend”- Add a legend to the map. You can make this legend only show the items inside the current atlas feature.
Adding a table that shows only the provinces in the region
Section titled “Adding a table that shows only the provinces in the region”You can use the same expression you used to filter the provinces inside the region to make a table that only shows those same provinces.
- Add a table to the map and define the table using the following columns.
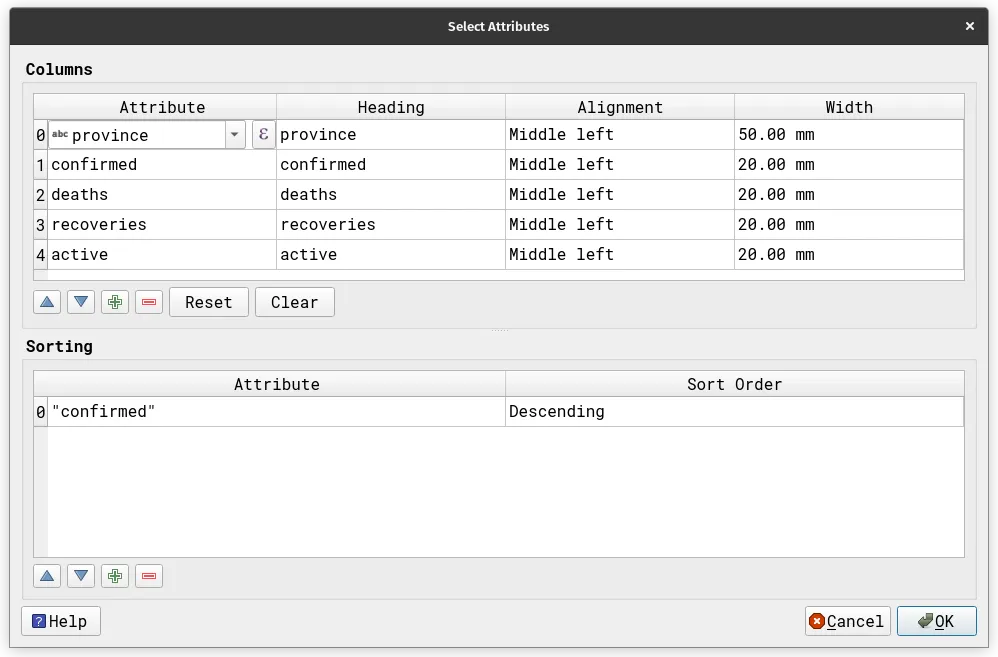
-
Under Feature Filtering, check Filter with and use the following expression:
within($geometry, @atlas_geometry) -
Under Appearance, select Wrap Text for Oversized text.
Adding a data-defined plot/graph
Section titled “Adding a data-defined plot/graph”Similarly, you can use the same expression to filter the plots you add to your map.
-
Create the same bar plot you did in one of the previous exercises.
-
Under Feature subset use the following expression:
within($geometry, @atlas_geometry)
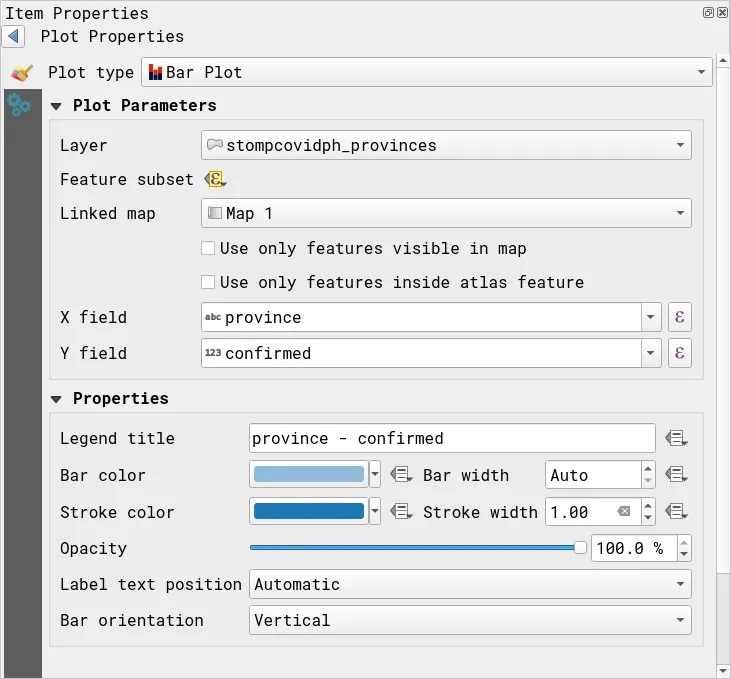
- The plot should change values depending on the current atlas feature being mapped.

Completing and exporting your map
Section titled “Completing and exporting your map”
- You can add other map items/elements and configure them as you like—e.g. scalebar, north arrow, etc.
- Once you’re happy with your Atlas, you can Export your atlas as images by clicking
 . Depending on how you configured your atlas, this may result in a single image or multiple images (1 per map).
Atlas that iterates over the same area/coverage
Section titled “Atlas that iterates over the same area/coverage”Exercise 4.2. Mapping the field goals of different teams using an Atlas
Section titled “Exercise 4.2. Mapping the field goals of different teams using an Atlas”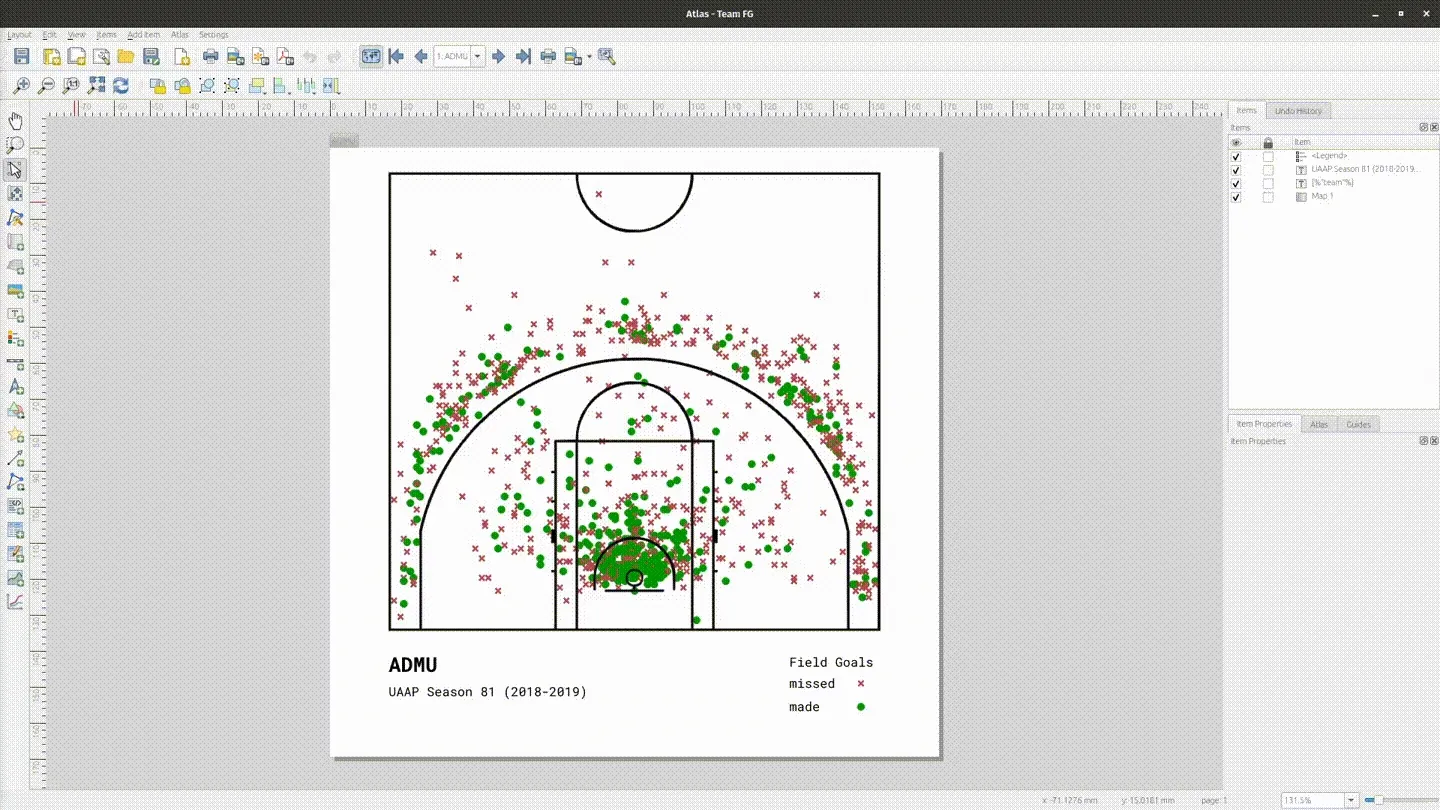
You may use the following video as reference.
The video below is in FilipinoIn this exercise, you will utilize an atlas to map the same area but showing different things (e.g. phenomena, attributes, etc.). In this case, the area will be a basketball court and you will show the field goal distribution of eight UAAP (University Athletics Association of the Philippines) using an atlas by combining rule-based symbology, expressions, and a creative use of the coverage layer.
The goal of this exercise is for you to create an atlas that can map the individual field goal attempts of 8 teams. You will create 8 maps. The area being mapped is the same (the court) but each time a map is generated, it should show the field goals of one of the 8 teams.
To do this, you need:
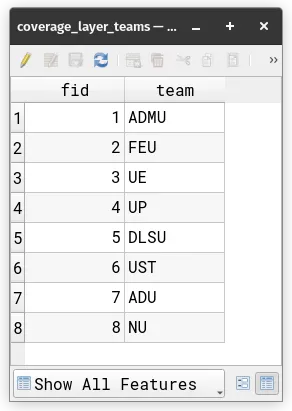
- a coverage layer (coverage_layer_teams) that:
- covers the extent of the basketball court
- has 8 features (1 for each team)
- has a “team” attribute/field corresponding to one of the 8 teams
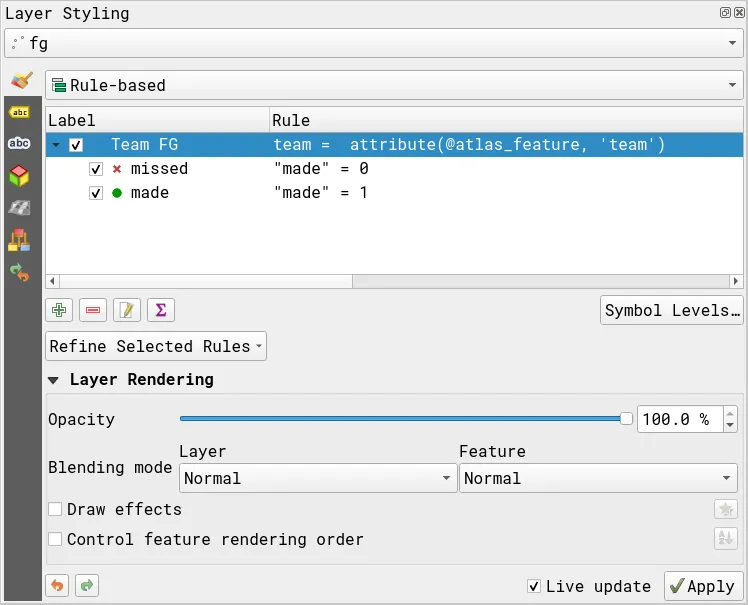
- a nested/refined rule-based symbology on the field goal layer (fg) where:
- Team FG (main rule):
- Filter:
team = attribute(@atlas_feature, 'team')
- Subrules (categories)
- missed:
"made" = 0- made:
"made" = 1
- Filter:
- Team FG (main rule):
- Create a new layout and add a map.
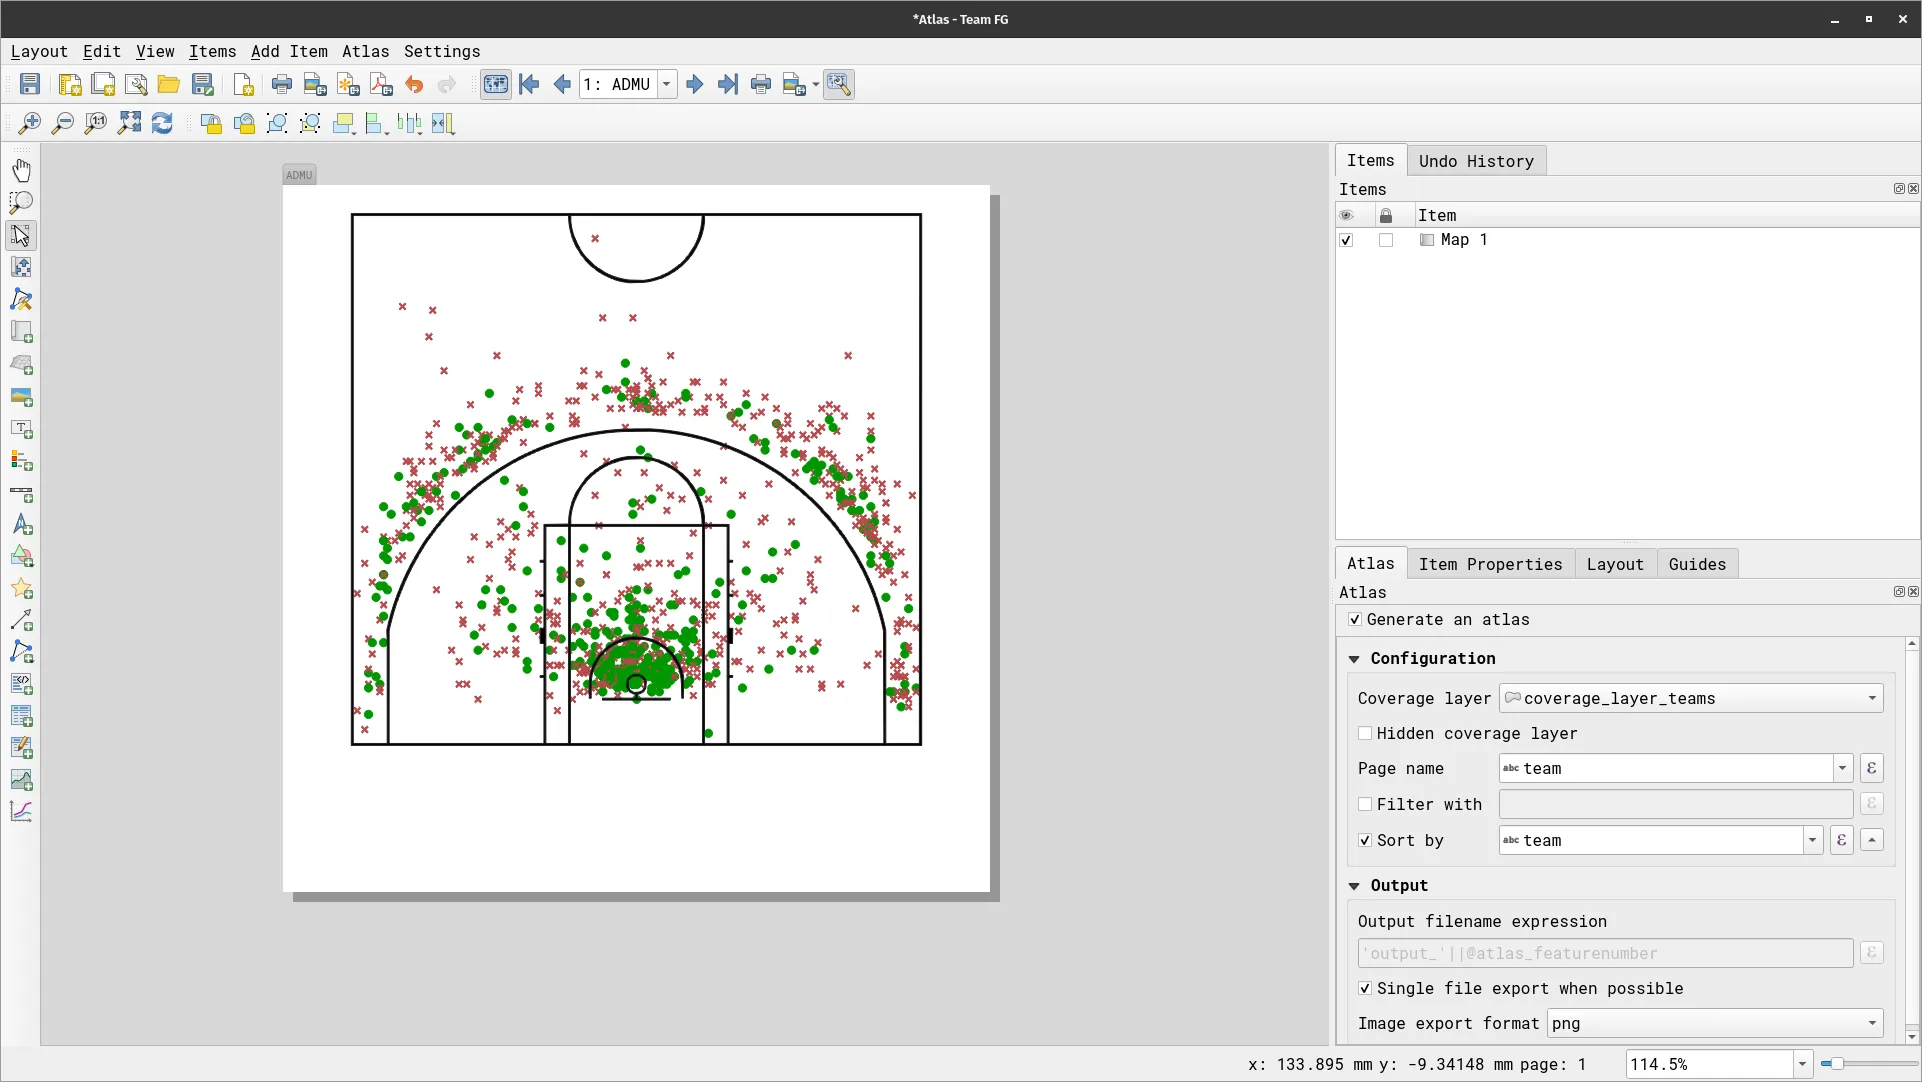
- Generate an atlas using coverage_layer_teams as the coverage layer.
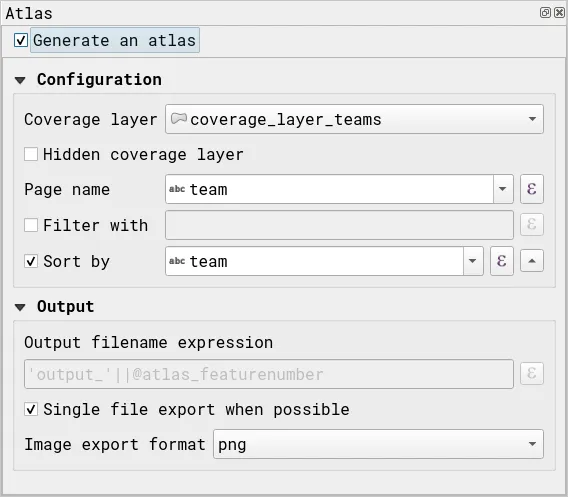
- Enable the atlas and look at the generated maps.
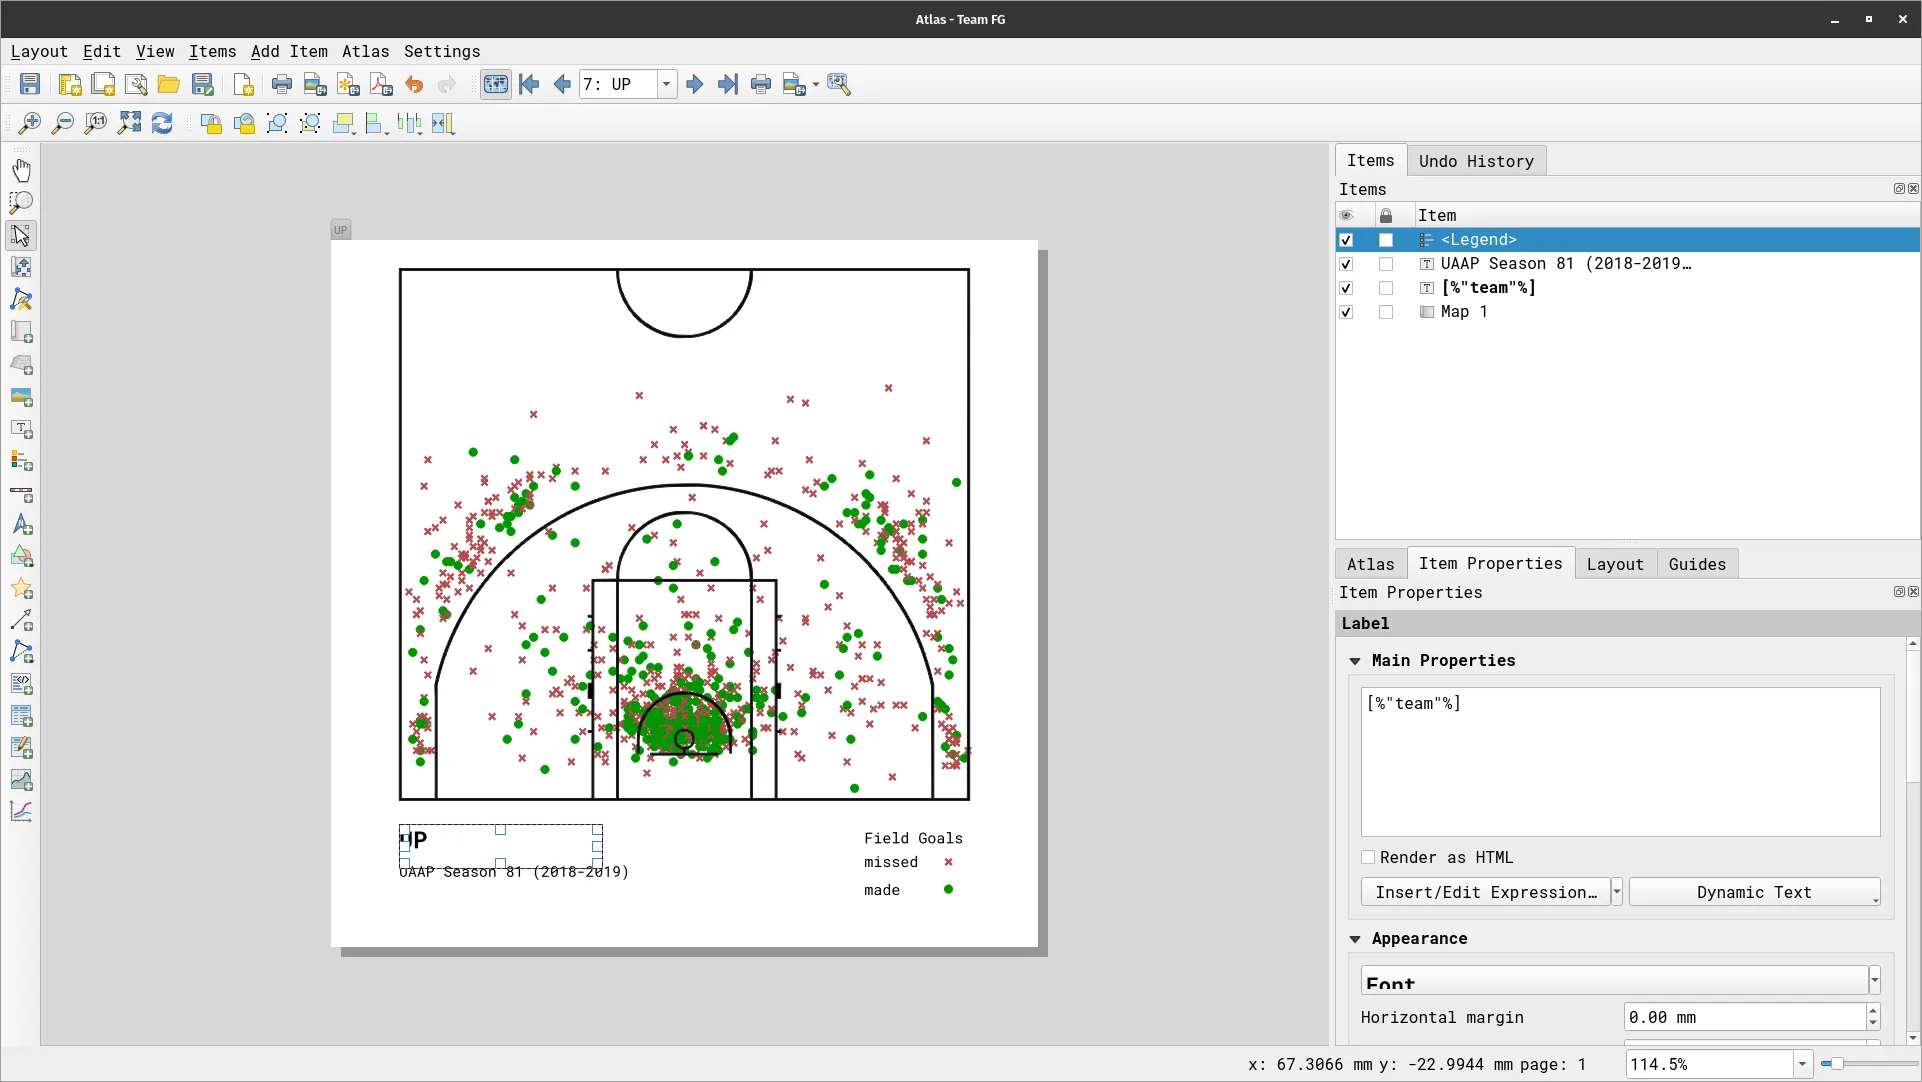
- Add other data defined elements such as titles and legends.
Atlas that incorporates map themes
Section titled “Atlas that incorporates map themes”You’ve learned how to use an atlas to map different areas showing the same layer (COVID19 cases per region) as well as mapping the same layer multiple times in the same area (FGA of 8 teams in the same court). This time, you will add another level to your Atlas skills by mapping multiple layers in the same area.
Exercise 4.3. Mapping different team statistics using an Atlas
Section titled “Exercise 4.3. Mapping different team statistics using an Atlas”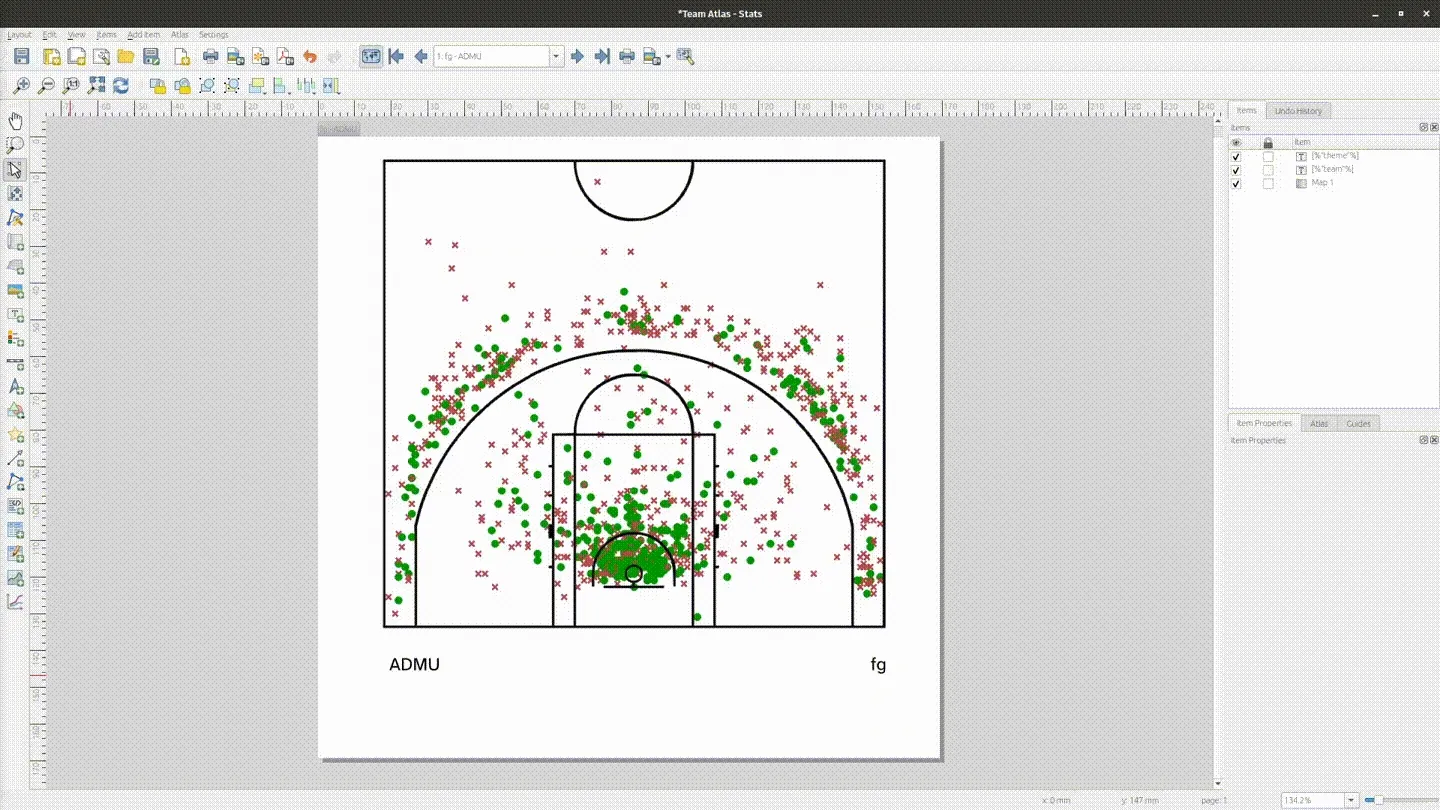
You may use the following video as reference.
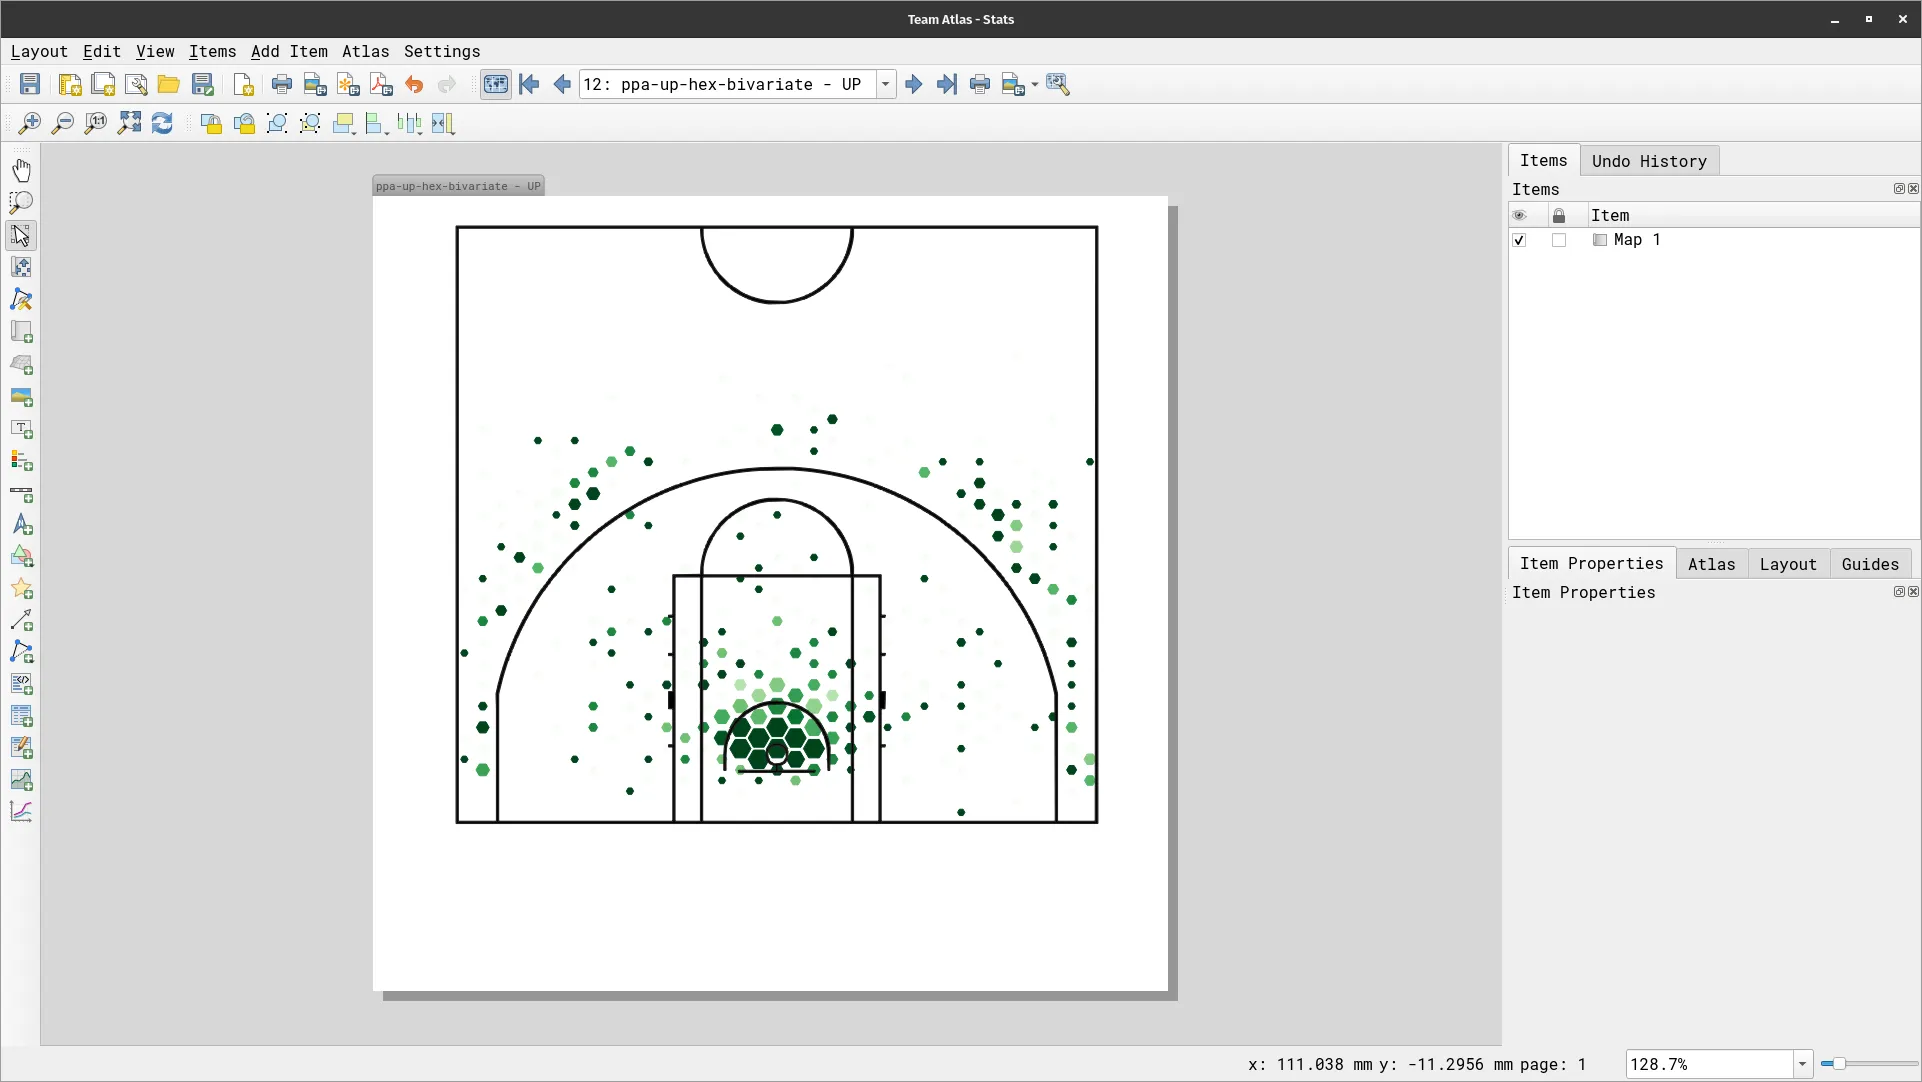
The video below is in FilipinoThe goal of this exercise is for you to create an atlas that can map different shooting statistics of 8 teams. In total, you will generate 12 maps: 8 FG maps, 1 PPA map for ADMU, 1 PPA (hex) map for UP, 1 PPA bivariate map for ADMU, and 1 PPA (hex) bivariate map for UP.
The area being mapped is the same (the court) but you will be mapping 5 different variables/layers.
- fg: for the FG maps
- ppa_admu: Points per Attempt (PPA) for ADMU (square)
- ppa_up_hex: Points per Attempt (PPA) for UP (hexagon)
- ppa_admu_bivariate: Bivariate PPA (size + color) for ADMU (square)
- ppa_up_hex_bivariate: Bivariate PPA (size + color) for UP (hexagon)
Essentially, you are creating 1 layout that can dynamically map different layers. Similar to the previous exercise, you need to be creative with your coverage layer. You will also utilize your knowledge of map themes.
To do this exercise, you need:
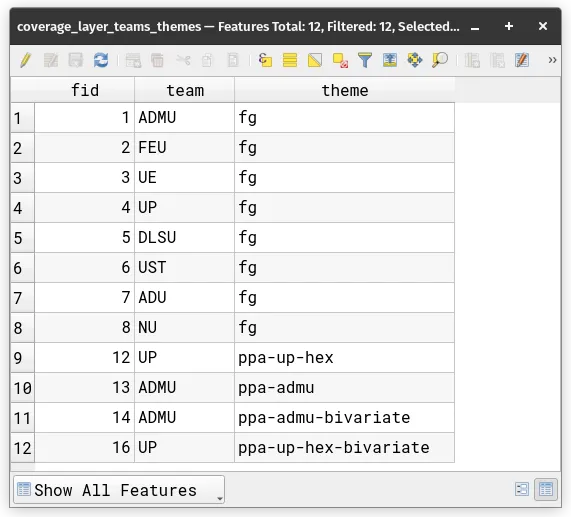
- a coverage layer (coverage_layer_teams_theme) that:
- covers the extent of the basketball court
- has 12 features (1 for each map)
- has a “team” attribute/field corresponding to the team being mapped
- has a “theme” attribute/field corresponding to the theme that will be used for the map (atlas feature)
- Five (5) map themes, one for each kind of map that will be created.
- fg: theme that will be used when mapping the fg layer
- for this theme, only the court and fg layer should be visible
- ppa-admu: theme that will be used when mapping the ppa_admu layer
- for this theme, only the court and ppa_admu layer should be visible
- ppa-up-hex: theme that will be used when mapping the ppa_up_hex layer
- for this theme, only the court and ppa_up_hex layer should be visible
- ppa-admu-bivariate: theme that will be used when mapping the ppa_admu_bivariate layer
- for this theme, only the court and ppa_admu_bivariate layer should be visible
- ppa-up-hex-bivariate: theme that will be used when mapping the ppa_up_hex_bivariate layer
- for this theme, only the court and ppa_up_hex_bivariate layer should be visible
- fg: theme that will be used when mapping the fg layer
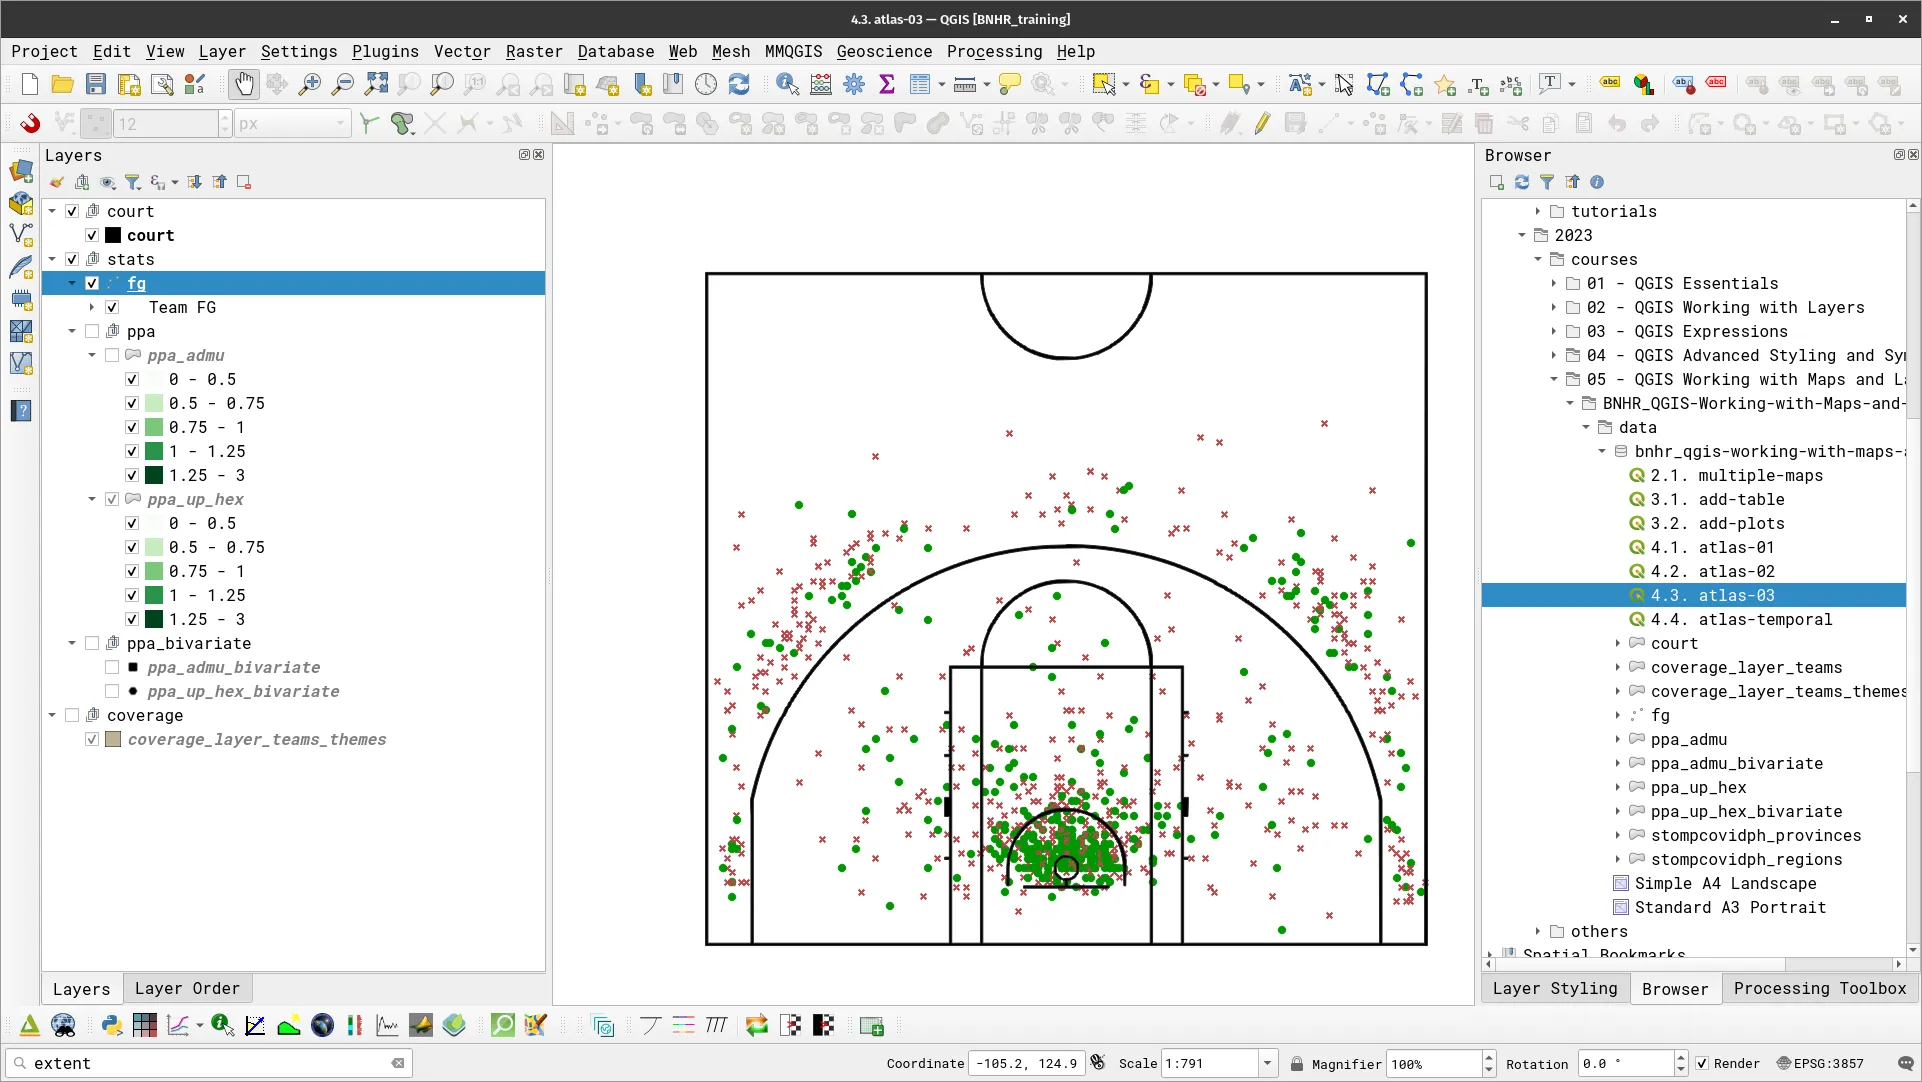
- Load the court, fg, ppa_admu, ppa_up_hex, ppa_admu_bivariate, ppa_up_hex_bivariate, and coverage_layer_teams_themes layers and style them accordingly.
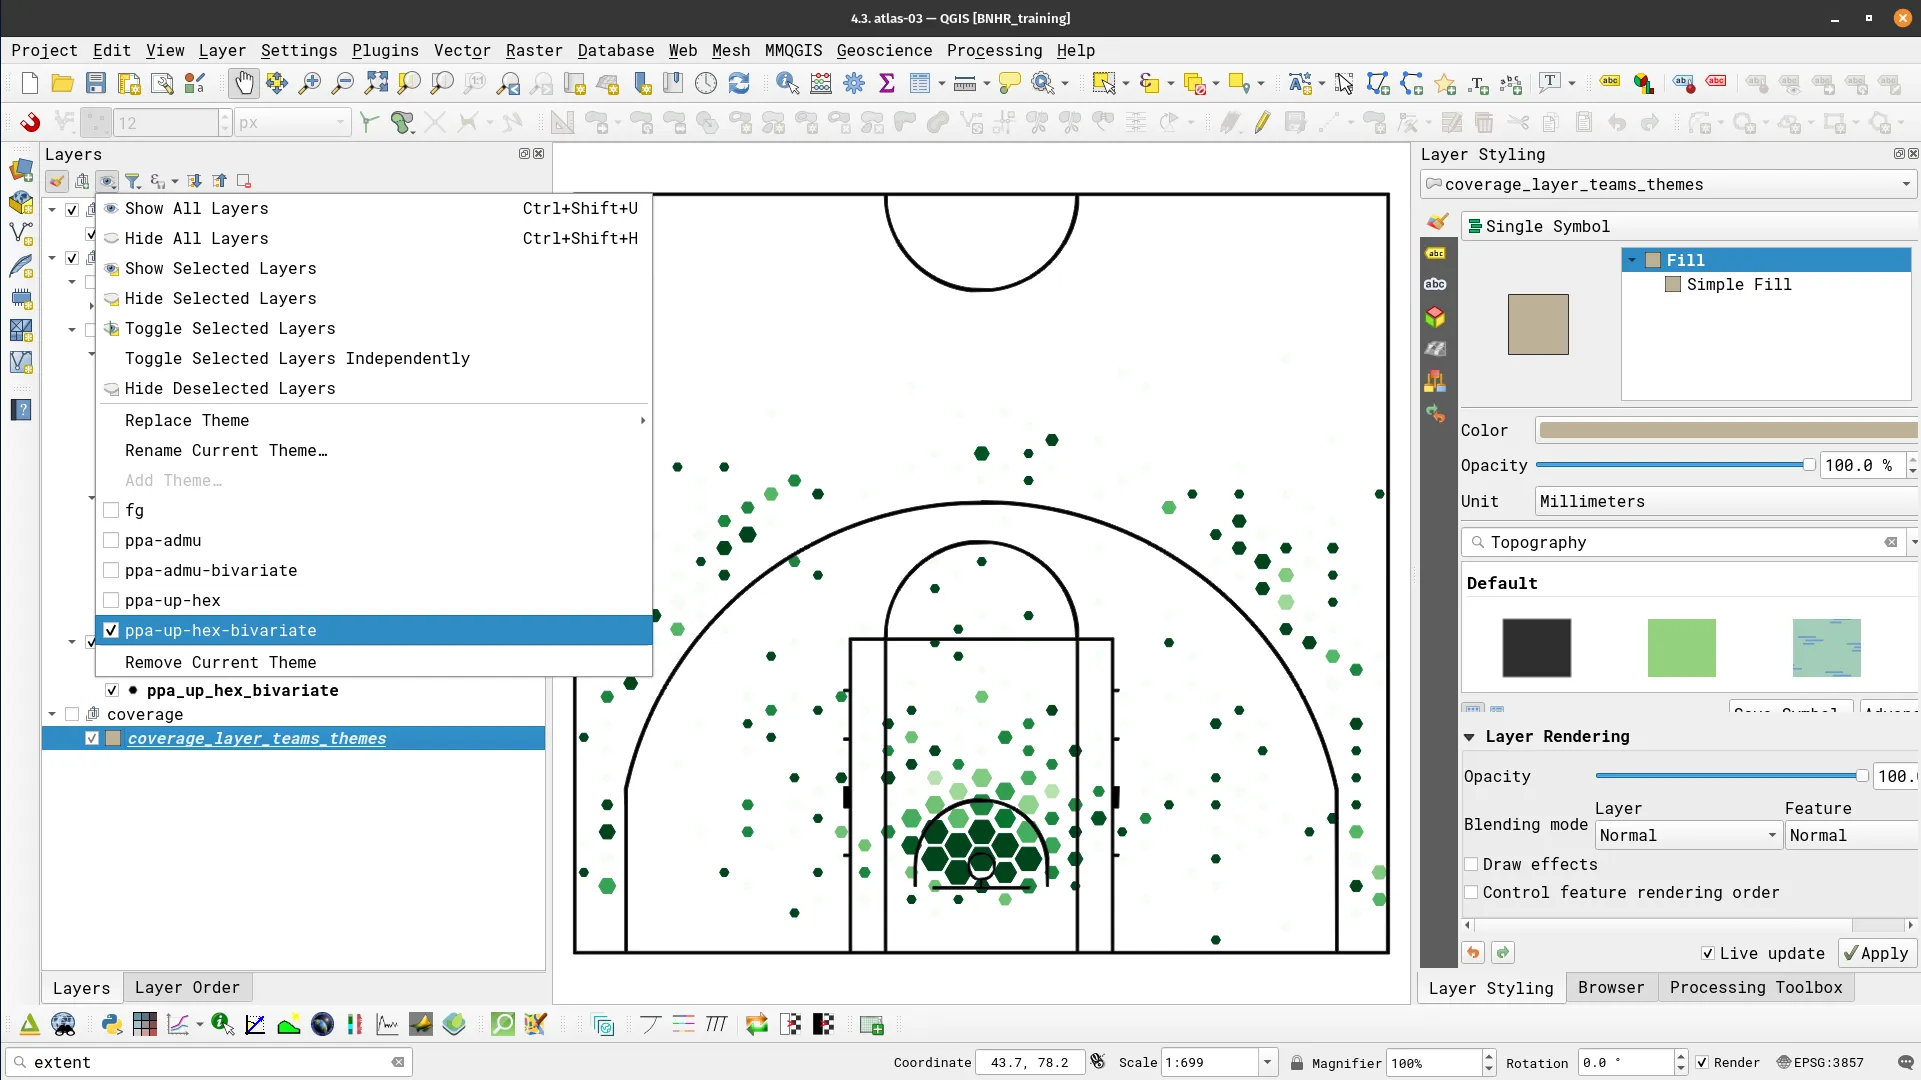
- Create the 5 map themes mentioned previously.
- Create a new layout and add a map.
- Generate an atlas with the following configuration.
- Coverage layer: coverage_layer_teams_themes
- Page name and Sort by:
"theme" || ' - ' || "team"
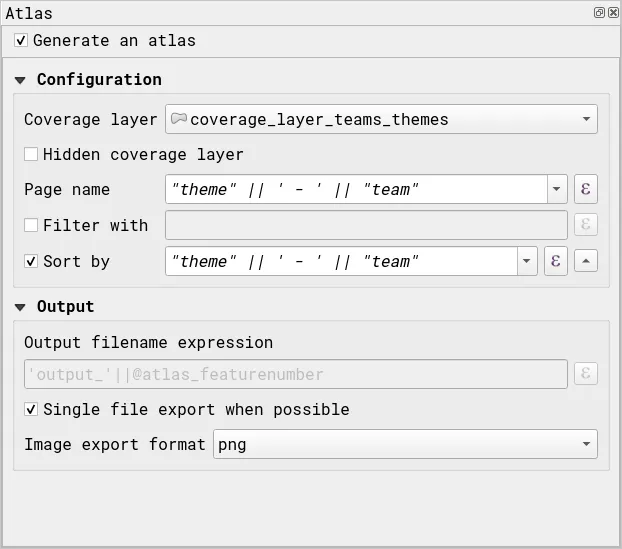
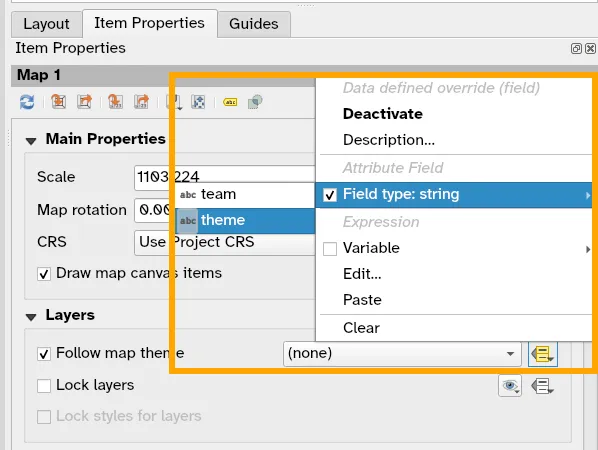
- In the Map’s Item Properties, under Layers, check Follow map theme and use a data-defined override so that the value for this parameter is themes (from the coverage layer attribute table).

- Preview the Atlas, did you do it right?
- Add other data defined elements such as titles and legends.
Atlas that incorporates spatial and temporal elements
Section titled “Atlas that incorporates spatial and temporal elements”Exercise 4.4. Using an atlas to map earthquakes over time
Section titled “Exercise 4.4. Using an atlas to map earthquakes over time”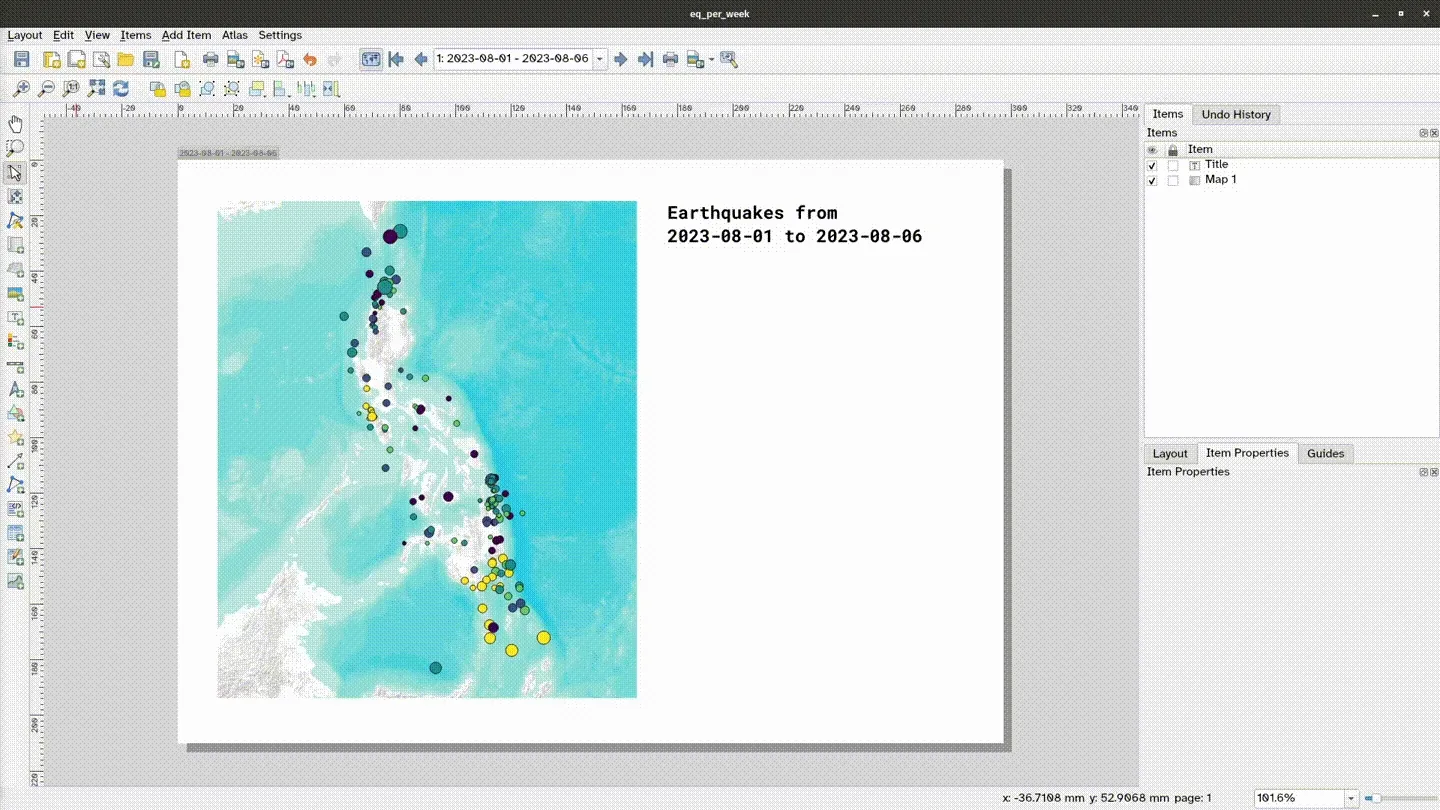
In this exercise, you’ll incorporate the temporal capabilities of QGIS with its Atlas capabilities. What you will do is map the recorded earthquakes for each week of August 2023 in the Philippines as a snapshot in time based on a specified time interval.
To do this, you need:
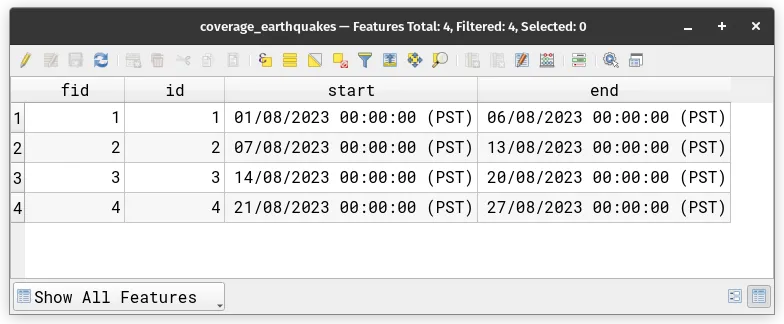
- a coverage layer (coverage_earthquakes) that:
- covers the extent of the Philippines.
- has 4 features (1 for each week of August that will be mapped)
- has a “start” attribute/field corresponding to the start of the week being mapped (datetime type)
- has an “end” attribute/field corresponding to the end of the week being mapped (datetime type)
- The earthquakes layer that has a datatime field specifying the date and time of occurrence of the earthquake.
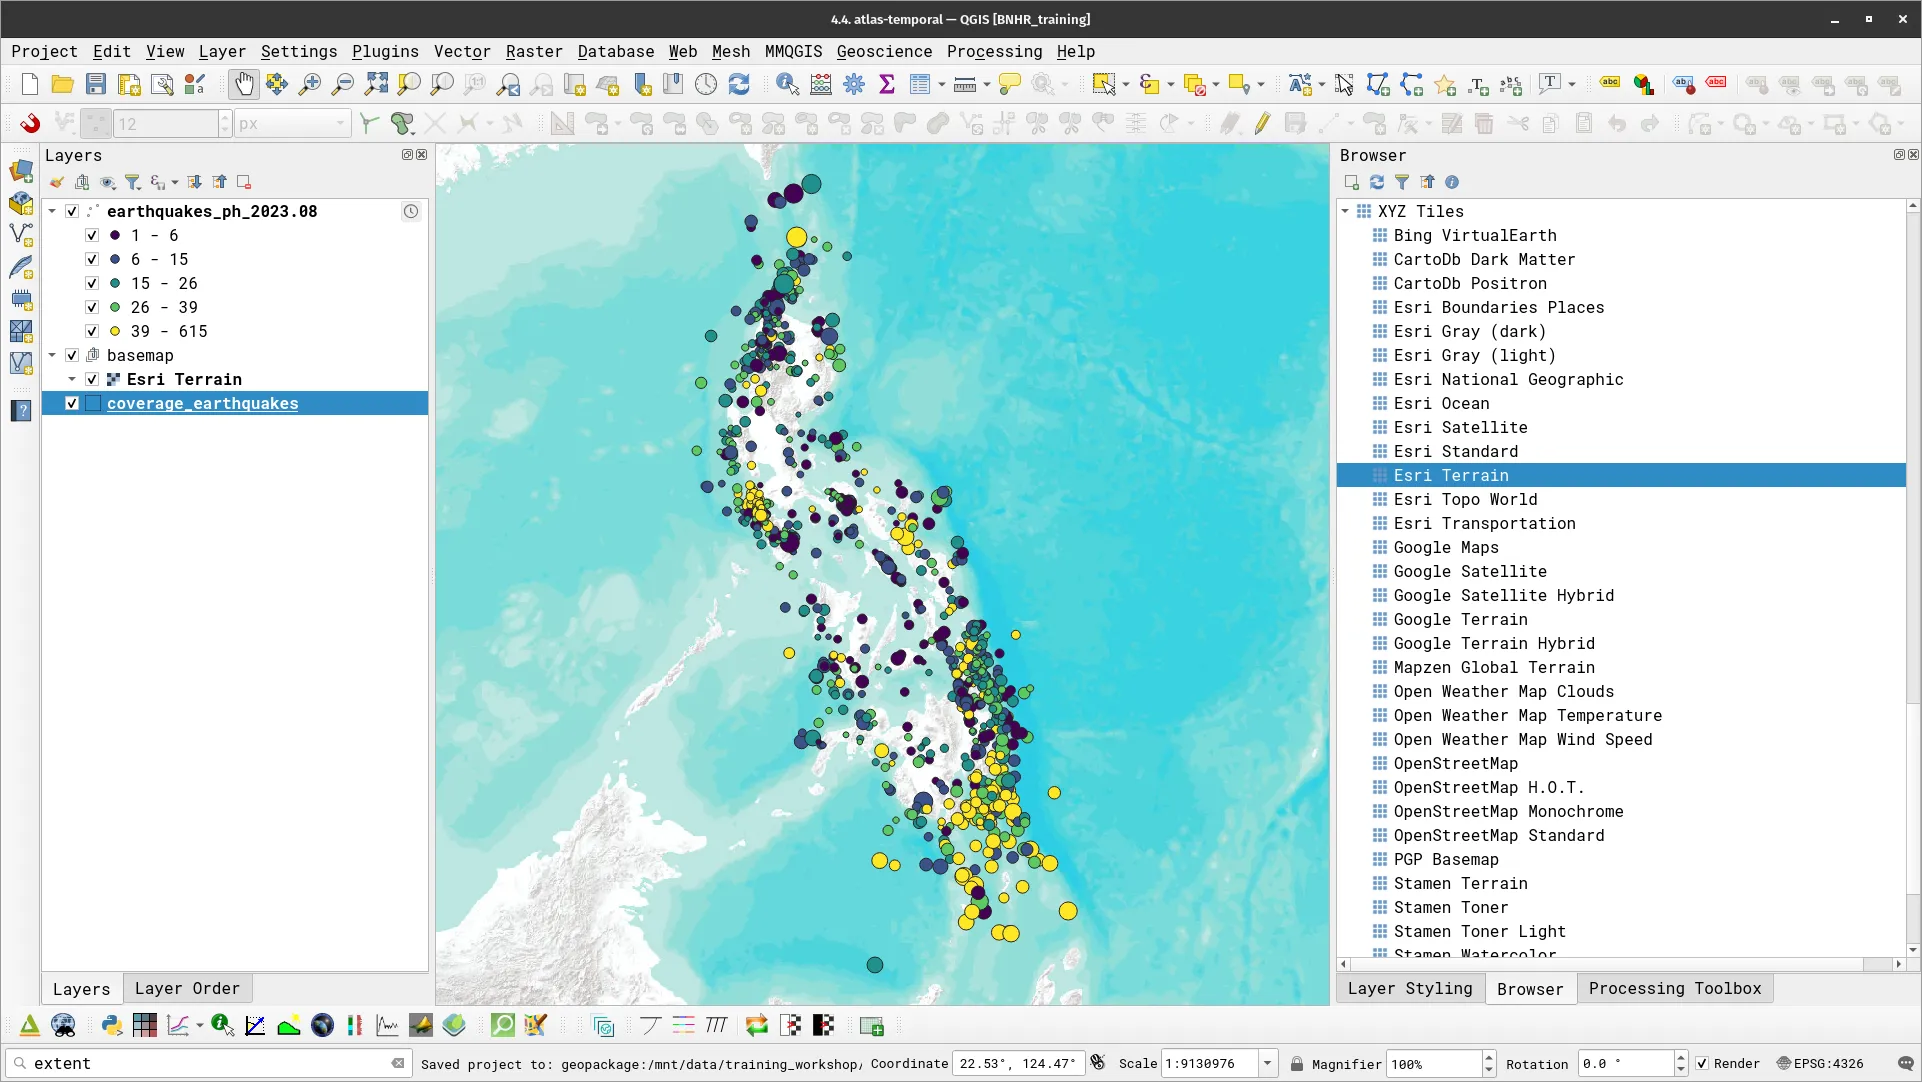
- Load the earthquakes_ph_2023.08 and coverage_earthquakes layer.
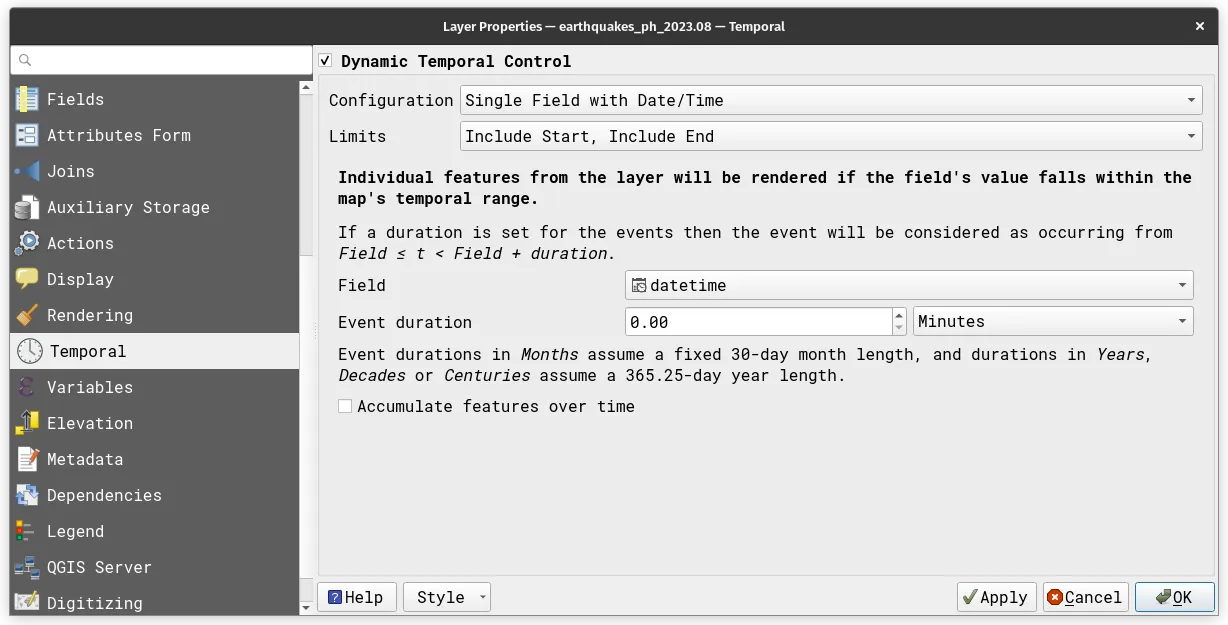
- Style the earthquakes_ph_2023.08 layer and add its temporal settings.
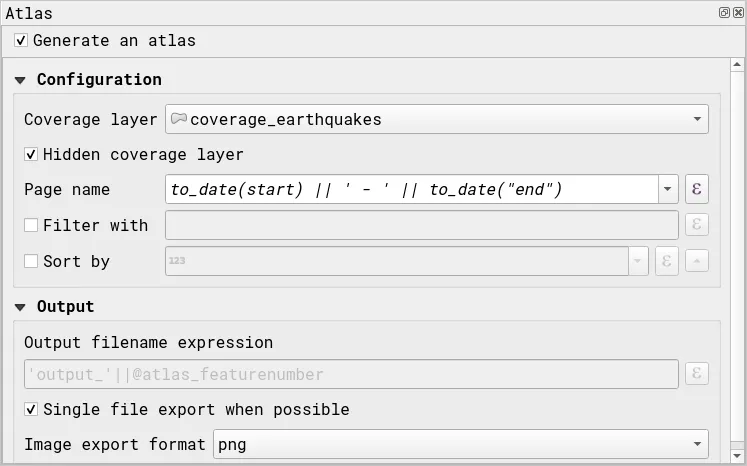
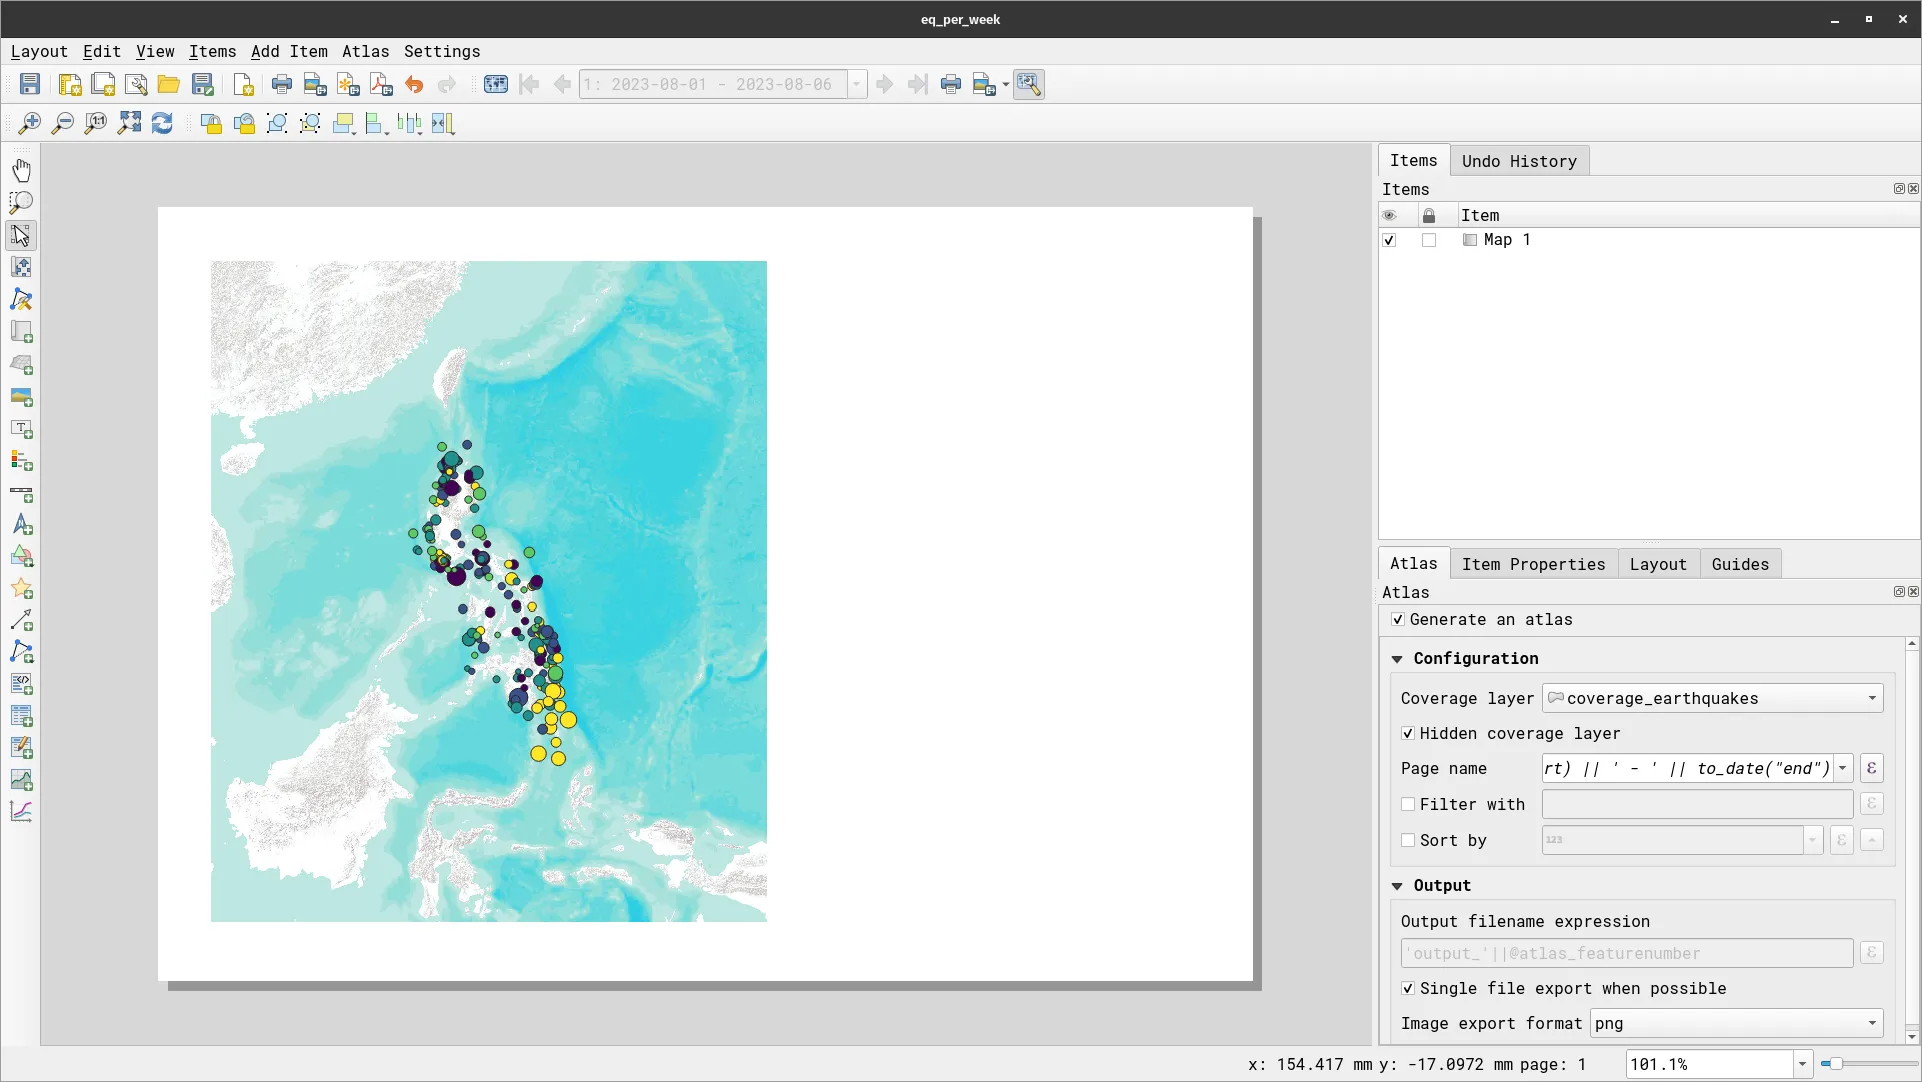
- Create a new layout, add a map, and generate an atlas using the configuration below.
- Coverage layer: coverage_earthquakes
- Page name:
to_date(start) || ' - ' || to_date("end")
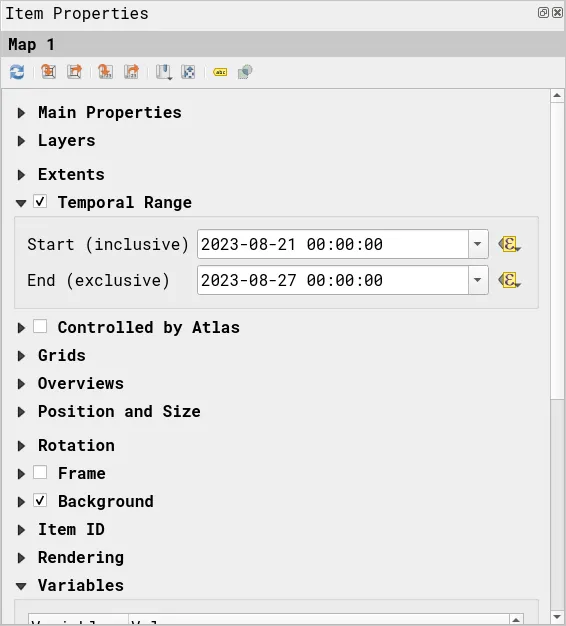
- In the Map Properties, under Temporal Range, use a data-defined override:
- Start (inclusive):
attribute(@atlas_feature, 'start')
- End (inclusive):
attribute(@atlas_feature, 'end')
- Start (inclusive):
- Preview the Atlas. What do you notice?
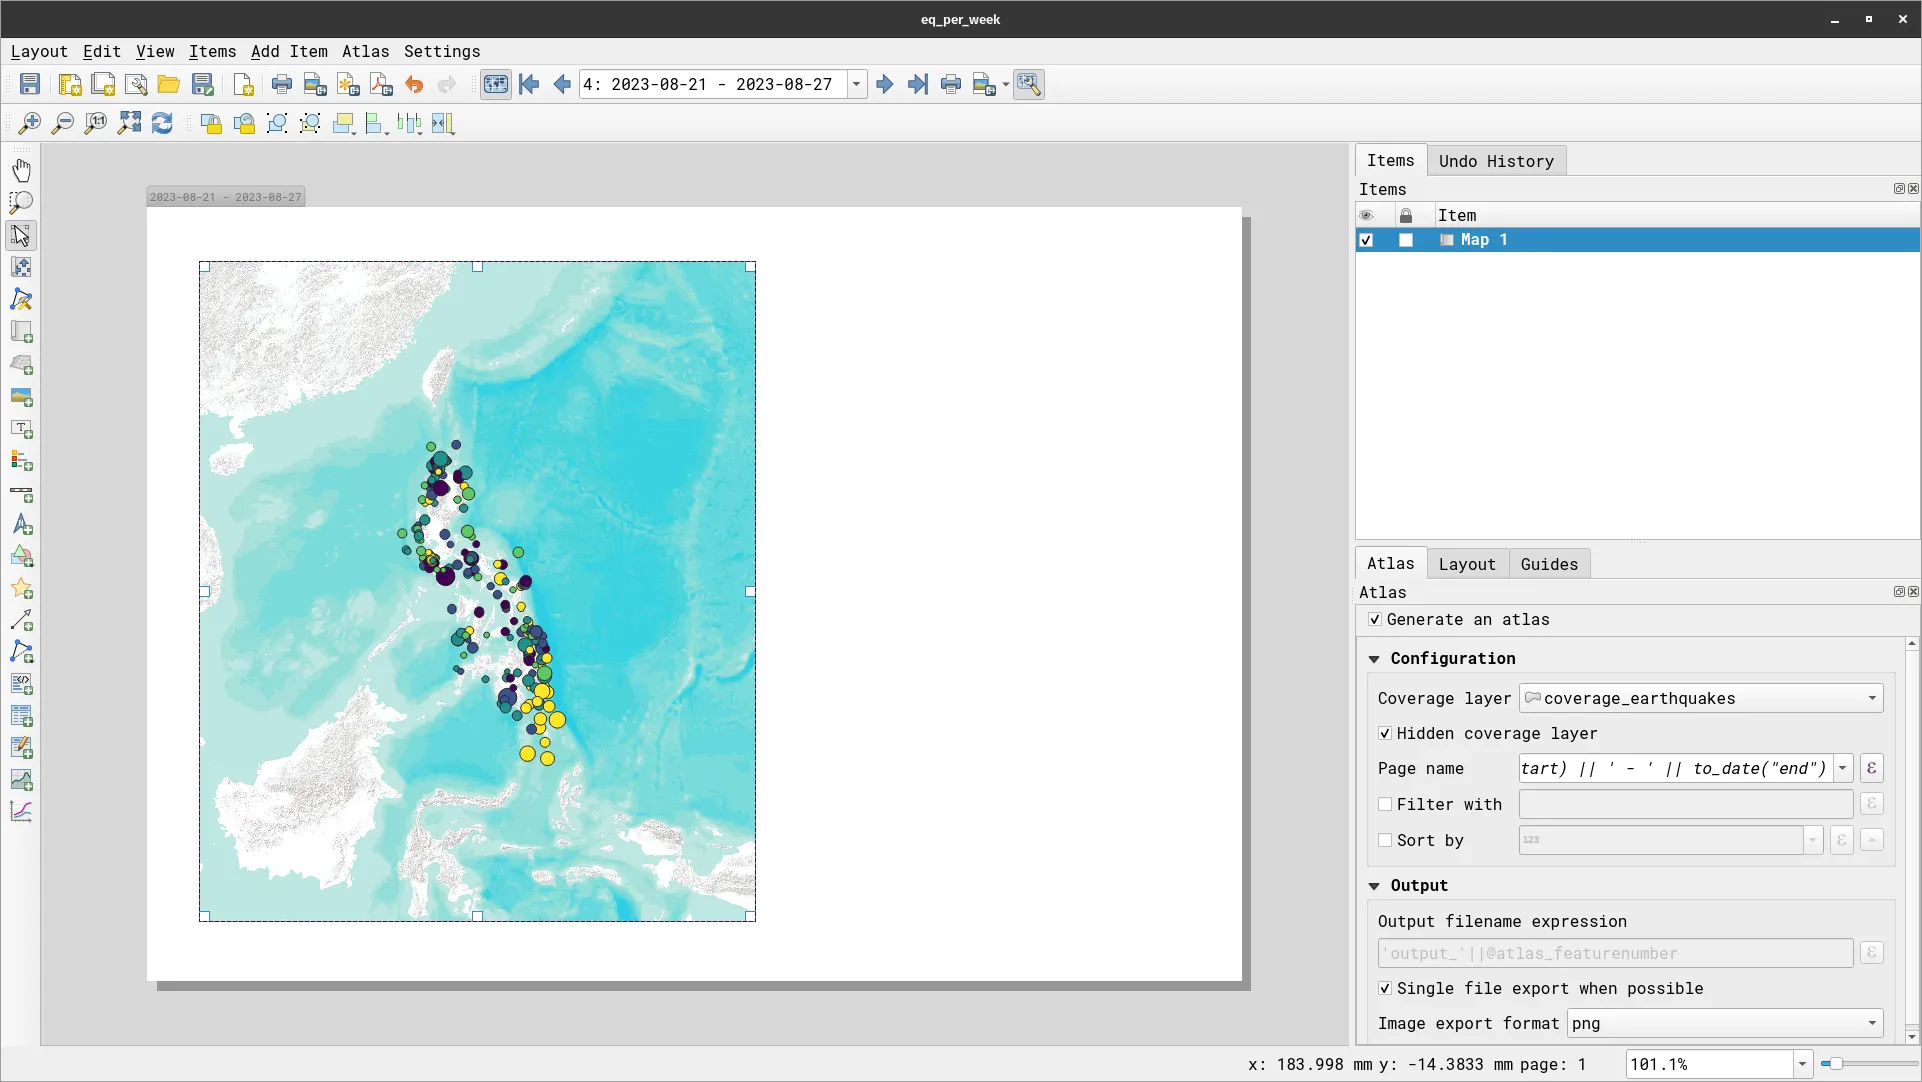
- Add more map elements and data-defined elements to complete your map.
Certification and support
Section titled “Certification and support”Contact us or sign-up to our courses if you are interested in having this as an instructor-led or self-paced course.