

Hex grids, now in GeoPandas 1.2
· geopandas, python, hex-grids, geoparquet, philippines


One line of Python turned the whole Philippines into 1,531 hexagons, each 20 km across. That’s make_grid, new in GeoPandas 1.2.0, released on 28 September 2026 under the BSD-3-Clause license.
Why hexagons? Every cell is the same size, so counting things like schools, health centers, or flood reports per cell compares every part of the map on the same footing. Prefer squares? Set grid_type="square". The grid needs no extra library: if you already use GeoPandas, upgrade and it’s there.
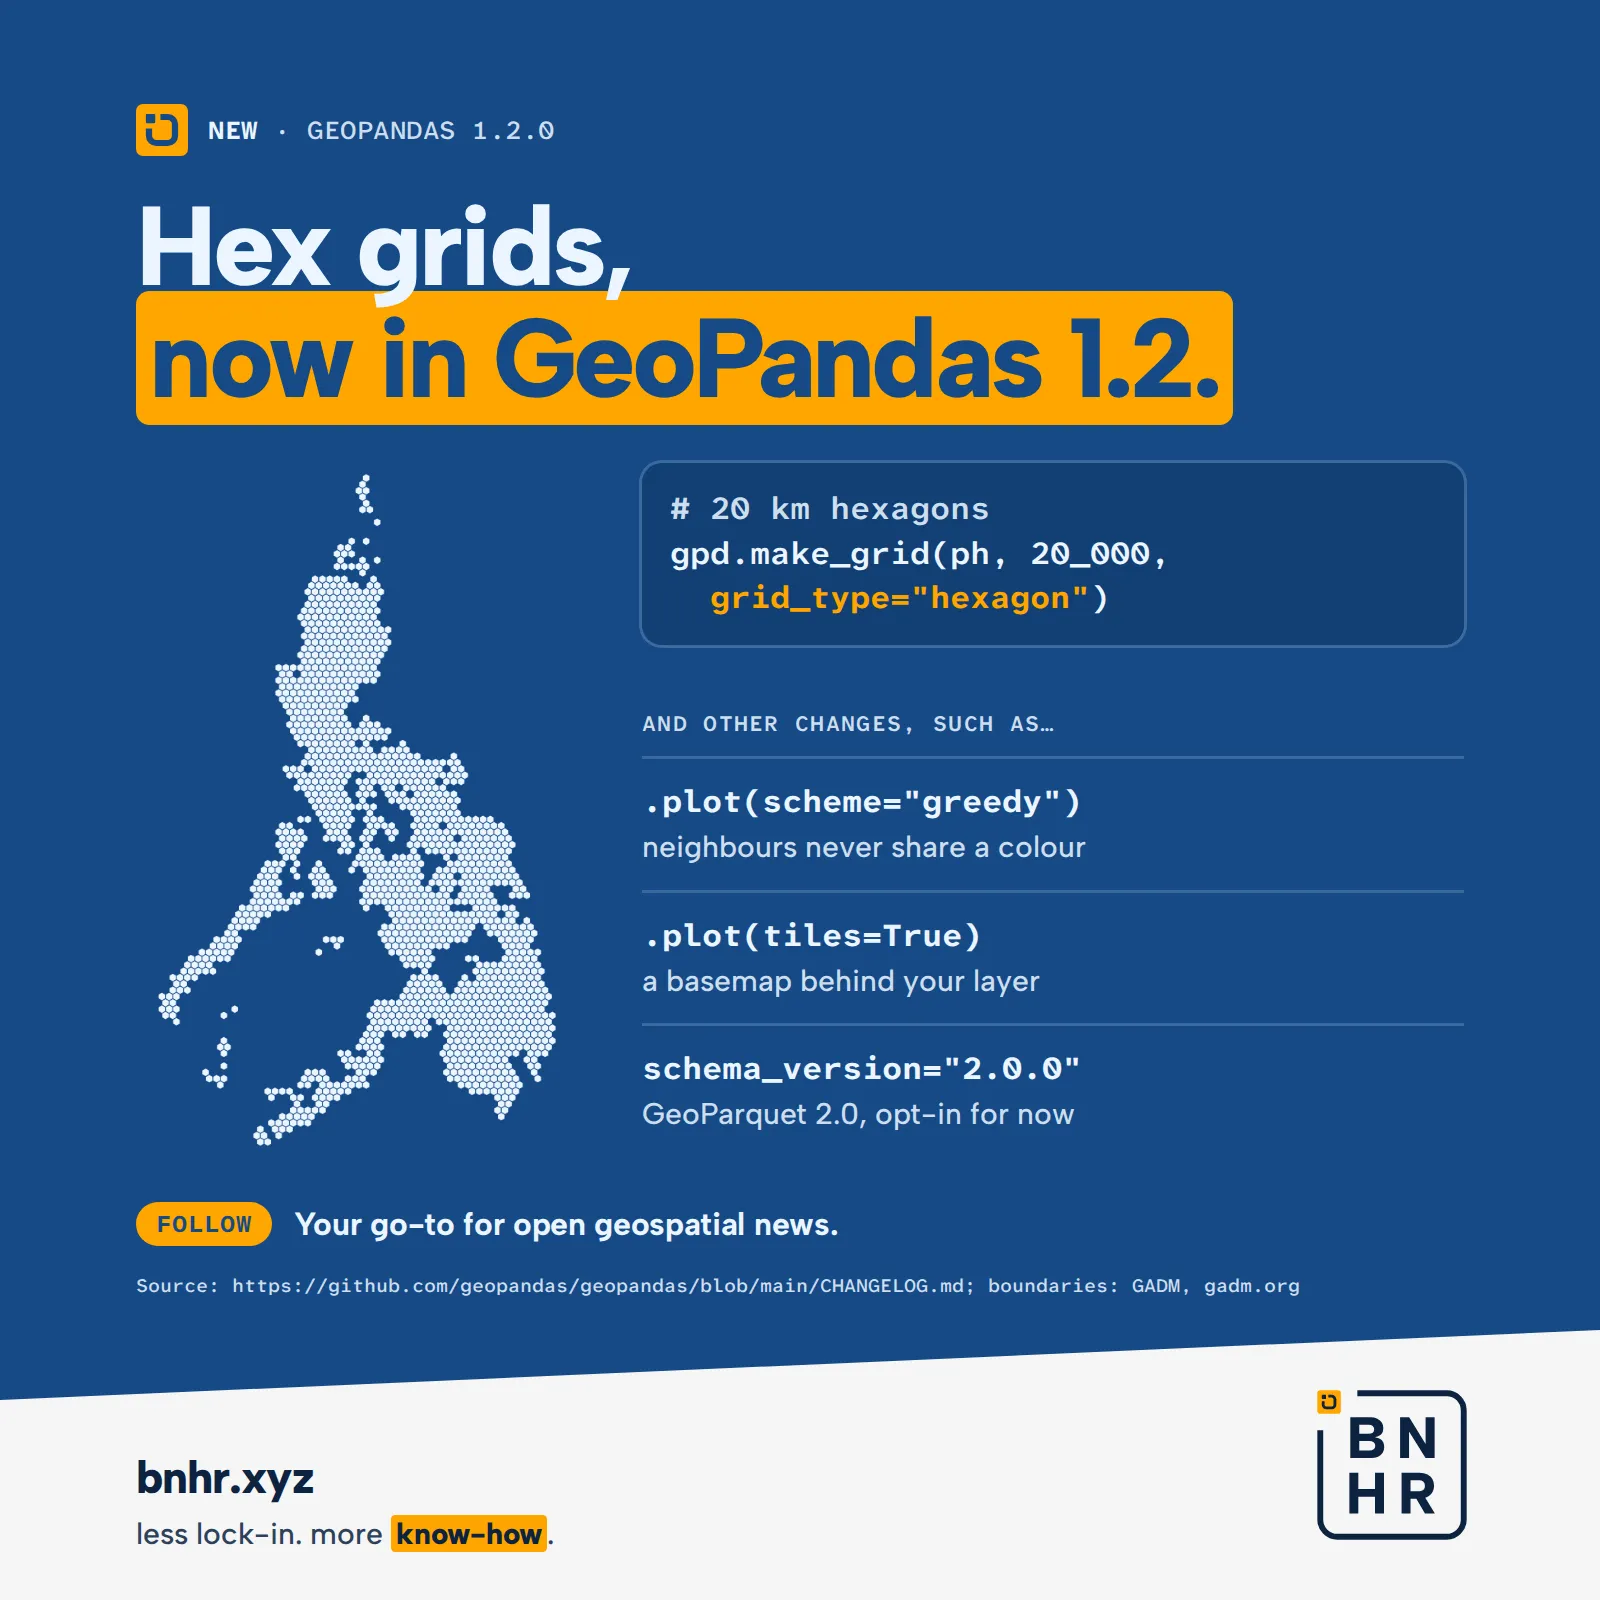
The map is our own run of make_grid over the Philippines: 1,531 hexagons, 20 km from edge to edge. At that size the inner seas (Sibuyan, Visayan, Bohol, and Sulu) stay open, so the islands still read as islands. The changelog describes the new function as generating “a square or hexagonal grids covering the input geometry”, and it comes as both geopandas.make_grid and GeoSeries.make_grid.
The same release brings more than grids:
.plot(scheme="greedy")colors a map so that no two neighboring polygons share a color. It needs themapclassifyandlibpysalpackages, and it can’t be combined withcolumn. By default it aims for at least four colors, and two areas count as neighbors when they share an edge or a corner..plot(tiles=True)draws a basemap behind your layer, throughcontextily.add_basemap, so it needs thecontextilypackage. The default is OpenStreetMap Humanitarian, and the tile source’s own attribution is added unless you passattr.to_parquet(..., schema_version="2.0.0")writes the upcoming GeoParquet 2.0, and GeoPandas reads it too. Writing 2.0 is opt-in: the default stays the latest stable version, 1.1.0, and writing 2.0 needs pyarrow 21 or newer. The spec itself is still a release candidate, v2.0.0-rc.1, published on 19 July 2026; when we checked again on 21 October 2026 there was no final 2.0.0 yet.read_parquetnow opens files straight from http:// and https:// links.
Also in 1.2: static plotting re-implemented (legends, colorbars, and vmin/vmax with scheme), axis labels taken from the CRS’s units, read_file_info, grid_size for overlay operations, and attrs saved in Parquet files.
How we did it
We ran GeoPandas 1.2.0 (with matplotlib 3.11.2 for the plot) on a detailed outline of the Philippines from GADM. We first projected the outline to UTM zone 51N (EPSG:32651), so that distances are in meters, then called geopandas.make_grid(country, 20_000, grid_type="hexagon"). We kept the function’s default output: every whole cell that touches land, none cut at the coast. That returned 1,531 hexagons. Our plot only sets the fill color, the line color, and the line width; the grid is GeoPandas’ own.
There are limits to keep in mind. For hexagons, cell_size is the distance between opposite edges, not between corners. The cells are, in the docstring’s words, a “naive tiling of a plane, not a tiling of the globe (like H3 or S2)”, so project to a metric CRS first, or 20_000 won’t mean 20 km. Because whole cells are kept, cells along the coast reach out over the sea. The GADM outline we used has no Kalayaan islands, so the grid doesn’t cover them. We didn’t render a tiled basemap ourselves; what tiles=True does by default comes from the changelog and the plot docstring.
Sources
- GeoPandas changelog: “Version 1.2.0 (September 28, 2026)”, with
make_grid,scheme="greedy",tiles, GeoParquet 2.0 support, andread_parquetover HTTP/HTTPS - geopandas on PyPI: 1.2.0, released 28 September 2026, license BSD-3-Clause
- GeoParquet releases: v2.0.0-rc.1, a release candidate published on 19 July 2026, still the latest release on 21 October 2026
- The
make_grid,plot, andto_parquetdocstrings in the installed geopandas 1.2.0, andmapclassify.greedyin mapclassify 2.11.0, for the defaults and requirements above - GADM: the outline of the Philippines used for the hex map
Boundaries: GADM, gadm.org. The map is our own output from GeoPandas 1.2.0.
Something new
Try an exercise · QGIS: Essentials
Applying a Single Symbol symbology
Exercise 4.3.1 in Styling layers and making maps.