
The prescribed map layout
Before we begin
Section titled “Before we begin”Before diving into this module’s exercises, it would be good if you can review and familiarize yourself with the Print Layout and the QGIS Atlas.
What we want to achieve
Section titled “What we want to achieve”- Build the prescribed map of the sample application in the Print Layout.
- Read the title, location, area, and tables from the layers, so the map cannot disagree with the shapefiles and the technical description.
- Let the QGIS Atlas drive the same layout.
- Map several applications with one layout.
What we have
Section titled “What we have”- area_boundary and area_corners - the sample application’s shapefiles
- td_lines and tie_point - the technical description lines and the tie line from Module 3
- ref_barangays, ref_municipalities, and ref_provinces - reference administrative boundaries
- sample2_boundary, sample2_corners, sample2_td_lines, and sample2_tie_point - a second, fully prepared fictional application, for the last part of this module
Relevant QGIS knowledge/skills
Section titled “Relevant QGIS knowledge/skills”- Layout templates
- Map themes
- Adding tables to maps
- The QGIS Atlas and data-defined elements
- Merging vectors
- Expressions
The prescribed map format
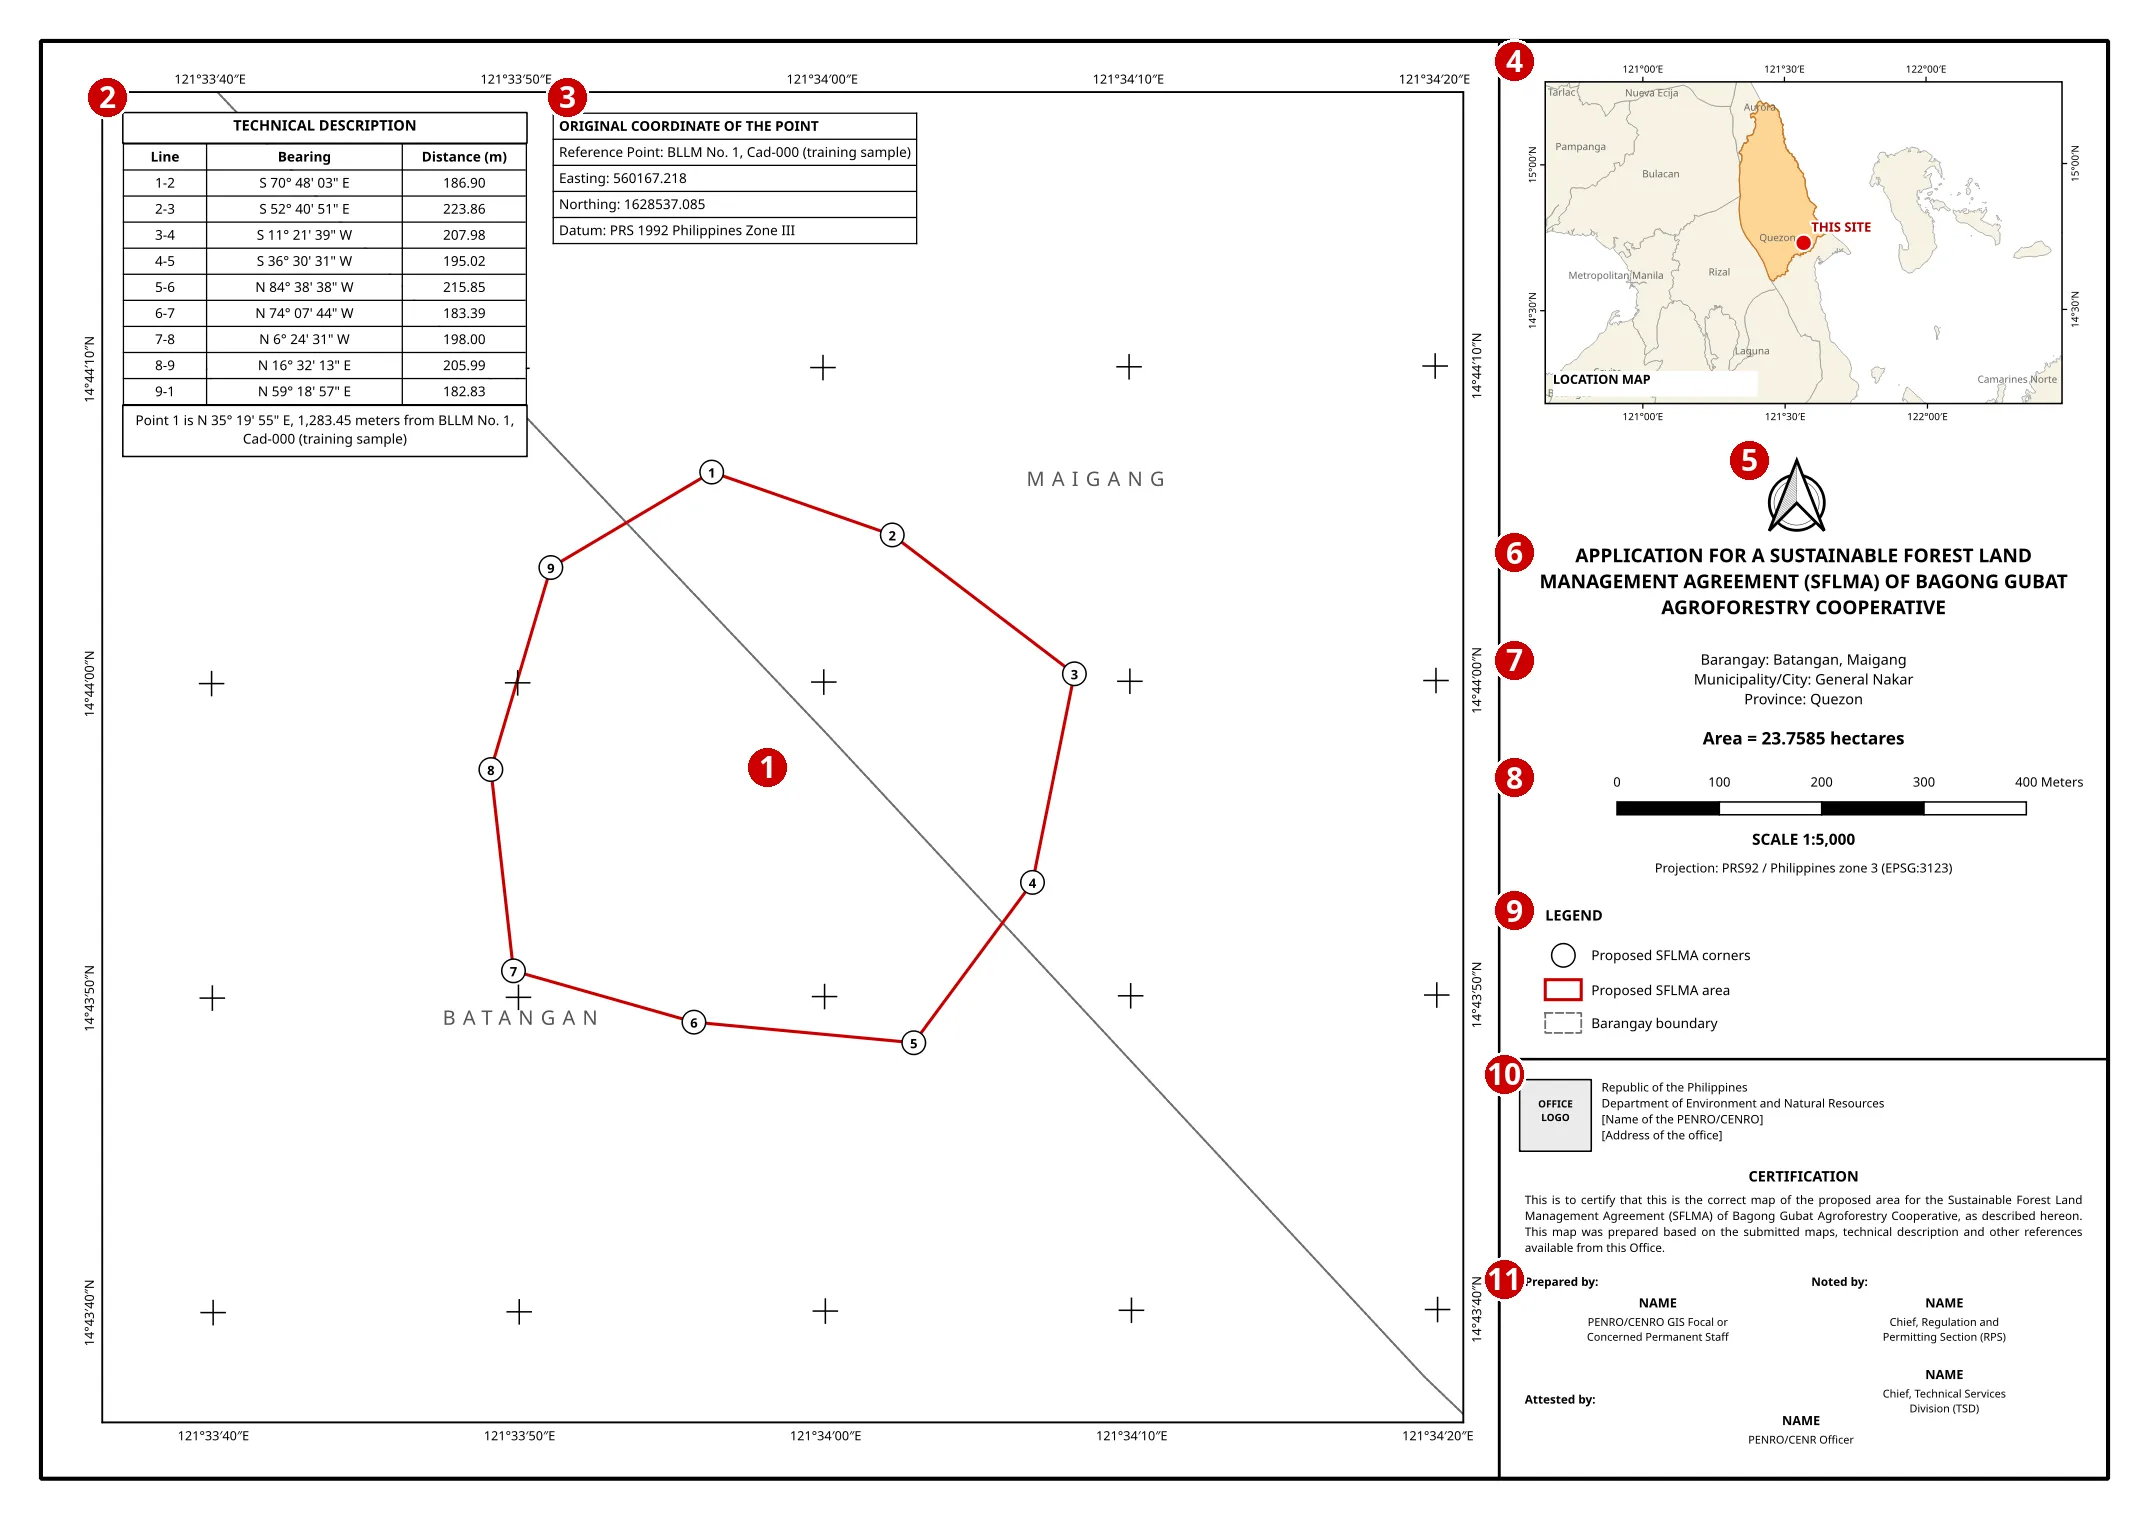
Section titled “The prescribed map format”The guide requires the map to contain the title of the application, location, area, and projection used. The prescribed format for SFLMA applications arranges these elements as follows:
| # | Element | Contents |
|---|---|---|
| 1 | Main map | The application area with numbered corners, barangay boundaries and names, and a grid of latitude and longitude marked with crosses and labelled in degrees, minutes, and seconds |
| 2 | Technical description | Line, bearing, and distance for each side, with the tie line below |
| 3 | Original coordinate of the point | Reference point, easting, northing, and datum and zone |
| 4 | Location map | A small-scale map of the surrounding provinces marking this site, with its frame labelled in latitude and longitude |
| 5 | North arrow | |
| 6 | Title | Application for a Sustainable Forest Land Management Agreement (SFLMA) of the applicant |
| 7 | Location and area | Barangay, municipality/city, and province; area in hectares |
| 8 | Scale and projection | Scale bar, numeric scale, and projection |
| 9 | Legend | Corners, application area, and administrative boundary |
| 10 | Office and certification | Office logo and name; certification statement |
| 11 | Signatories | Prepared by, noted by (two), and attested by |
The signatories in the prescribed format are:
- Prepared by: PENRO/CENRO GIS Focal or Concerned Permanent Staff
- Noted by: Chief, Regulation and Permitting Section (RPS)
- Noted by: Chief, Technical Services Division (TSD)
- Attested by: PENRO/CENR Officer
The map of one application
Section titled “The map of one application”This first version is all that a single application needs. Its labels read the application’s attributes from the area_boundary layer with aggregate(), which works because the layer holds exactly one application.
4.1. Setting up the page and the main map
Section titled “4.1. Setting up the page and the main map”- Create a new print layout and set the page to A3, Landscape (right-click the page ‣ Page Properties).
- In the map canvas, zoom to area_boundary. Add the main map (
 ) on the left side of the page and give it the Item ID main_map.
 - In its Item Properties, set a round Scale that fits the application area, such as 5000. Move the map content (Move Item Content tool) so the area sits below the tables you will add in the top-left corner.
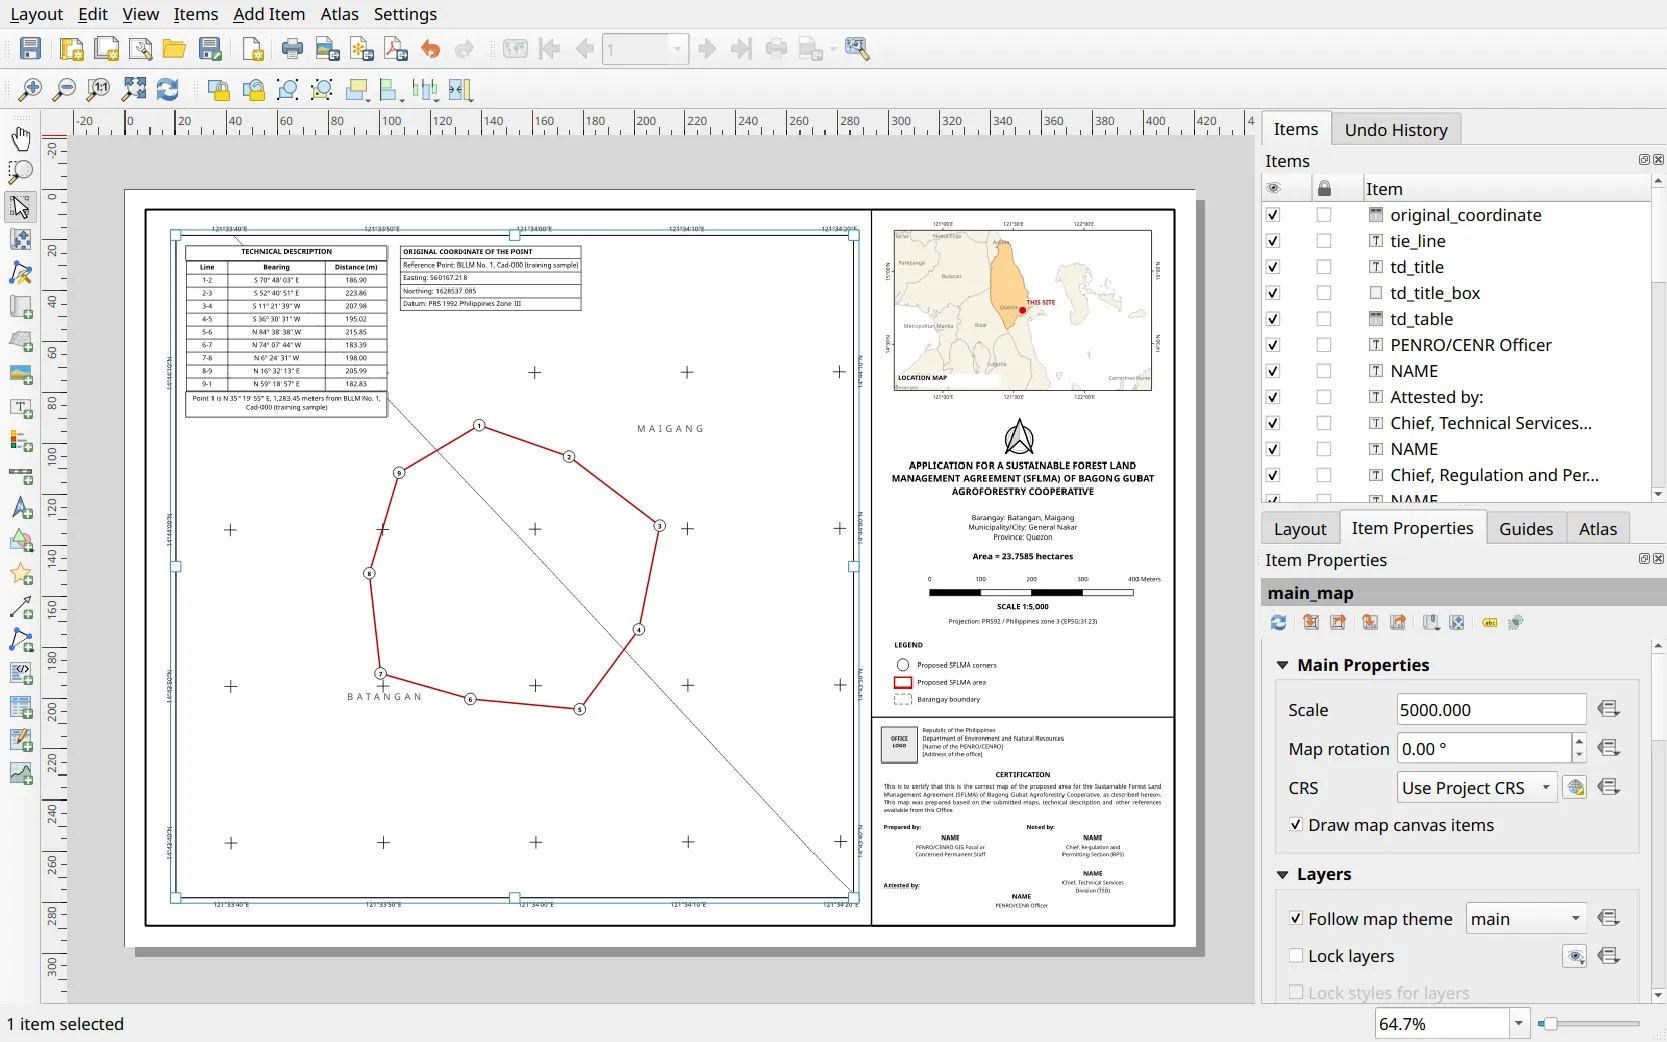
The map stays in the national grid, the CRS of the shapefiles. Its grid is added next, in latitude and longitude.
4.2. Adding the map grid in latitude and longitude
Section titled “4.2. Adding the map grid in latitude and longitude”What we want to achieve
Section titled “What we want to achieve”- A grid of crosses on the main map, labelled along the frame in latitude and longitude (degrees, minutes, and seconds, e.g. 14°44’00”N and 121°34’00”E), as the prescribed map requires.
A map grid is drawn in its own CRS, which does not have to be the map’s. The main map stays in the national grid (EPSG:3123), so the shapefiles, tables, and scale are untouched; only the grid is set to a geographic CRS, so its lines follow latitude and longitude instead of eastings and northings.
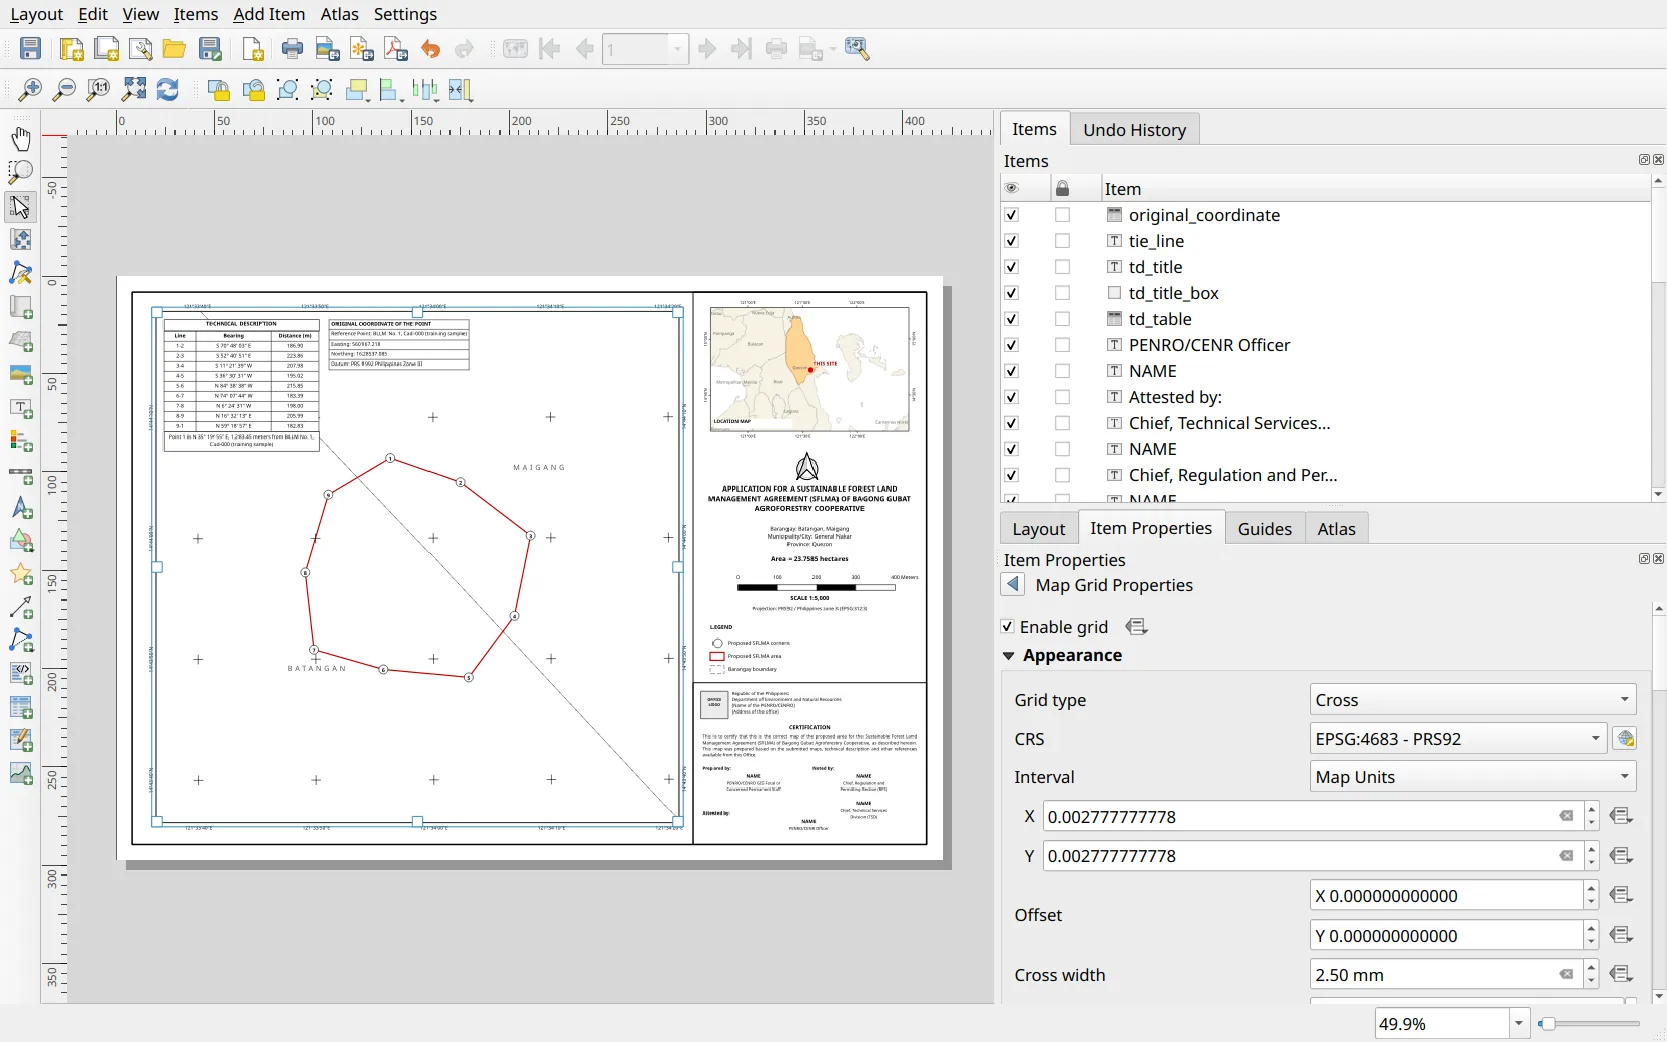
- Select main_map. Under Grids, click the green plus button to add a grid, rename it latitude and longitude, and click Modify Grid….
- Under Appearance, set:
- Grid type: Cross, with a Cross width of 2.50 mm
- CRS: click the CRS button and select EPSG:4683 - PRS92 (or EPSG:4253 - Luzon 1911 for a Luzon 1911 map)
- Interval: Map Units, with X and Y both 0.002777777778. Map units are now the grid CRS’s units, degrees, and 0.002777777778° is 10 seconds (10 ÷ 3600).
- Under Frame, set the Frame style to Line Border.
- Check Draw Coordinates and set:
- Format: Degree, Minute, Second Aligned (it pads the minutes and seconds, so 121°34’00”E rather than 121°34’0”E)
- Left and Right: Show Latitude/Y Only, Outside Frame, Vertical Ascending
- Top and Bottom: Show Longitude/X Only, Outside Frame, Horizontal
- Coordinate precision: 0
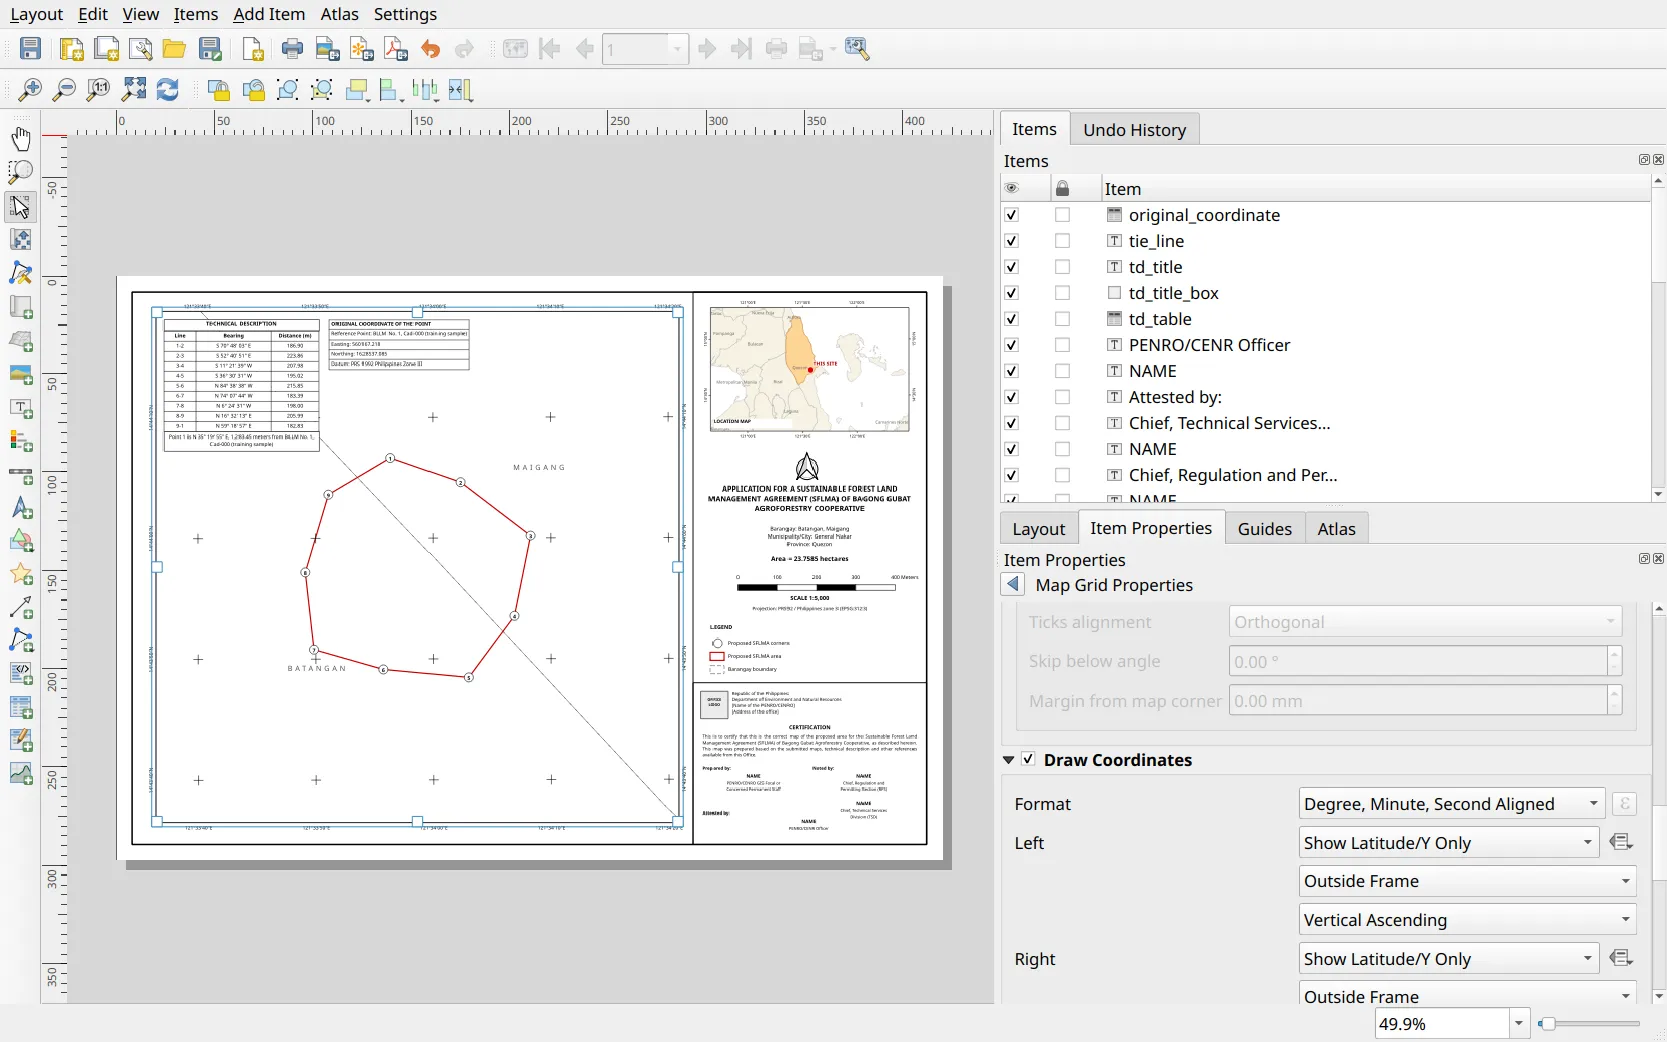
- Check the map: the crosses fall on every 10 seconds of latitude and longitude, and the labels read 14°43’40”N to 14°44’10”N and 121°33’40”E to 121°34’20”E.
4.3. Styling the application area and its corners
Section titled “4.3. Styling the application area and its corners”- Style area_boundary with a red outline and no fill.
- Style area_corners as white circles with a black outline, labelled with T_CORNER over the point.
- Style ref_barangays with a dashed gray outline and no fill, labelled with the barangay name in capital letters (
upper("barangay")) with wide letter spacing. - Create a map theme (
 ) named main with only these three layers visible, and set the main map to Follow map theme: main.
4.4. Adding the technical description and original coordinate tables
Section titled “4.4. Adding the technical description and original coordinate tables”- Add an attribute table (
 ) inside the top-left corner of the main map, set its Layer to td_lines, and click Attributes…. Keep only LINE, BEARING, and DISTANCE, with the headings Line, Bearing, and Distance (m), centered.
 - Still in Attributes…, replace DISTANCE’s attribute with an expression so it always shows two decimals (186.90, not 186.9):
format_number("DISTANCE", 2)- Under Sorting, add SEQ, ascending.
- Set a white background and show the grid lines. Resize the table’s frame until all the lines fit.
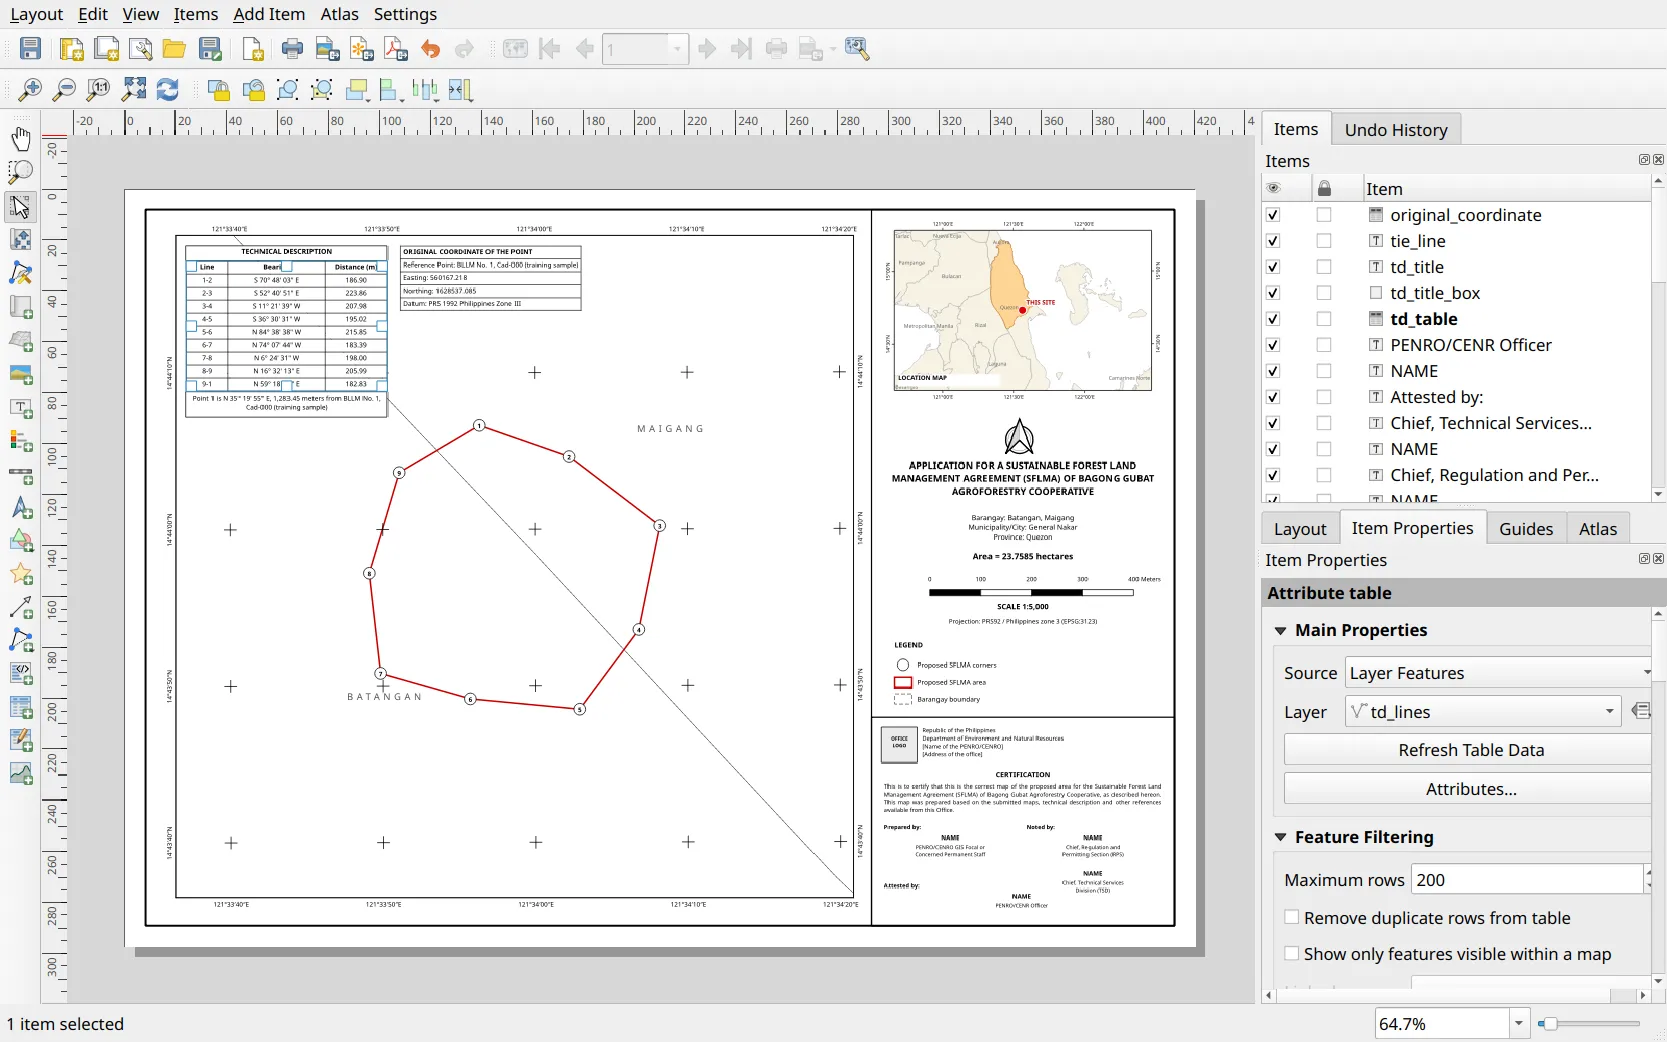
- Add a label (
 ) with the title TECHNICAL DESCRIPTION above the table, and another directly below it for the tie line:
[% aggregate('tie_point', 'max', "TIE_LINE") %]- Add a fixed table (Add Item ‣ Add Fixed Table) to the right of the technical description, with the heading ORIGINAL COORDINATE OF THE POINT and four rows. Set each cell to an expression (Insert Expression in the table editor):
'Reference Point: ' || aggregate('tie_point', 'max', "ref_point")'Easting: ' || format_number(aggregate('tie_point', 'max', "easting"), 3, omit_group_separators:=true)'Northing: ' || format_number(aggregate('tie_point', 'max', "northing"), 3, omit_group_separators:=true)'Datum: ' || aggregate('tie_point', 'max', "datum")4.5. Building the title block from the layer’s attributes
Section titled “4.5. Building the title block from the layer’s attributes”What we want to achieve
Section titled “What we want to achieve”- A title, location, and area that are read from the area boundary’s attributes, so they cannot disagree with the shapefile.
- Add a label () for the title, with the Item ID title:
[% 'APPLICATION FOR A SUSTAINABLE FOREST LAND MANAGEMENT AGREEMENT (SFLMA) OF ' || upper(aggregate('area_boundary', 'max', "NAME")) %]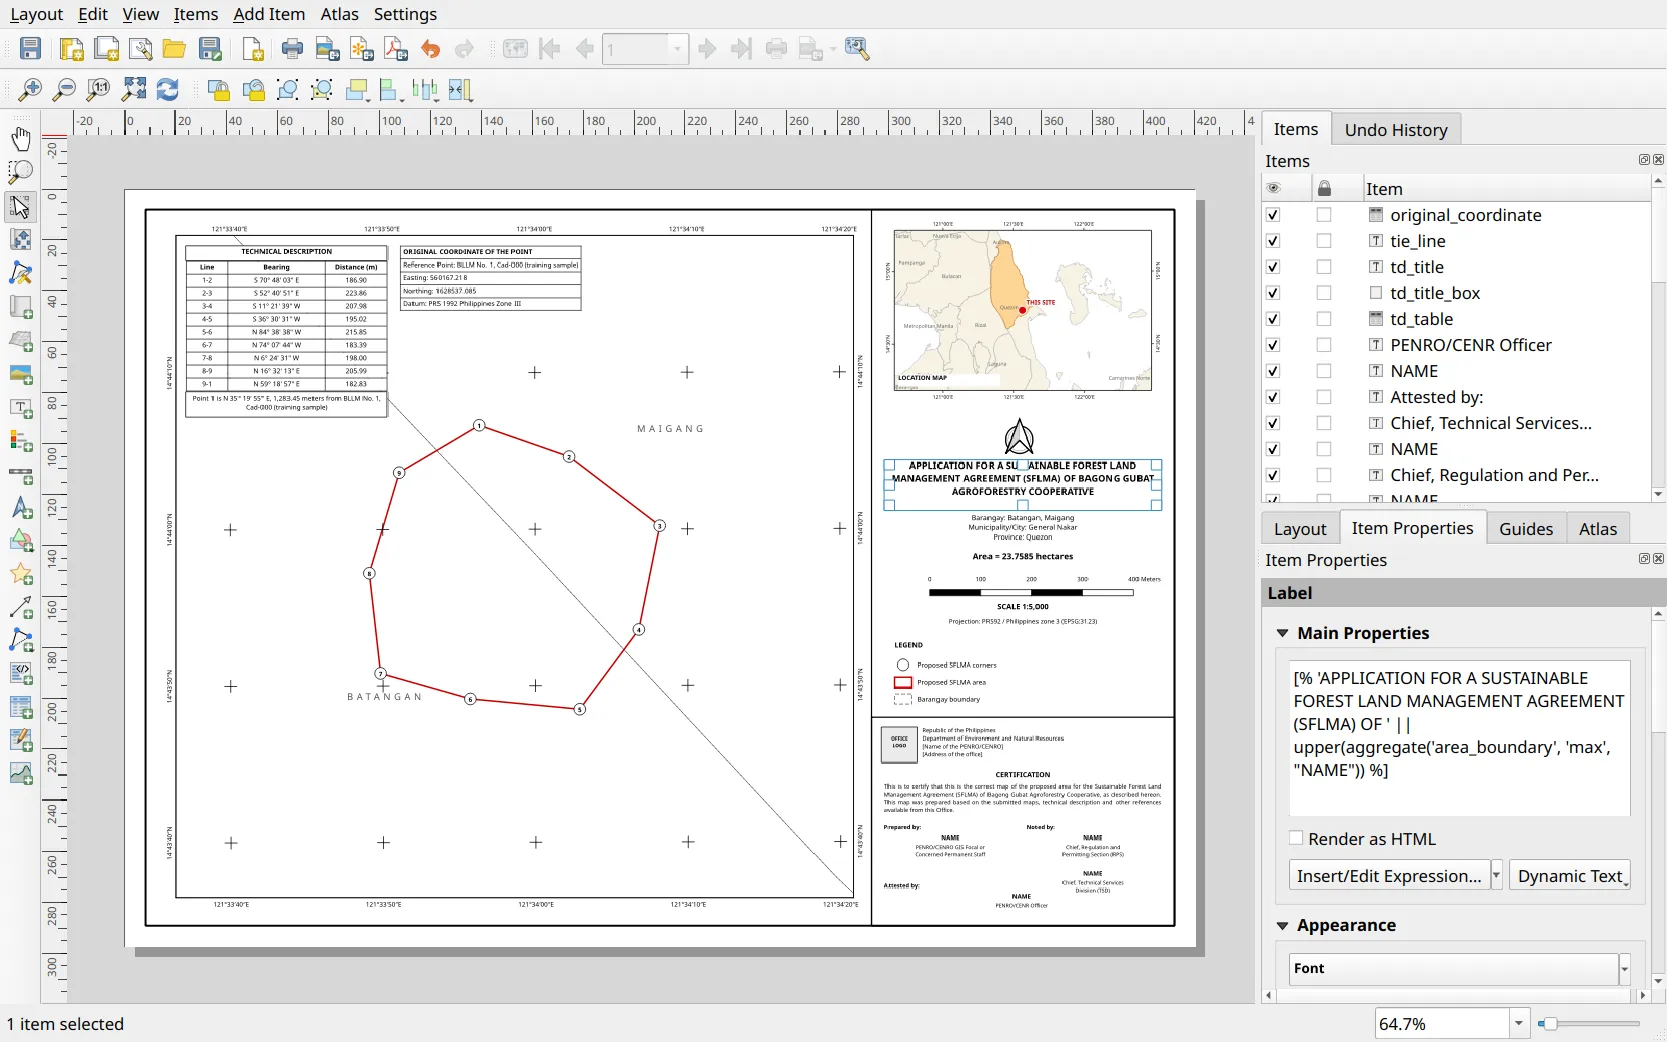
- Add a label for the location. Multiple barangays are stored as Batangan,Maigang; the label adds a space after each comma for readability:
[% 'Barangay: ' || replace(aggregate('area_boundary', 'max', "BARANGAY"), ',', ', ')|| '\nMunicipality/City: ' || replace(aggregate('area_boundary', 'max', "MUNI_CTY"), ',', ', ')|| '\nProvince: ' || aggregate('area_boundary', 'max', "PROVINCE") %]- Add a label for the area:
[% 'Area = ' || aggregate('area_boundary', 'max', "AREA") || ' hectares' %]- Add a north arrow (Add Item ‣ Add North Arrow) and a scale bar (
 ) in meters, linked to main_map, with four segments of 100 m.
 - Add labels for the numeric scale and the projection, read from the main map:
[% 'SCALE 1:' || format_number(map_get(item_variables('main_map'), 'map_scale'), 0) %][% 'Projection: ' || map_get(item_variables('main_map'), 'map_crs_description') || ' (' || map_get(item_variables('main_map'), 'map_crs') || ')' %]4.6. Adding the location map
Section titled “4.6. Adding the location map”- Duplicate area_boundary in the Layers panel (right-click ‣ Duplicate Layer) and name the copy location_marker. Style it with a Geometry Generator marker at
centroid($geometry)(a red dot) and a label with the text'THIS SITE'. - Style ref_provinces with a light fill, labelled with the province names. Style ref_municipalities with a Rule-based symbology whose only rule highlights the municipality the application is in:
overlay_intersects('area_boundary')- Create a map theme named location with ref_provinces, ref_municipalities, and location_marker visible.
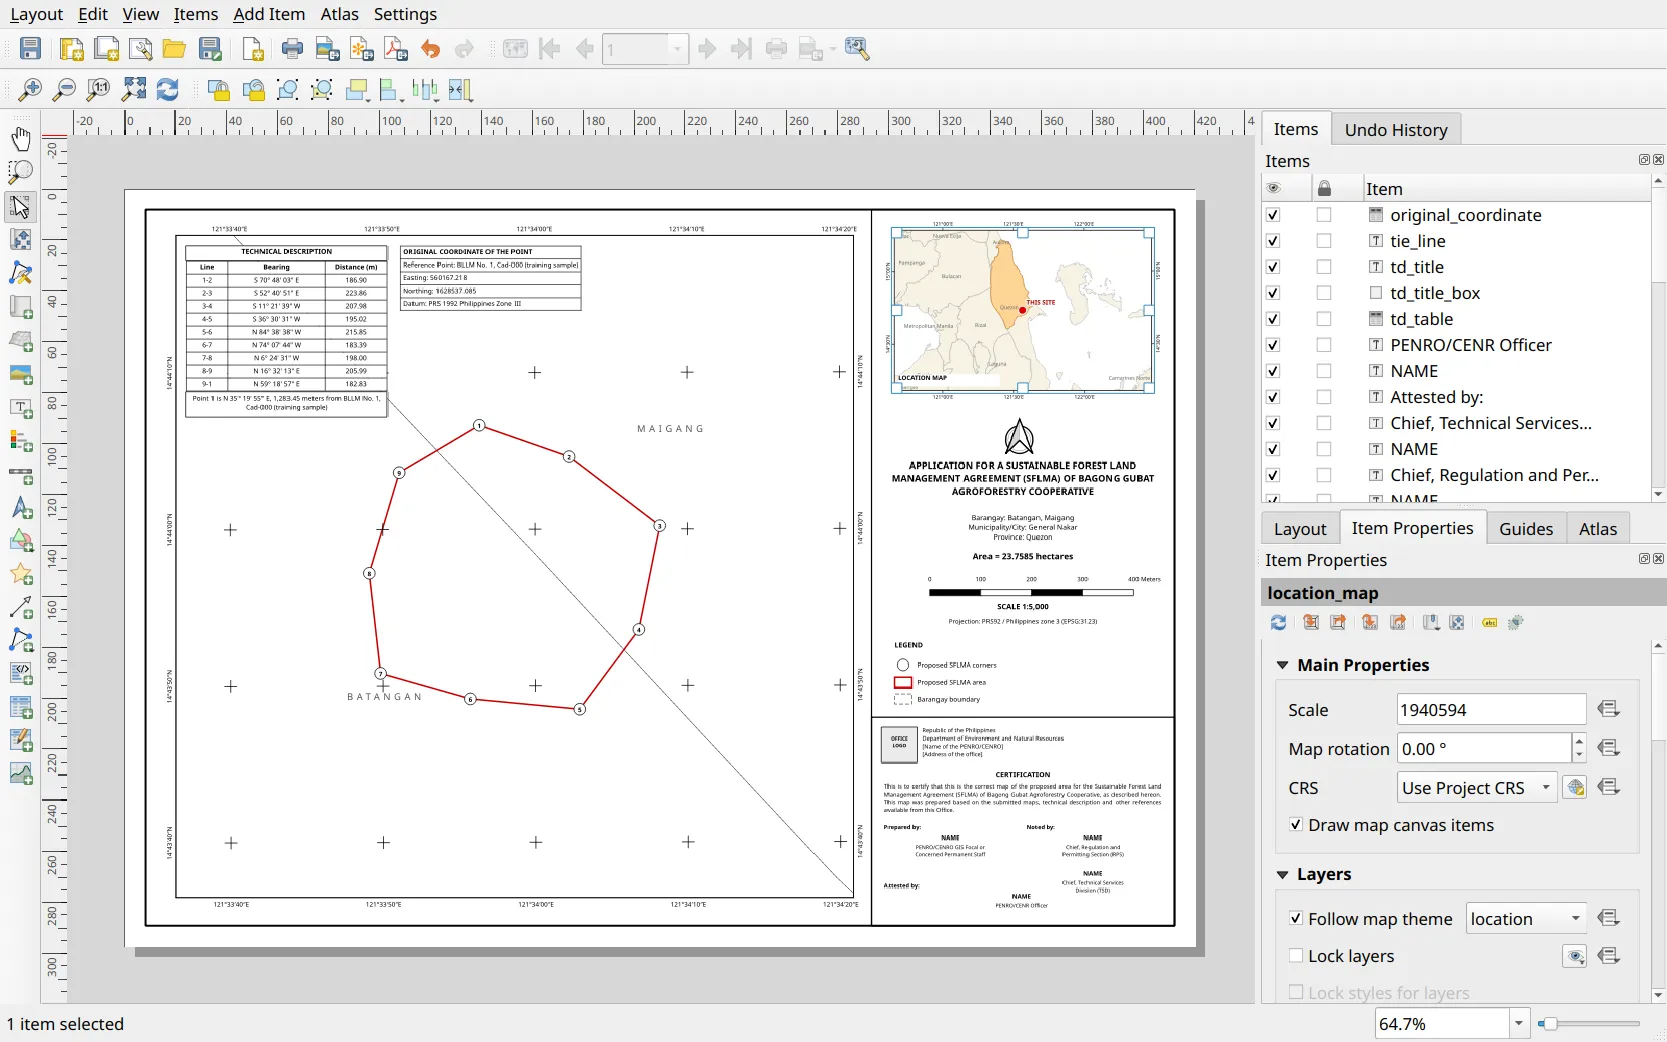
- Add a second map in the top-right of the page that follows the location theme, at a scale that shows the neighboring provinces, with a LOCATION MAP label.
- The prescribed format labels the location map’s frame in latitude and longitude too. Add a grid to location_map as in Adding the map grid in latitude and longitude, but with Grid type Frame and annotations only, Interval 0.5 map units (30 minutes), Format Degree, Minute Aligned, and Frame style Exterior Ticks. Leave a few millimeters around the map for the labels.
4.7. Adding the legend, certification, and signatories
Section titled “4.7. Adding the legend, certification, and signatories”- Add a legend (
 ), uncheck Auto update, and keep only area_corners, area_boundary, and ref_barangays, renamed Proposed SFLMA corners, Proposed SFLMA area, and Barangay boundary.
 - Add the office logo and name.
- Add the certification statement as a label that reads the applicant’s name:
[% 'This is to certify that this is the correct map of the proposed area for the Sustainable Forest Land Management Agreement (SFLMA) of ' || aggregate('area_boundary', 'max', "NAME") || ', as described hereon. This map was prepared based on the submitted maps, technical description and other references available from this Office.' %]- Add the signatories in the prescribed order.
4.8. Saving and reusing the layout template
Section titled “4.8. Saving and reusing the layout template”- Save the layout as a template (Layout ‣ Save as Template…). The completed template is SFLMA-prescribed-map.qpt in the outputs folder.
- For a new application, load its layers and name them area_boundary, area_corners, td_lines, and tie_point, as in this course. The template’s expressions find the layers by these names.
- Create a layout from the template (Project ‣ Layout Manager, choose Specific under New from Template, and select the .qpt file).
- Check the technical description table’s Layer, zoom the main map to the new application, and move the tie line label directly below the table if the new technical description has a different number of lines. The title, location, area, tables, and certification update without retyping.
4.9. Exporting the map
Section titled “4.9. Exporting the map”- Export the map with Layout ‣ Export as PDF… (
 ), e.g. as
 IV-A_SFLMA_Map_Bagong Gubat Agroforestry Cooperative.pdf. - Open the PDF and check every element against the prescribed format.
Letting the atlas drive the layout
Section titled “Letting the atlas drive the layout”The layout above works, but every new application means re-zooming the map and checking each label. With the QGIS Atlas ( ), the area boundary becomes the coverage layer: the main map follows the application on its own, labels read its attributes directly (
"NAME" instead of aggregate('area_boundary', 'max', "NAME")), and the PDF is named from its attributes.
4.10. Turning on the atlas
Section titled “4.10. Turning on the atlas”- Open Atlas ‣ Atlas Settings, check Generate an atlas, and set the Coverage layer to area_boundary. Set the Output filename expression to:
"REGION" || '_SFLMA_Map_' || "NAME"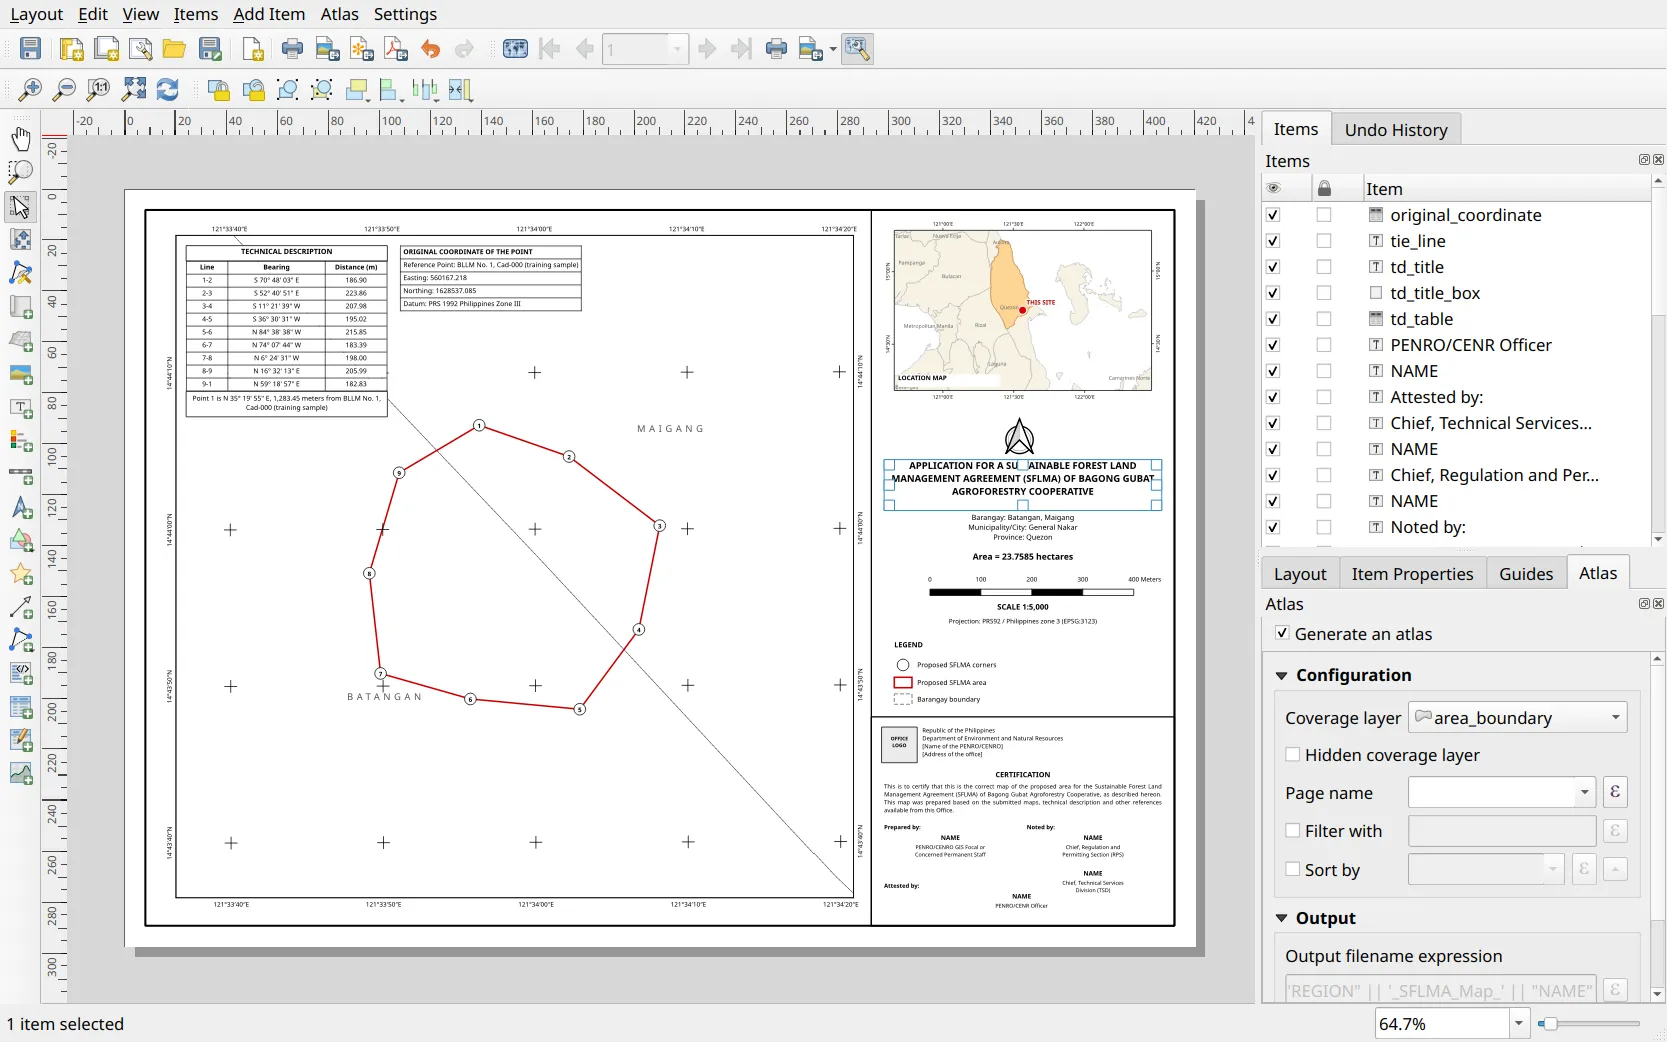
- Select the main map and check Controlled by Atlas with Fixed scale, so the map centers on the application at 1:5,000. The grid needs no change: it belongs to the main map, so its crosses and labels follow each application.
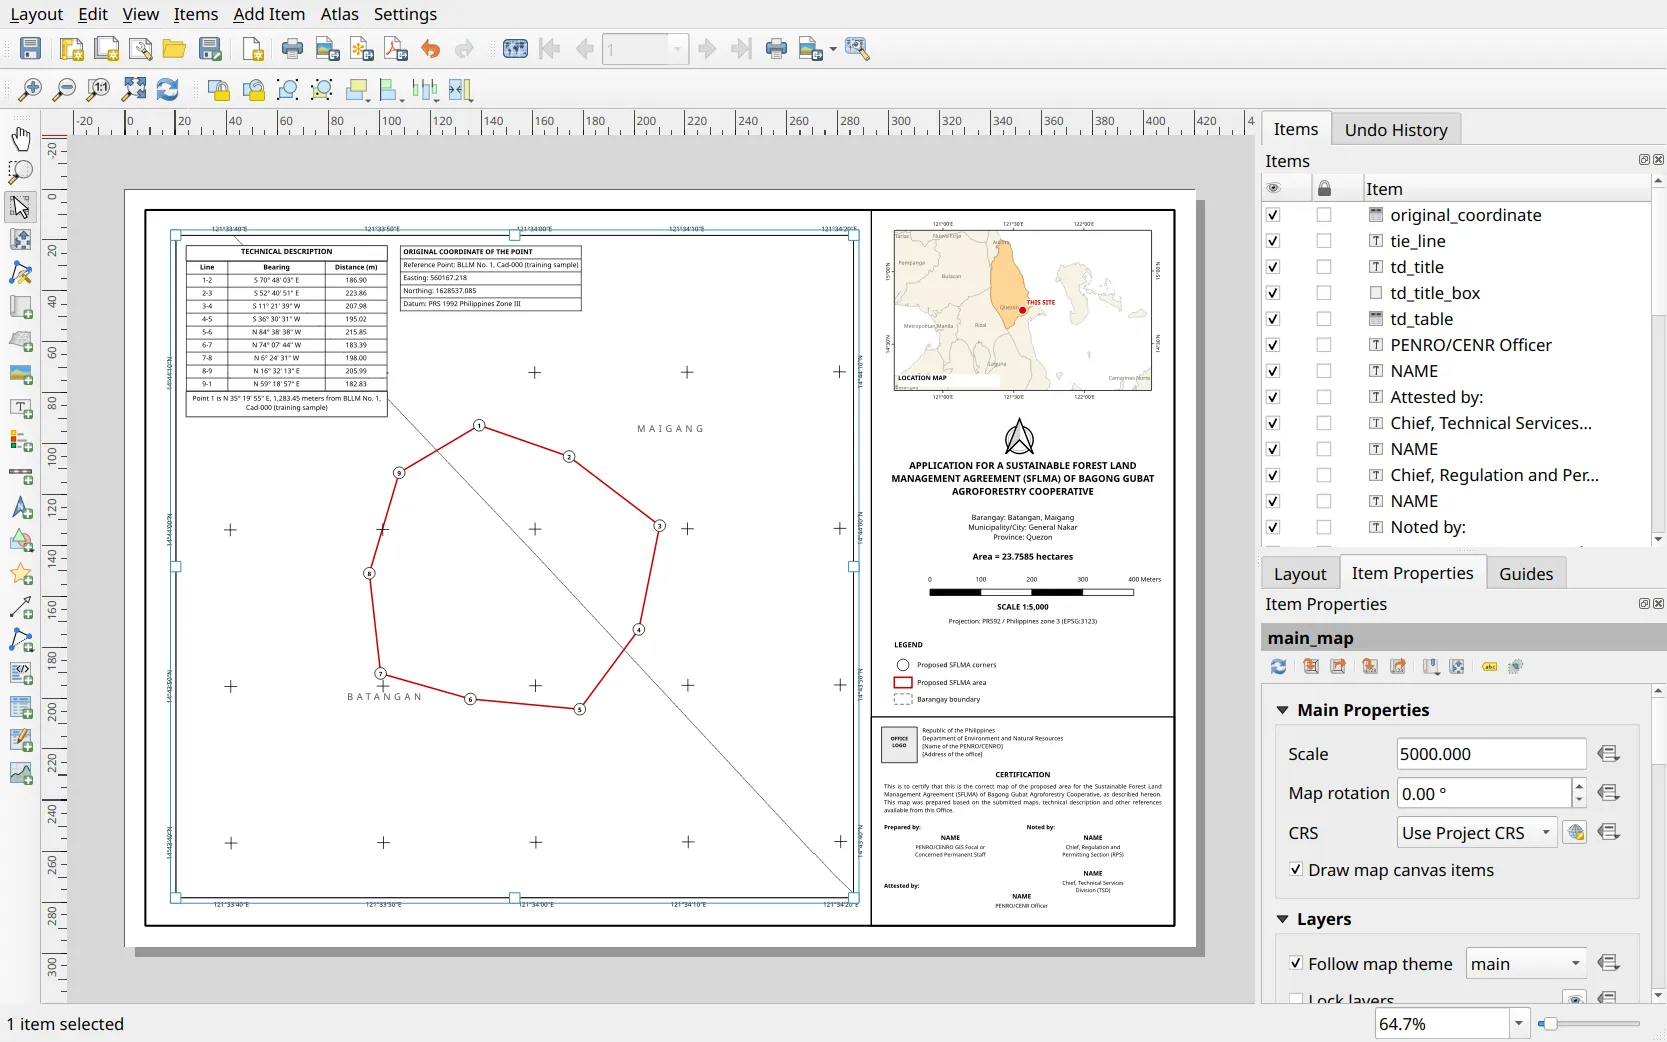
- Select the technical description table and, under Feature filtering, check Show only features intersecting atlas feature.
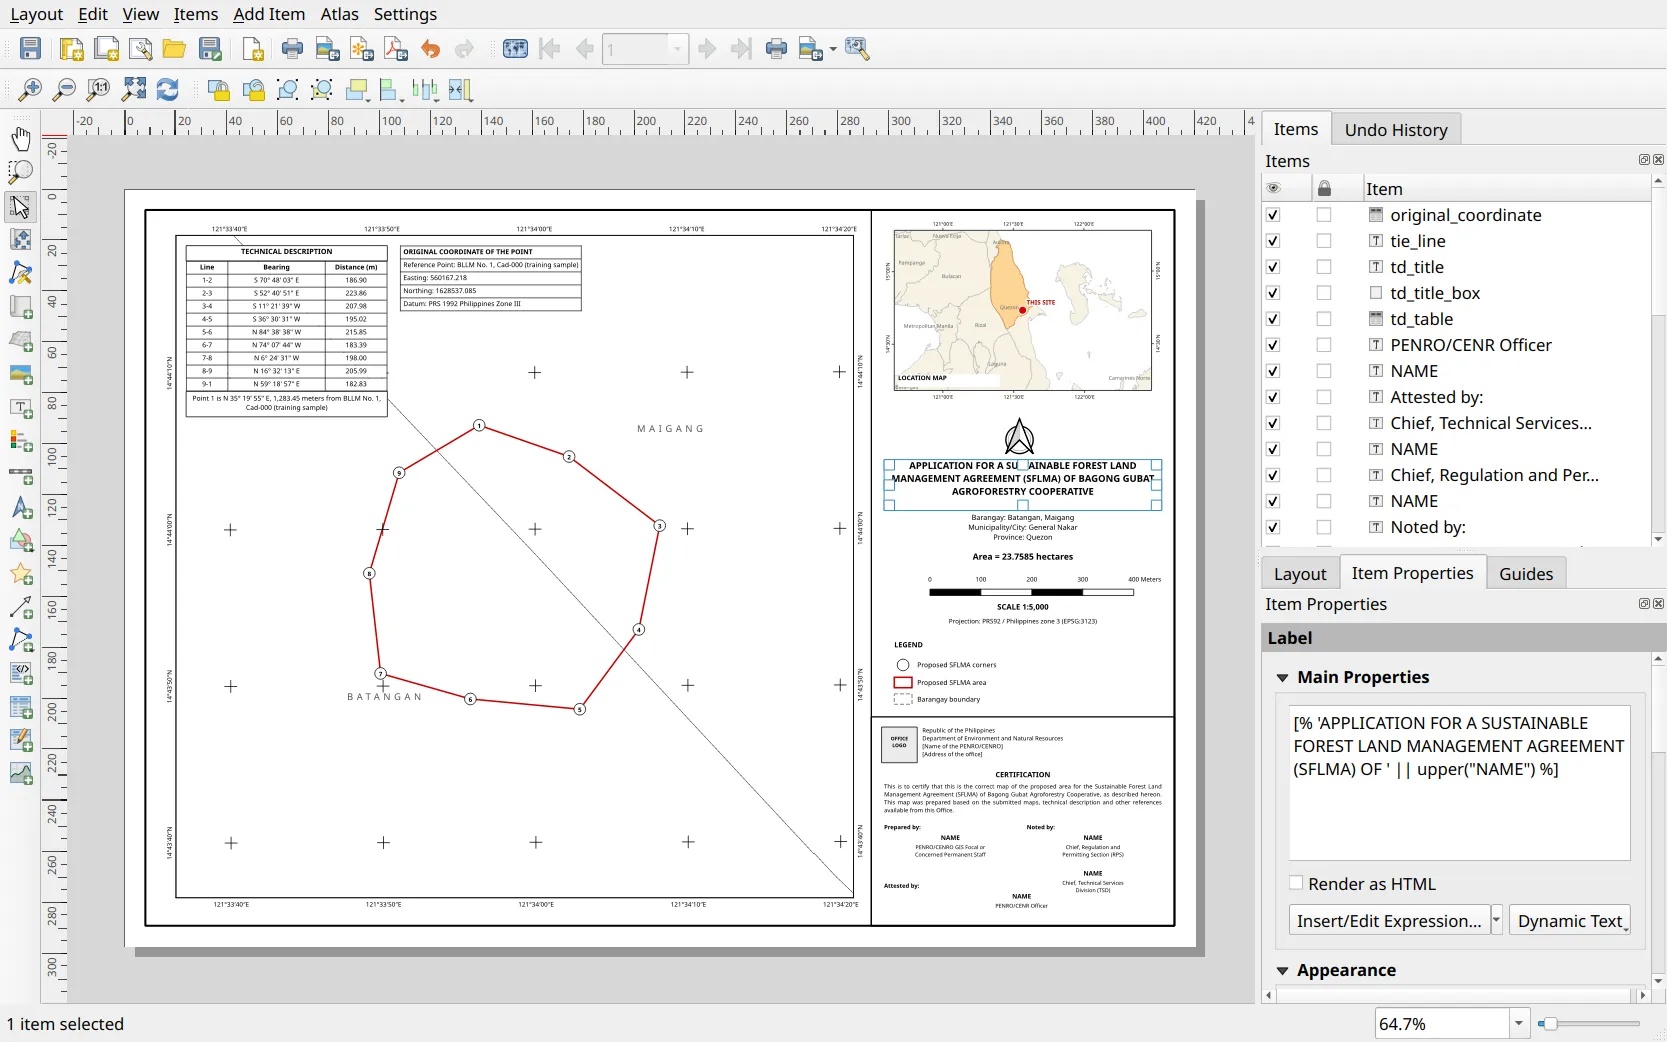
- Replace the layer lookups in the labels with the atlas feature’s fields:
| Label | One application | Atlas |
|---|---|---|
| Title | upper(aggregate('area_boundary', 'max', "NAME")) |
upper("NAME") |
| Location | aggregate('area_boundary', 'max', "BARANGAY"), and so on |
"BARANGAY", and so on |
| Area | aggregate('area_boundary', 'max', "AREA") |
"AREA" |
| Certification | aggregate('area_boundary', 'max', "NAME") |
"NAME" |
- On the location map, mark only the current application: in location_marker, change the symbology to Rule-based with this rule, and use the same expression for the label’s Show label data-defined override:
$id = @atlas_featureidand highlight the municipality the current application is in:
intersects($geometry, @atlas_geometry)- Click Preview Atlas on the Atlas toolbar to check the map, save the layout as a template (the completed one is SFLMA-prescribed-map-atlas.qpt), and export it with Atlas ‣ Export Atlas as PDF.
One layout for several applications
Section titled “One layout for several applications”An office that prepares or reviews many applications can produce all their maps from one layout: the atlas makes one page per application. The atlas needs all the applications in one coverage layer, while the guide requires separate shapefiles for each application. So the applications are merged into working layers, keyed by NAME, and the submission shapefiles are left untouched.
4.11. Preparing the applications’ layers
Section titled “4.11. Preparing the applications’ layers”What we have
Section titled “What we have”- The sample application’s area_boundary, area_corners, td_lines, and tie_point
- A second, fully prepared application in bnhr_qgis-sflma-mapping-001.gpkg: sample2_boundary, sample2_corners, sample2_td_lines, and sample2_tie_point (the Luntiang Bundok Agroforestry Association, 20.15 ha in Maigang and Minahan Norte)
- The boundary and corners already carry NAME. Add NAME to the sample application’s td_lines and tie_point with the Field Calculator (Text), read from its area boundary:
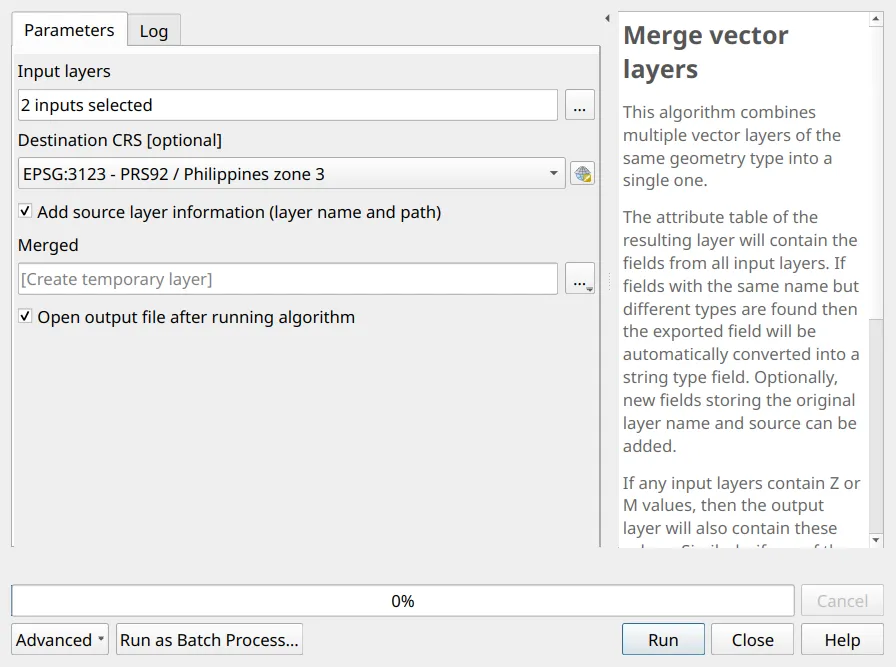
aggregate('area_boundary', 'max', "NAME")- Run Processing Toolbox ‣ Merge vector layers four times, once for each kind of layer: the two boundaries, the two corner layers, the two technical description line layers, and the two tie points.
- Save the four merged layers in a GeoPackage, load them, and name them area_boundary, area_corners, td_lines, and tie_point. The completed layers are applications_boundary, applications_corners, applications_td_lines, and applications_tie_point in bnhr_qgis-sflma-mapping-outputs.gpkg.
4.12. Keying the layout to the current application
Section titled “4.12. Keying the layout to the current application”Start from the atlas layout. The labels that read the atlas feature (title, location, area, certification) already work. The tables and the tie line read other layers, so they must be filtered to the current application by NAME.
- Select the technical description table. Under Feature filtering, uncheck Show only features intersecting atlas feature, check Filter with, and enter:
"NAME" = attribute(@atlas_feature, 'NAME')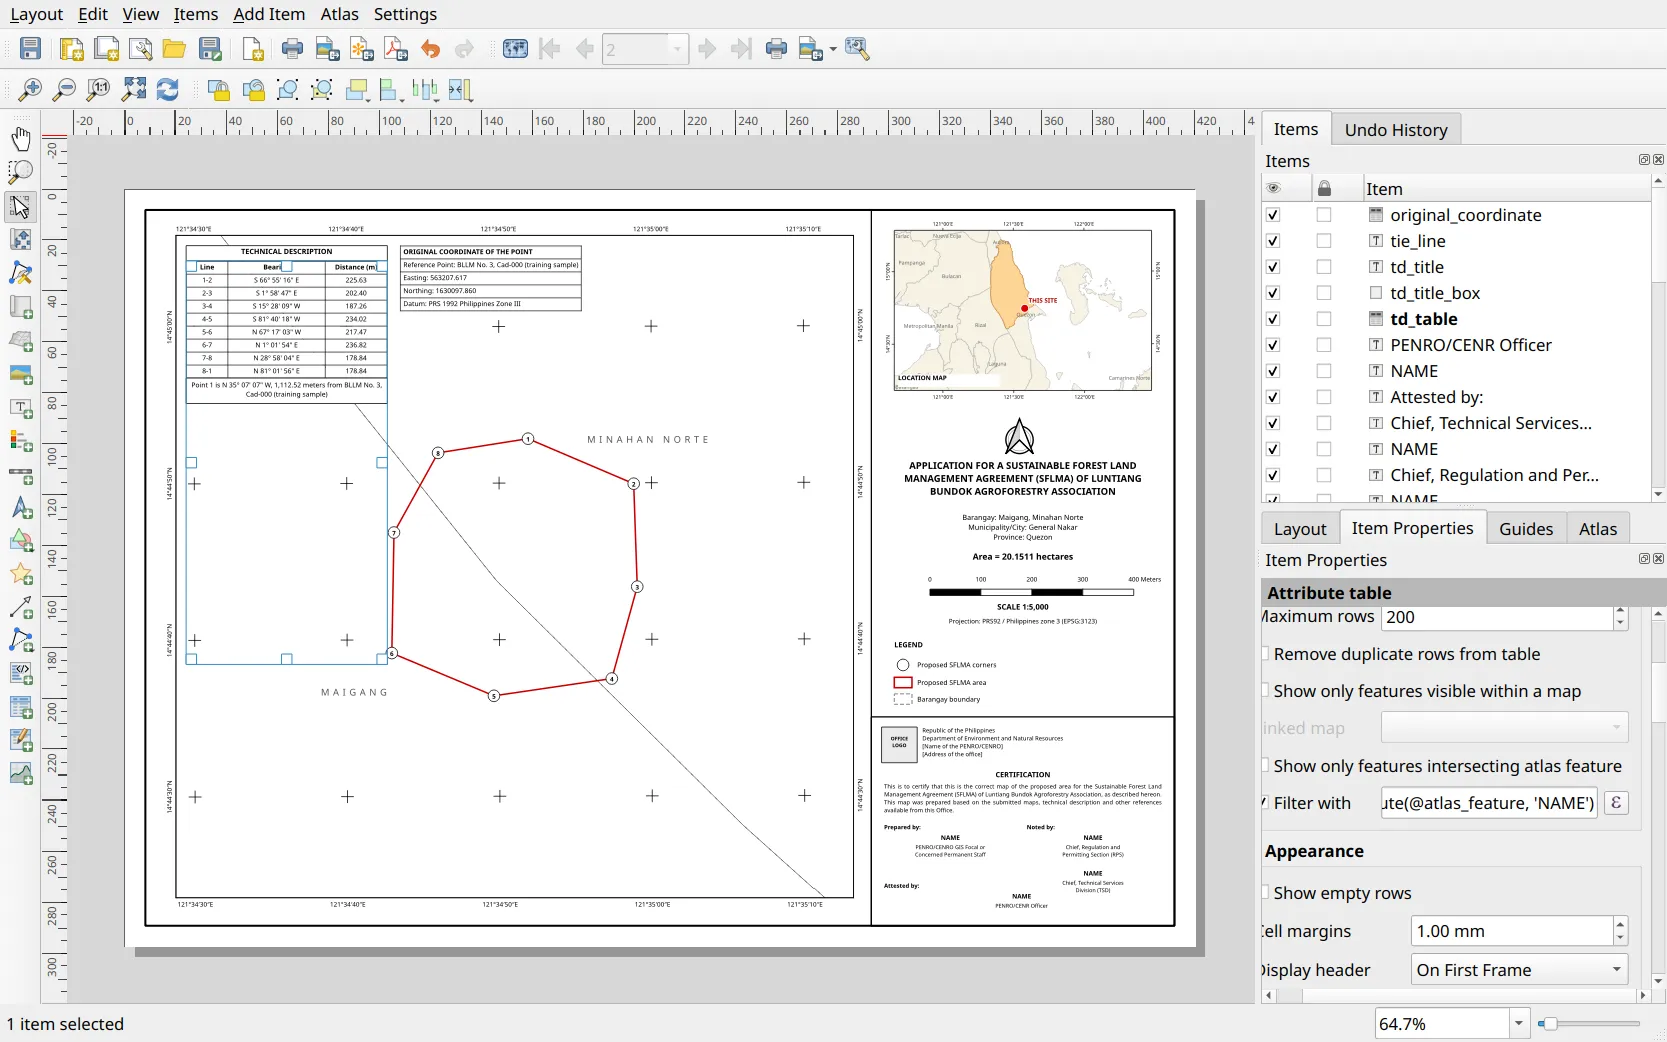
- Change the tie line label and the four cells of the original coordinate table to read the current application’s tie point:
[% attribute(get_feature('tie_point', 'NAME', "NAME"), 'TIE_LINE') %]'Reference Point: ' || attribute(get_feature('tie_point', 'NAME', "NAME"), 'ref_point')'Easting: ' || format_number(attribute(get_feature('tie_point', 'NAME', "NAME"), 'easting'), 3, omit_group_separators:=true)'Northing: ' || format_number(attribute(get_feature('tie_point', 'NAME', "NAME"), 'northing'), 3, omit_group_separators:=true)'Datum: ' || attribute(get_feature('tie_point', 'NAME', "NAME"), 'datum')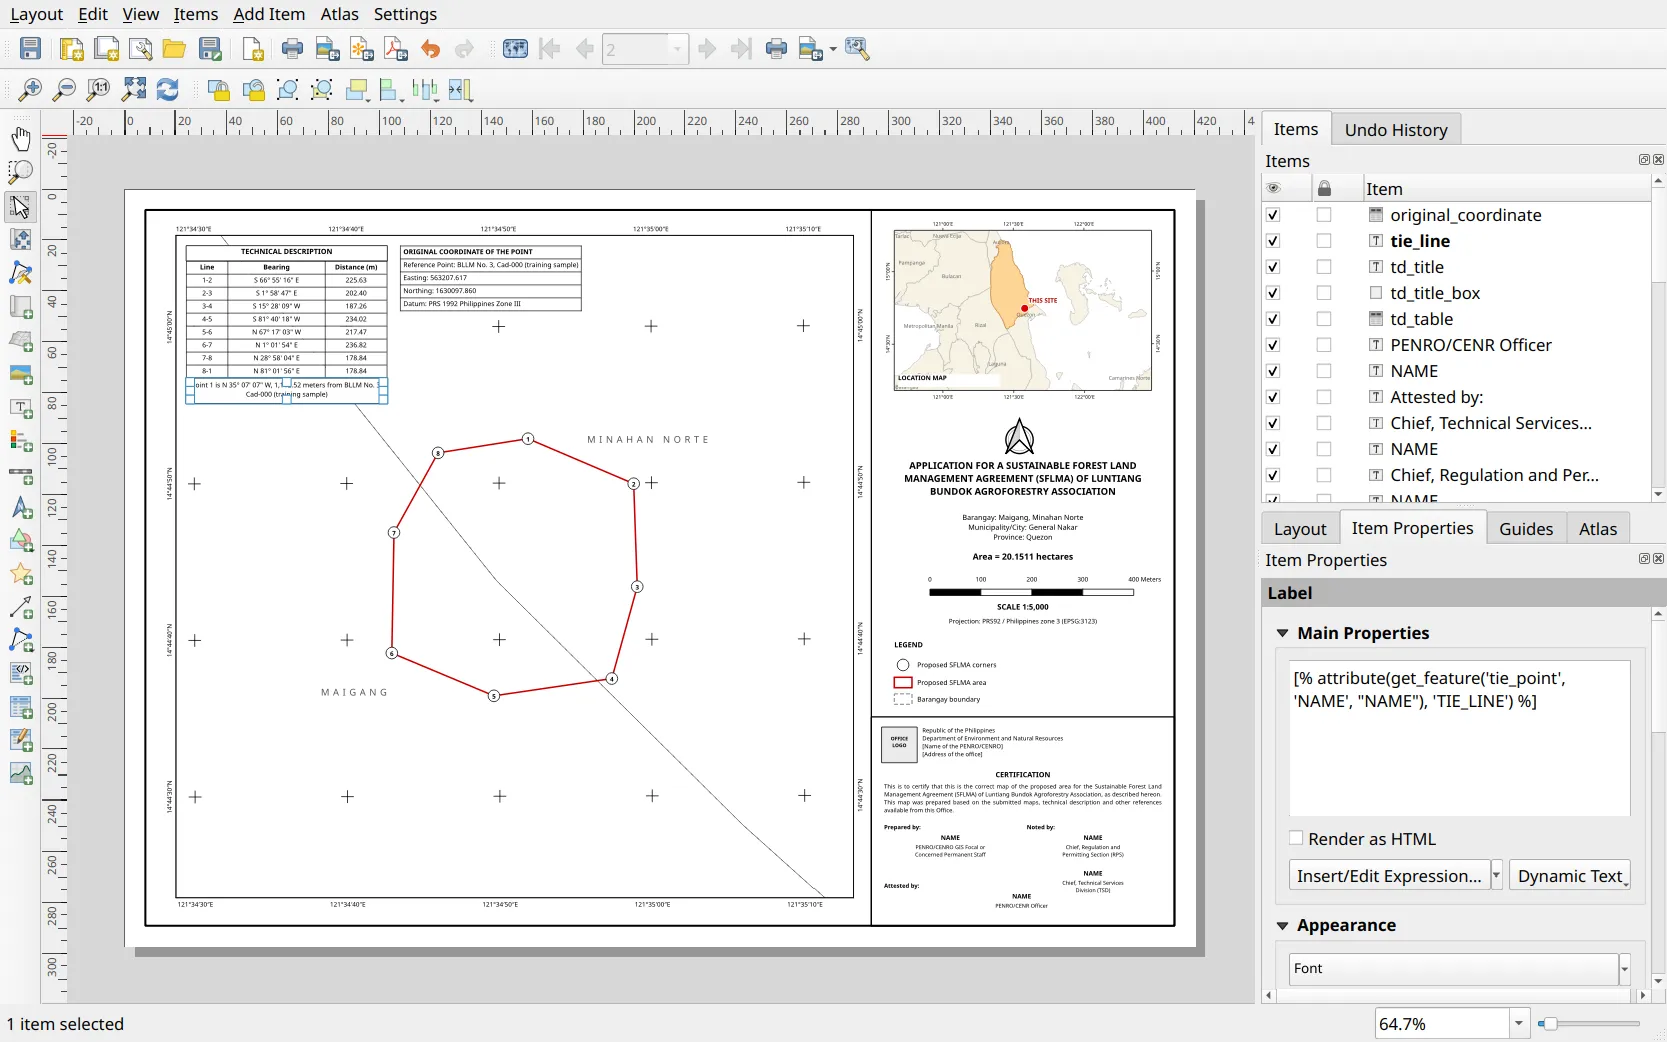
- Applications have different numbers of lines, so the table’s height changes from page to page. Make the table’s frame tall enough for the longest technical description (e.g. 30 lines), and place the tie line under the last row with a data-defined override of the label’s Y position (in Position and Size). With the table starting at 28 mm and rows 5.11 mm high:
28 + 5.11 * (1 + aggregate('td_lines', 'count', "LINE", filter:="NAME" = attribute(@atlas_feature, 'NAME')))The 1 + accounts for the table’s header row. Measure your own table’s top and row height in the layout and change the two numbers accordingly.
4.13. Previewing and exporting the maps
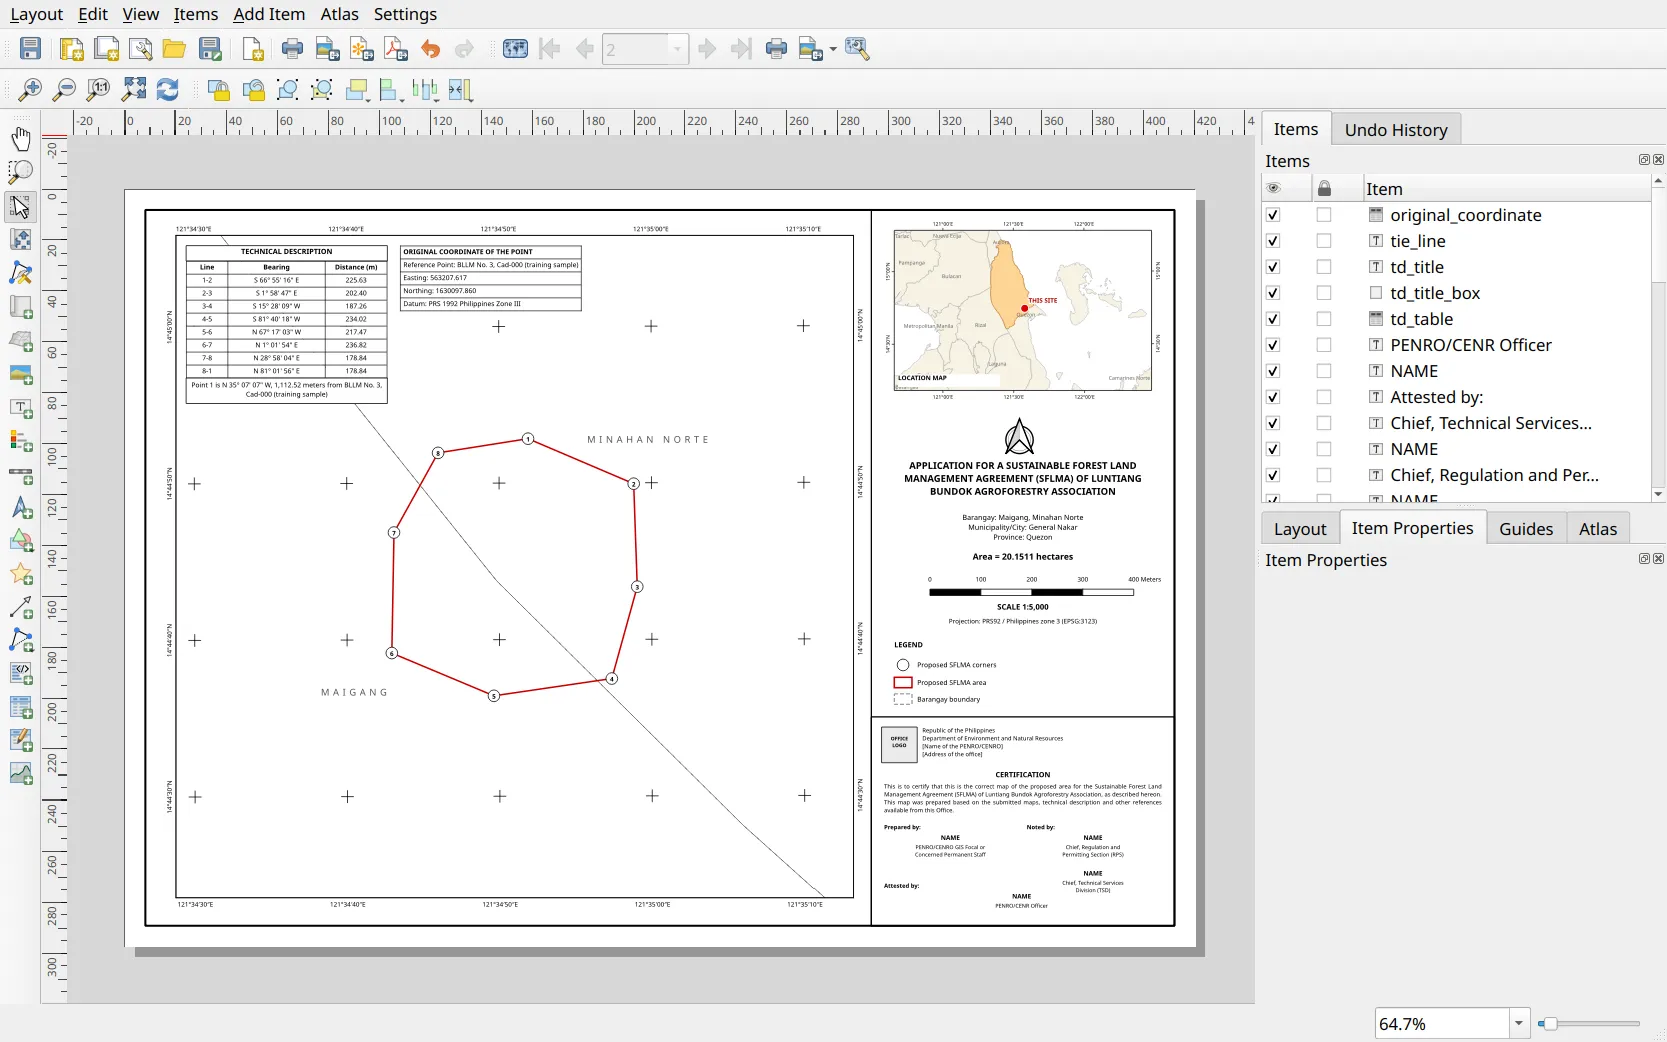
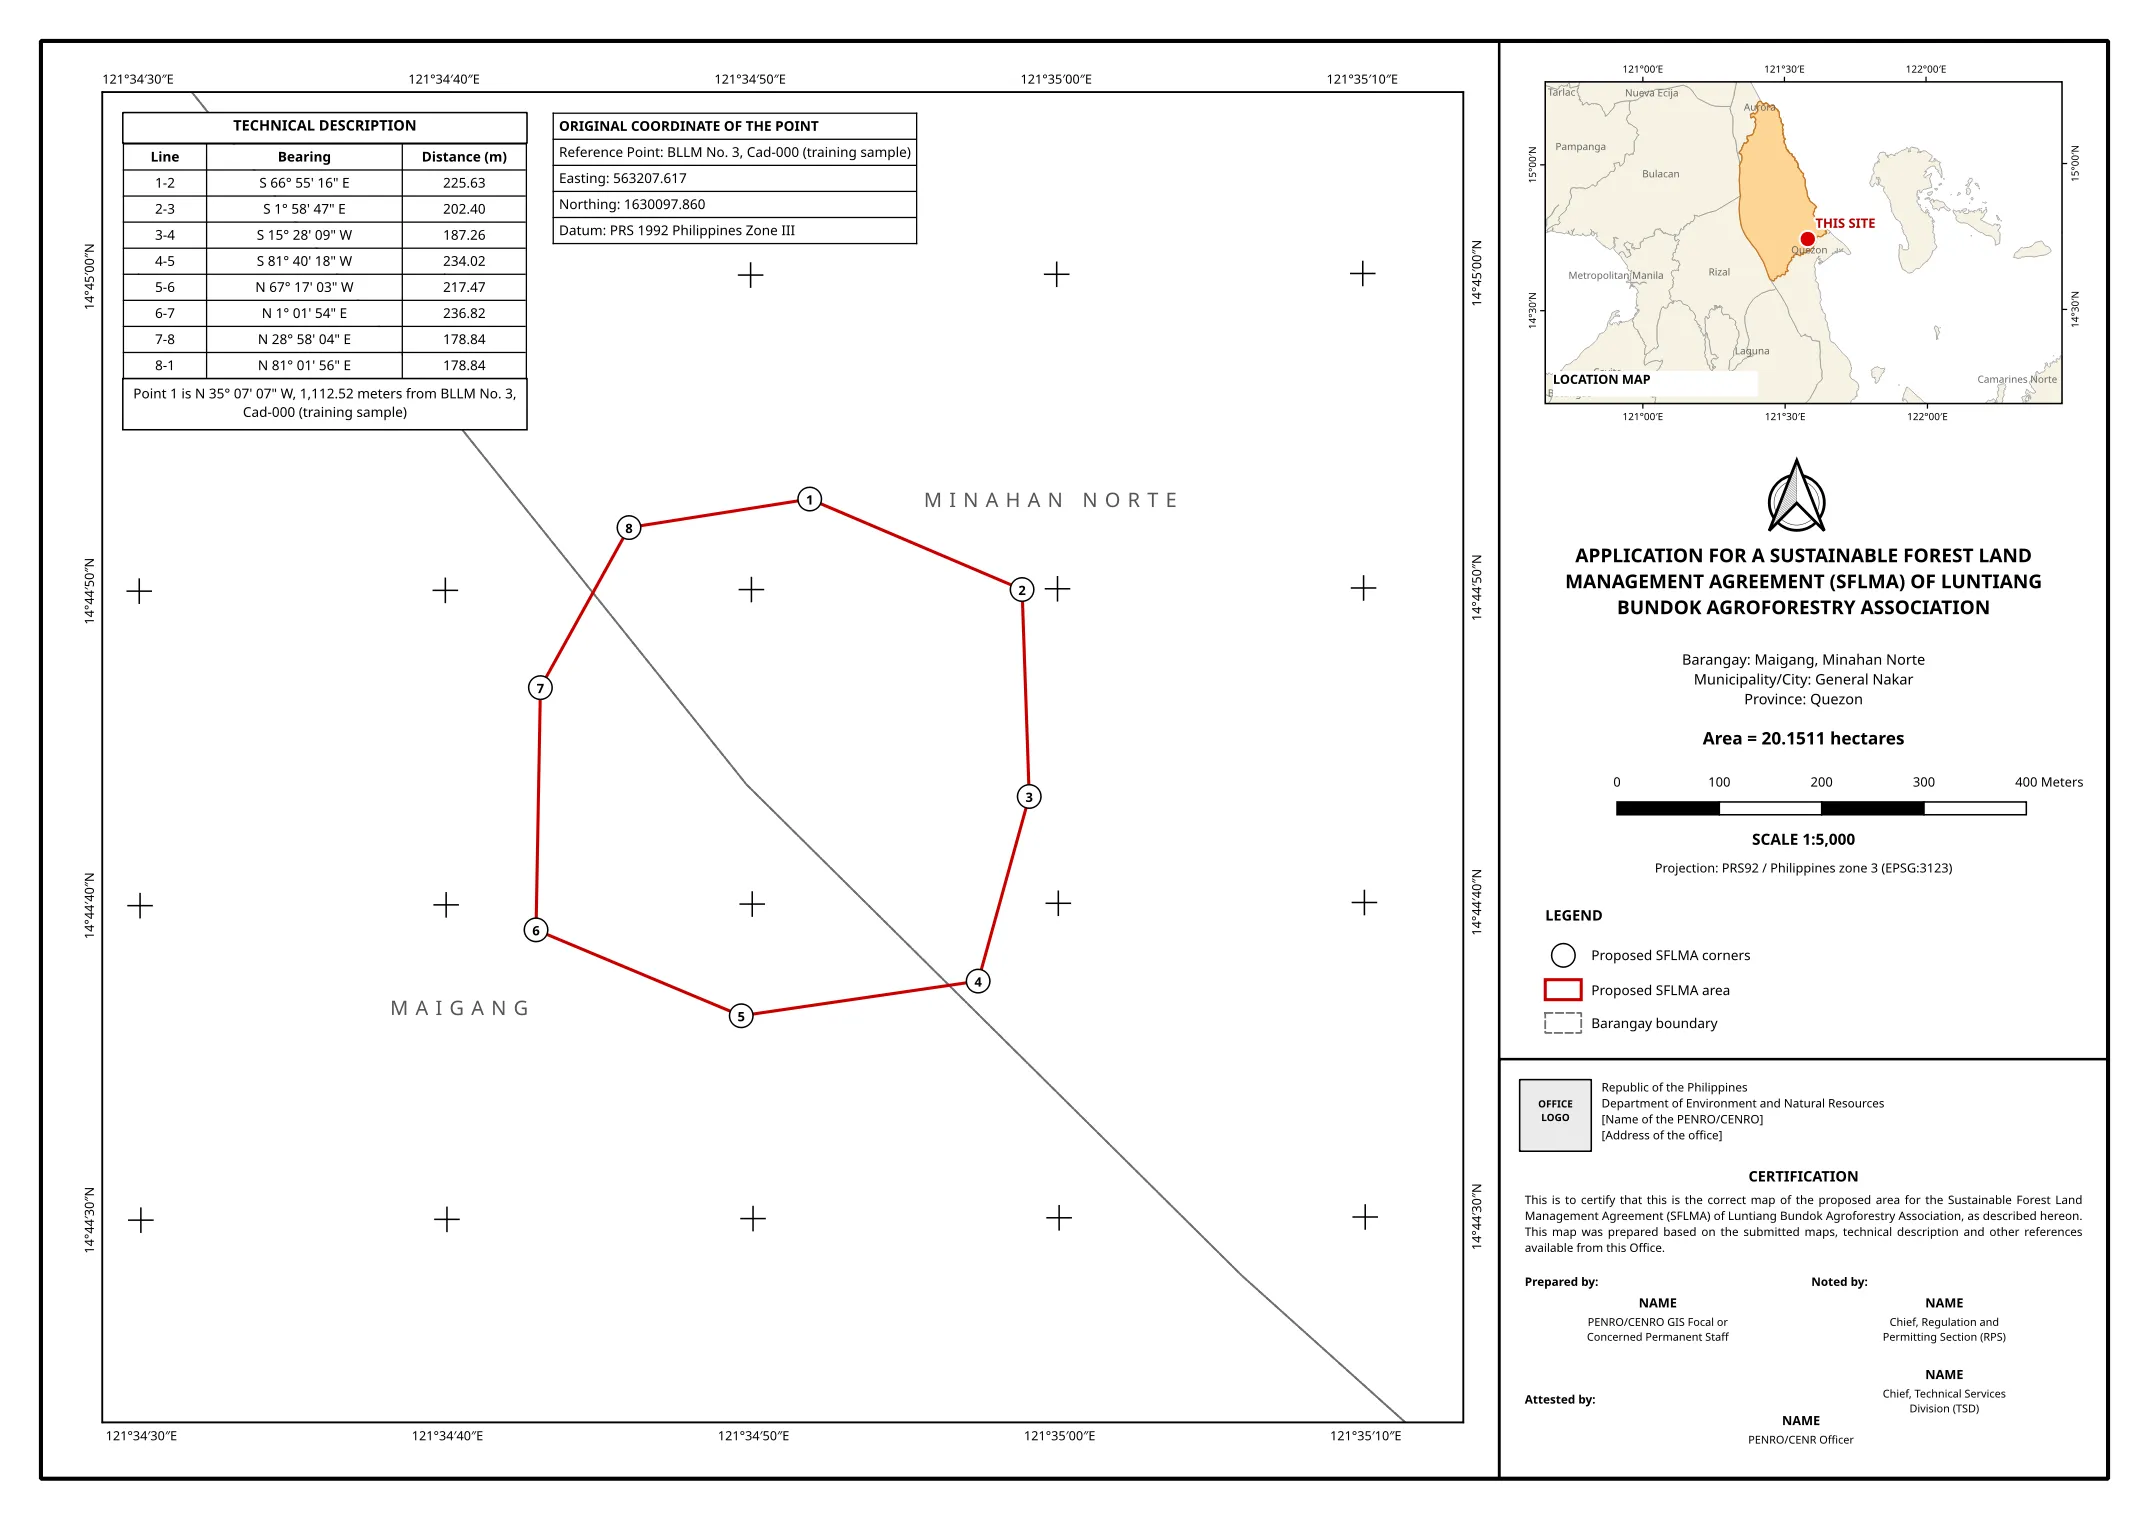
Section titled “4.13. Previewing and exporting the maps”- Click Preview Atlas and step through the pages: one page per application, each with its own map, tables, tie line, title, and certification.
- Export with Atlas ‣ Export Atlas as PDF, choosing a folder. The atlas writes one PDF per application, named by the output filename expression:
IV-A_SFLMA_Map_Bagong Gubat Agroforestry Cooperative.pdfIV-A_SFLMA_Map_Luntiang Bundok Agroforestry Association.pdf
The completed project is sflma-several-applications.qgz and the template is SFLMA-prescribed-map-several-applications.qpt.
Certification and support
Join an upcoming training to take this as an instructor-led course, or contact us to arrange one for your team or organization.