



The course’s sample data is clean: its application was plotted from its technical description, in the right coordinate reference system, with the guide’s fields. Area data that comes from an applicant, an office’s archive, or another program often is not. This primer is a checklist of what clean area data looks like, and where to see each check in QGIS. Run it on a layer before you use it in the course’s exercises, and especially before you use your own data.
It is the input’s counterpart of the final QC checklist, which checks the outputs before submission.
Debugging drill: clean a messy application, after Module 2, gives you a fictional application with every problem on this list, to find with the checklist and fix with QGIS’s own tools.
The checklist
Section titled “The checklist”| # | Check | What clean looks like | Where to see it in QGIS | Taught in |
|---|---|---|---|---|
| 1 | Where it came from | Plotted from a technical description, not digitized or traced | Ask the data’s owner; compare the number of vertices with the technical description’s corners | Plotting the application area |
| 2 | Files | .shp, .shx, .dbf, .prj and .cpg all there | The folder; Layer Properties ‣ Information (Sidecar files) | Shapefiles for submission |
| 3 | CRS | The technical description’s datum and zone | Layer Properties ‣ Information | Coordinate reference systems |
| 4 | Encoding | Names read correctly (ñ, not �) | Attribute table; Layer Properties ‣ Source | Here |
| 5 | Field names | The guide’s fields, none cut at 10 characters | Attribute table | Shapefiles for submission, 2.1 |
| 6 | Geometry type | Polygon, 2D, no Z or M | Layer Properties ‣ Information | 2.1 (polygon); here (Z and M) |
| 7 | Parcels | One feature per parcel | num_geometries($geometry) |
Multiple parcels |
| 8 | Validity | No errors | Processing Toolbox ‣ Check validity | 2.5 |
| 9 | Holes | None, unless they are real exclusions | num_interior_rings($geometry) |
Here |
| 10 | Corners | Every vertex a real corner: none on a straight line, no line under 1 m | num_points($geometry) - 1 against the technical description; Vertex Tool |
2.5 |
| 11 | Attributes | REGION in Roman numerals; names not abbreviated, spelled right | Attribute table | Rules for attribute values, 5.4 |
| 12 | Location | Inside the municipality and barangays it names | The reference layers | 2.6, 5.5 |
Checks 7 to 10 are about each parcel: check 7 first, so that each feature you check is one parcel.
What each check means
Section titled “What each check means”1. Where it came from
Section titled “1. Where it came from”An application area is plotted from its technical description or its list of corner coordinates (Exercises 2.2 and 2.3), so its corners are the technical description’s corners. A layer digitized on a map, or traced from a raster, has the technical description’s shape at best. The signs of tracing are many more vertices than the technical description has corners, vertices on straight lines, and holes the size of a raster’s cells (checks 9 and 10). Ask the data’s owner how the layer was made, and keep the technical description at hand: several checks below compare the layer with it.
2. Files
Section titled “2. Files”A shapefile is several files. Without the .prj, the layer opens with no CRS; without the .cpg, QGIS does not know how its text was written (check 4). Layer Properties ‣ Information lists the files beside the .shp as Sidecar files.
3. CRS
Section titled “3. CRS”The layer must be in the technical description’s datum and zone (Module 1). A layer in another CRS, such as WGS 84 (EPSG:4326), is moved into it with Processing Toolbox ‣ Reproject layer. Assigning it another CRS instead (in Layer Properties ‣ Source, or Set CRS) only relabels its coordinates: degrees read as meters land more than a thousand kilometers away. And never convert between Luzon 1911 and PRS 1992.
4. Encoding
Section titled “4. Encoding”The .dbf stores text as bytes, and the .cpg says which encoding turns them back into letters. Without a .cpg, QGIS reads the text as UTF-8, and a name written by a program that uses Windows’ encoding shows its ñ as �. Set Layer Properties ‣ Source ‣ Data source encoding (windows-1252 for files from most Windows programs) and check that the names read correctly. The setting holds only in your project: save the layer again with the encoding UTF-8, which writes a .cpg, so that it reads correctly everywhere.
5. Field names
Section titled “5. Field names”The shapefile format cuts field names at 10 characters, so a field named MUNICIPALITY by another program arrives as MUNICIPALI. A field cut short, or named otherwise than the guide names it (Brgy for BARANGAY), is not the guide’s field. Processing Toolbox ‣ Refactor fields renames fields and sets their types and lengths in one step.
6. Geometry type
Section titled “6. Geometry type”QGIS reads every polygon shapefile as MultiPolygon, which is fine. A type ending in Z or M, such as MultiPolygonZ, means the layer is 3D or carries measures, which the guide’s shapefile does not. When the Z values carry nothing (their highest value is 0), drop them with Processing Toolbox ‣ Drop M/Z values:
z_max($geometry)7. Parcels
Section titled “7. Parcels”The guide asks for one polygon shapefile with one feature per parcel (Multiple parcels). A feature of several parcels has more than one part:
num_geometries($geometry)Processing Toolbox ‣ Multipart to singleparts makes each part a feature. It copies the feature’s attributes to every part, so compute each parcel’s attributes again, AREA first.
8. Validity
Section titled “8. Validity”Run Processing Toolbox ‣ Check validity with the GEOS method, as in Exercise 2.5, and fix an error by hand against the technical description, not with Fix geometries. An error in a hole goes with the hole (check 9).
9. Holes
Section titled “9. Holes”A hole is an inner ring of a polygon:
num_interior_rings($geometry)A technical description describes a boundary only, so a hole is either a real exclusion (land inside the boundary that is not applied for, with its own description) or an artifact, such as the cells of a raster the area was traced from: small squares, all the size of the raster’s cells. Decide which with the data’s owner. Delete artifacts with Processing Toolbox ‣ Delete holes, setting Remove holes with area less than just above the largest artifact, so that a larger hole stays. Deleting a hole adds its area to the application’s: record by how much. A hole left in breaks Module 3: Extract vertices gives a hole’s vertices as corners.
10. Corners
Section titled “10. Corners”A parcel without holes has as many corners as its vertices, without the closing one. Compare them with the technical description’s corners:
num_points($geometry) - 1The shortest line between two vertices, in meters when the layer is in the national grid:
array_min(array_foreach(geometries_to_array(segments_to_lines($geometry)), length(@element)))Vertices on straight lines are removed by Processing Toolbox ‣ Simplify with the method Distance (Douglas-Peucker) and a tolerance of 0.01 m: it removes only the vertices within a centimeter of a straight line, so the area does not change measurably. A vertex that is neither on a line nor a corner of the technical description is moved or deleted by hand, with the Vertex Tool, against the technical description.
11. Attributes
Section titled “11. Attributes”The guide’s rules for attribute values, checked with the expressions of Exercise 5.4. Compare names with the reference layers’ spelling: a name spelled differently from the reference layer is either a misspelling or a reference layer to correct.
12. Location
Section titled “12. Location”The application lies in the municipality and barangays it names. The hectares of it outside its municipality (put the municipality’s name in place of General Nakar):
area(difference($geometry, aggregate('ref_municipalities', 'collect', $geometry,filter:="muni_city" = 'General Nakar'))) / 10000Compare its barangays with the BARANGAY expression. A part outside is not yours to fix: reference layers are indicative, and either the boundary, the attributes, or the reference layer is wrong. Flag it, with the hectares, for the data’s owner.
P1.1. Inspecting an application against the checklist
Section titled “P1.1. Inspecting an application against the checklist”Level: Beginner
What we want to achieve
Section titled “What we want to achieve”- The twelve checks run on one application, and what each one reads like when the area data is clean.
What we have
Section titled “What we have”- IV-A_SFLMA_Polygon_Bagong Gubat Agroforestry Cooperative.shp in the outputs subfolder of the BNHR_QGIS-for-SFLMA-Mapping folder: the sample application’s area boundary, as Module 2 makes it (or your own from Module 2).
- sample_td, ref_barangays, and ref_municipalities from bnhr_qgis-sflma-mapping-001.gpkg.
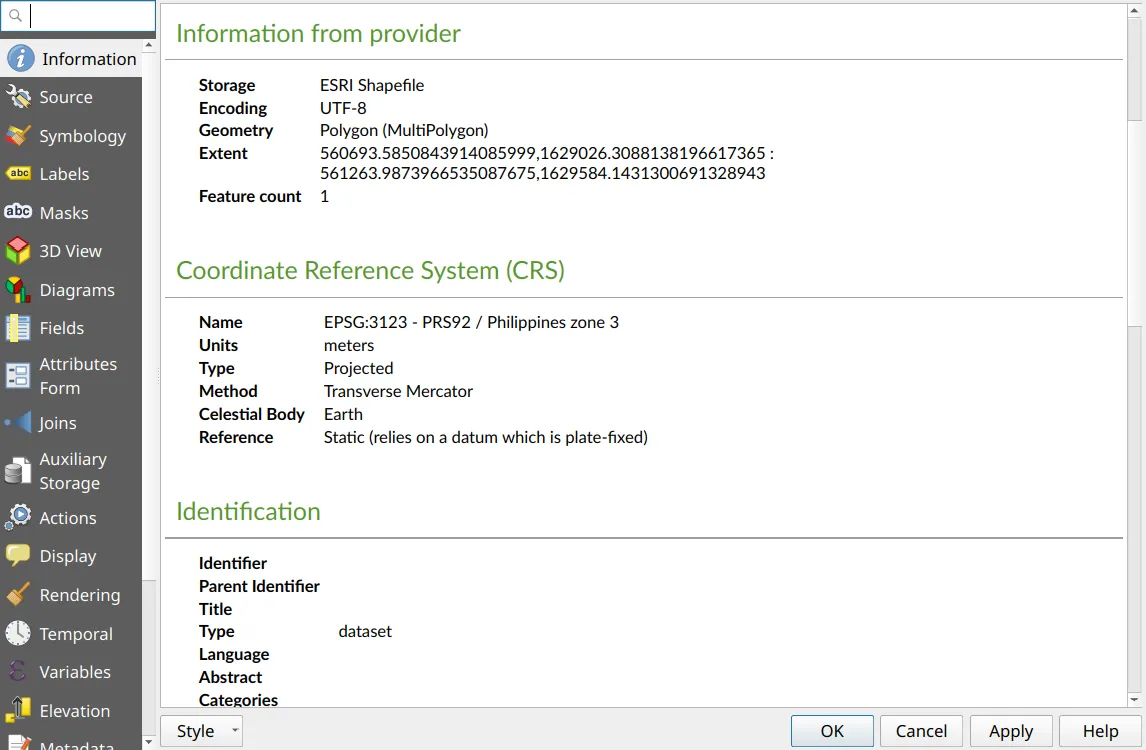
- Load the shapefile and the three layers, and name the shapefile area_boundary in the Layers panel. Open its Layer Properties ‣ Information and read checks 2, 3, 4, and 6, and the feature count.
- Open the attribute table and read the field names (check 5) and the values (check 11).
- Open the Field Calculator, and type each expression of checks 7, 9, 10, and 12 in turn: the Preview under the expression shows its value for the feature, without creating a field. Cancel when you are done.
- Run Processing Toolbox ‣ Check validity with the GEOS method (check 8), and count the lines of sample_td (check 10).
For the sample application, every check passes:
| # | Check | The sample reads |
|---|---|---|
| 1 | Where it came from | Plotted from its technical description (Exercise 2.2) |
| 2 | Files | .cpg, .dbf, .prj, .shp, .shx |
| 3 | CRS | EPSG:3123 - PRS92 / Philippines zone 3 |
| 4 | Encoding | UTF-8 |
| 5 | Field names | AREA, NAME, TENURE, REGION, PROVINCE, MUNI_CTY, BARANGAY |
| 6 | Geometry type | Polygon (MultiPolygon) |
| 7 | Parcels | 1 feature; num_geometries 1 |
| 8 | Validity | 1 valid, 0 invalid |
| 9 | Holes | num_interior_rings 0 |
| 10 | Corners | 9 corners for the 9 lines of sample_td; shortest line 182.83 m |
| 11 | Attributes | REGION IV-A; nothing abbreviated |
| 12 | Location | 0.0000 ha outside General Nakar; Batangan,Maigang, as the BARANGAY expression gives |
Run the checklist on your own area data, with its technical description at hand. Write down, for each check, what your layer reads and whether it passes. Which problems can you fix yourself, and which are for the data’s owner to answer?